
ABSTRACT
Background
The reactivation of fetal γ-globin expression is an effective strategy for ameliorating the clinical symptoms of β-hemoglobinopathies. However, the mechanism of globin switching, especially the roles of long non-coding RNAs (lncRNAs) in this process, remains elusive.
Methods
We compared the in vivo transcriptome profiles of nucleated red blood cells (NRBCs) isolated from the umbilical cord blood of preterm and full-term newborns. We collected 75 umbilical cord blood samples and performed qPCR of the candidate genes.
Results
In this study, we identified 7,166 differentially expressed protein-coding genes, 3,243 differentially expressed lncRNAs, and 79 differentially expressed microRNAs. Our data show that the Fanconi anemia pathway and the H19/let-7/LIN28B axis may be involved in γ- to β-globin gene switching. Moreover, we constructed the hub gene network of the differentially expressed transcription factors. Based on qPCR, we found that BCL11A was differentially expressed based on biological sex. We also confirmed that H19 is differentially expressed and established the H19-related network to reveal the potential regulatory mechanisms.
Conclusion
We present the profiles of the in vivo transcriptome differences of NRBCs between preterm and full-term neonates for the first time, and provide novel research targets for β-hemoglobinopathies.
1. Introduction
Sickle cell disease (SCD) and β-thalassemia are chronic hemolytic anemias caused by point mutations or large deletions in the β-globin gene (HBB) [Citation1]. Patients with β-thalassemia major rely on the combination of blood transfusions and iron chelation therapy to sustain life. At present, hematopoietic stem cell (HSC) transplantation is the only curative treatment for these diseases. However, it is difficult to find a sufficiently matched donor, and HSC transplantation is extremely complex and expensive, which has limited its wider application [Citation2]. In contrast, gene therapy is considered to be a promising approach to treat β-thalassemia and SCD [Citation3,Citation4]. Previous studies found that patients with hereditary persistence of fetal hemoglobin were clinically asymptomatic owing to persistently high levels of fetal hemoglobin (HbF), indicating that increasing the HbF level is a gene therapy strategy for β-hemoglobinopathies treatment [Citation1,Citation2].
During human development, adult hemoglobin (HbA, α2β2) gradually replaces HbF (α2γ2) as the major hemoglobin after birth [Citation5]. Actually, there are five functional genes, arranged in the order 5′-ϵ-Gγ-Aγ-δ-β−3′, in the β-globin gene cluster on chromosome 11; these genes are expressed sequentially following the order of their 5’ to 3’ chromosomal arrangement [Citation6]. Before and after birth, the expression of γ-globin genes (HBG1/HBG2) gradually decreases and the expression of HBB gradually increases [Citation5].
Some studies have reported transcriptome changes associated with γ- to β-globin switching using in vitro-cultured CD34+ cells [Citation7,Citation8]. To date, few studies examined the transcriptome profiles related to globin switching based on fresh in vivo samples. Since CD34+ cells cultured in vitro express higher baseline levels of HbF compared with erythroid cells in vivo, suggested that culture systems cannot truly reflect erythroid proliferation and differentiation in vivo [Citation4]. Consequently, the use of nucleated red blood cells (NRBCs) from the umbilical cord blood of neonates at different gestational stages can better reflect the in vivo differentially expressed genes associated with the globin switching process.
MicroRNAs (miRNAs), long non-coding RNAs (lncRNAs), circular RNAs, and other non-coding RNAs have been found to have important gene transcriptional regulatory functions. Recently, several studies have indicated that non-coding RNAs play key roles in globin gene switching, such as HMI-LNCRNA and BGLT3 [Citation9,Citation10]. However, the current understanding of globin switching is far from comprehensive (Figure S1), particularly with regard to the role of lncRNAs.
In this study, we collected umbilical cord blood samples both from preterm (30–35 gestation weeks) and full-term newborns (over 40 gestation weeks), and performed total RNA sequencing (RNA-seq) and small RNA-seq to compare the transcriptome profiles of preterm and full-term newborns.
2. Materials and methods
2.1. Editorial policies and ethical considerations
This study design was approved by the ethics committee of Guizhou Provincial People’s Hospital and conformed to the Declaration of Helsinki. All parents of the included neonates gave written informed consent.
2.2. Subjects
For the purpose of RNA-seq analysis, umbilical cord blood samples were collected from three healthy female preterm neonates (gestational age: 30–35 weeks) and three female full-term neonates (gestational age: ≥40 weeks) who were delivered in the Obstetrical Department of Guizhou Provincial People’s Hospital. In addition, we collected 75 samples from healthy neonates (32 preterm neonates including 15 females and 17 males; 43 full-term neonates including 21 females and 22 males) to verify the differential expression of transcripts by real-time quantitative PCR (RT-qPCR).
2.3. Separation of NRBCs from umbilical cord blood
We collected umbilical cord blood samples from each neonate for the isolation of NRBCs, analyzed hemoglobin by capillary electrophoresis used CAPILLARYS 2 (Sebia, Lisses, France), and detected the thalassemia gene with a kit provided by Yishengtang Biological Enterprise (Shenzhen, China).
NRBCs were separated using a two-step method. First, mononuclear cells (MNCs) were enriched by density gradient centrifugation, and then NRBCs (CD71 + CD45−) were isolated from MNCs using a midiMACS magnetic separation system (Miltenyi Biotech, Bergisch Gladbach, Germany). After incubation with FITC-conjugated anti-CD71 and PE-conjugated anti-CD235a antibodies (Miltenyi Biotec), the purity of isolated NRBCs was assessed by flow cytometry (BD-FACSAria™ II or BD-FACSAria™ Fusion, NJ, USA). The isolated NRBCs were stained with Wright’s stain and brilliant cresyl blue to facilitate the observation of cell morphology.
2.4. Extraction of total RNA and construction of the sequencing library
Total RNA was extracted from NRBCs using TRIzol® reagent (Invitrogen, Carlsbad, CA, USA) in accordance with the manufacturer’s instructions. Only samples with RNA integrity numbers >8 and an 28S/18S ratio >1.5 were subjected to sequencing library construction. Then, the small RNA library (BGI RNA-seq kit, BGI, Shenzhen, China) and the ribosomal RNA depletion library (Ribo-Zero™ rRNA Removal Kit and TruSeq® Stranded Total RNA Sample Preparation Kit, Illumina, San Diego, CA, USA) were separately constructed for RNA-seq.
2.5. RNA-seq and data analysis
The BGIseq-500 sequencer and the Illumina HiSeq 4000 platform were utilized for small RNA-seq and RNA-seq, respectively. Single-end 50 bp reads and 2× 150 bp paired-end reads were generated, respectively. The raw data were filtered to obtain clean data for downstream bioinformatics analyses.
For small RNAs, clean reads were aligned to the reference genome (GRCh37/hg19) and other small RNA databases using Bowtie2 [Citation11], and then classified and annotated. The expression level of each small RNA was calculated and standardized based on the transcripts per kilobase million value. We combined miRanda [Citation12] and TargetScan [Citation13] to predict miRNA targets. NOISeq [Citation14] was used to screen differentially expressed small RNAs between the groups (fold change ≥2 and diverge probability ≥0.6). Hierarchical clustering analysis was performed by the R package pheatmap, and visualized by Treeview.
For mRNAs and lncRNAs, clean reads were mapped to the reference genome (GRCh37/hg19) using HISAT [Citation15]. StringTie [Citation16] was used to assemble and compare the transcripts with known mRNAs or lncRNAs. Cuffmerge [Citation17] was used to prepare the merged transcripts, which were used for downstream analysis. The reads were aligned to the GRCh37/hg19 using Bowtie2 [Citation11], and then differential expression analysis between groups was performed using DEGSeq [Citation18] (fold change ≥2, Q-value <0.001). Principal component analysis was performed by plotPCA in the deepTools suite with default parameters [Citation19].
We predicted the target genes of lncRNAs and used ClusterProfiler [Citation20] to perform Gene Ontology (GO) and Kyoto Encyclopedia of Genes and Genomes (KEGG) enrichment analysis of the differentially expressed mRNAs and the target genes of differentially expressed miRNA and lncRNAs. The threshold adopted for the adjusted P-value was ≤ 0.05.
2.6. Comparative analysis with published datasets
We downloaded previously published datasets i.e. one miRNA dataset derived from Lessard et al. and three mRNA datasets from Lessard et al., Huang et al., and Xu et al. (GSE102182, GSE36994, GSE110936) [Citation7,Citation8,Citation21] for the comparison of the upregulated and downregulated miRNAs and mRNAs with our transcriptome sequencing data, separately. The overlap genes were visualized by the Venn Diagrams function in R.
2.7. Identification of hub genes
All transcription factors (TFs) contained in the differentially expressed mRNAs were selected according to the Human TFDB database [Citation22]. The STRING database [Citation23] was employed to construct the protein–protein interaction (PPI) network for the differentially expressed TFs with the confidence score ≥0.4. Hub genes of the differentially expressed TFs were identified by the CytoHubba plugin according to their connection degree, and the networks were visualized by the software Cytoscape [Citation24].
2.8. Real-time quantitative PCR analysis
We isolated NRBCs from 75 umbilical cord blood samples using the method described above. Total RNA was extracted from the NRBCs, from which mRNA-specific cDNA was synthesized using the reverse transcription system (TAKARA, Shiga, Japan). miRNA-specific cDNA synthesis was performed using poly(A)-tailing method (NEB, Ipswich, MA, USA) and priming with miR-RT-Primer. RT-qPCR assays were performed using SYBR® Green qPCR kit (KAPA Biosystems, Wilmington, MA, USA). GAPDH and U6 was used as the endogenous control gene for mRNA and miRNA, separately. The primer sequences are shown in Table S1,2. The mRNA expression levels were calculated by the 2−ΔΔCt method.
2.9. Constructing the H19-related lncRNA/miRNA/mRNA network
The H19-related lncRNA/miRNA/mRNA interaction pairs were acquired from the STRING [Citation23], starBase [Citation25], and miRDB [Citation26] databases. Cytoscape was used to visualize the lncRNA/miRNA/mRNA network.
2.10. Statistical analyses
Data are presented as mean ± s.d. Statistical comparisons between experimental groups were analyzed by Student’s t-test (two-tailed), with P <0.05 considered to indicate a statistically significant difference. Principal component analysis was performed on RNA-seq data to determine the overall differences between samples. Hierarchical clustering analysis was performed to display the expression of differentially expressed miRNA in different samples.
3. Results
3.1. Hemoglobin electrophoresis and thalassemia gene detection for umbilical cord blood samples and flow cytometry analysis of enriched nucleated red blood cells
The analysis of hemoglobin components in the six cord blood samples used for RNA-seq analysis is shown in a. The average HbF levels of the full-term female (FF) group and preterm female (PF) group were statistically different (84.5% ± 8.1% and 57.8% ± 8.1%, respectively; P = 0.016). The gene detection results showed that none of the six neonates carried any of the three α-globin gene deletion mutations, the three non-deletion mutations, or the 17 β-globin gene mutations that are most common in the Chinese population (Figure S2a).
Figure 1. The results of hemoglobin electrophoresis and the purity of isolated NRBCs. (a) The average HbA and HbF levels of full-term female neonates and preterm female neonates. (b) Flow cytometry analysis of MNCs. (c) Flow cytometry analysis of isolated NRBCs, in which Q3 corresponds to CD71+ CD45− cells. (c) Wright’s staining (100×). (d) Brilliant cresyl blue staining of NRBCs (100×).
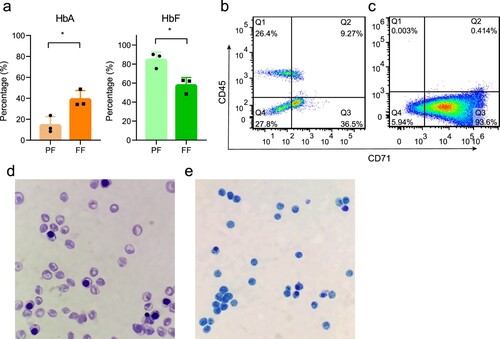
The isolated NRBCs (CD71 + CD45−) were analyzed by flow cytometry to determine purity, the average purity of all samples was >93% (b, c). According to the Wright’s staining results, the isolated NRBCs comprised mostly orthochromatic erythroblasts, rare polychromatic erythroblasts, basophilic erythroblasts, and pro-erythroblasts (d). The NRBCs were further identified as reticulocytes by brilliant cresyl blue staining (e). Overall, NRBCs and reticulocytes accounted for >99% of the sorted cells.
3.2. Differentially expressed small RNAs, mRNAs, and lncRNAs between preterm and full-term neonates
Following small RNA-seq, more than 23 million clean reads were generated from each sample. We identified 79 differentially expressed miRNAs in the FF group compared with the PF group; 53 were upregulated and 26 were downregulated (Figure S2b). The volcano map (a) and hierarchical clustering heat map (b) were constructed to illustrate the distribution of the differentially expressed miRNAs. Some of the differentially expressed miRNAs are marked on the volcano map. Several members of the let-7 miRNA family (let-7a-3p, let-7b-3p, let-7b-5p, let-7f-5p, and let-7g-3p) were more highly expressed in the FF group, whereas miR-675-3p, miR-675-5p, and miR-16-1-3p were expressed at significantly lower levels (Table S3).
Figure 2. Differentially expressed transcripts between preterm and full-term neonates. (a) Volcano map of all miRNAs in the preterm and full-term groups. (b) Hierarchical clustering heat map of 79 differentially expressed miRNAs. (c, d) Differential expression profiles of known mRNA and lncRNA in the FF-vs-PF comparison.
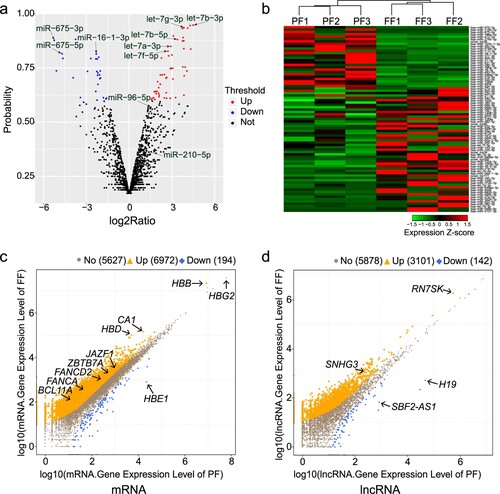
After mRNA and lncRNA sequencing, a total of 114–164 million clean reads were generated per sample. The principal component analysis was able to distinguish the samples in FF group from the PF group (Figure S2c). We found 7,166 differentially expressed mRNAs (6,549 known mRNAs and 617 novel mRNAs) and 3,243 differentially expressed lncRNAs (3,009 known lncRNAs and 234 novel lncRNAs) (Figure S2d). Volcano maps illustrated the distribution of the differentially expressed mRNAs and lncRNAs (c, d).
Among the differentially expressed transcripts, HBB (encoding β-globin) expression was 2.78-fold higher, HBD (encoding δ-globin) expression was 21.52-fold higher, and HBG2 (encoding Gγ-globin) expression was 1.56-fold lower in the FF group than in the PF group (Table S4). Our results, which are consistent with the gradual replacement of γ-globin chains by adult β- and δ-globin chains during the switch from fetal-to-adult hemoglobin, confirmed the selection of appropriate samples for study. Compared with the PF group, the mRNA expression levels of transcription factors BCL11A, ZBTB7A, KLF1, and SOX6, which are known to be involved in γ-globin inhibition, were 11.26-, 2.75-, 1.43-, and 1.19-fold higher in the FF group, respectively. The mRNA expression level of LIN28B, which is associated with high HbF levels [Citation27], was 5.83-fold lower in the FF group. In addition, we found that H19 was expressed at much lower levels (85.28-fold), whereas the expression of RN7SK and SNHG3 was higher in the FF group (Table S5).
3.3. Comparative analysis with published datasets revealed genes involved in globin switching
We compared our transcriptome data with the transcriptome datasets mentioned above [Citation7,Citation8,Citation21]. These four datasets were comparisons of the transcriptomic differences of erythroblasts cultured in vitro derived from fetal livers and adult peripheral blood or bone marrow. Although the samples were from different sources, we found some overlap between these datasets (, Table S6). For miRNA, we found that the let-7 family members were upregulated in both miRNA datasets, and that miR-675 was downregulated (a, b). For mRNA, the adult globin genes (HBB and HBD) and transcription factor BCL11A were upregulated, whereas embryonic globin genes (HBE1 and HBZ) were downregulated in the four mRNA datasets. In addition, LIN28B, IFG2BP1, and IGF2BP3 were downregulated in three out of the four mRNA datasets (c, d).
Figure 3. Comparative analysis of our sequencing data and published datasets. Warm colors (oranges/yellows) represent upregulation; cool colors (blues/greens) represent downregulation.
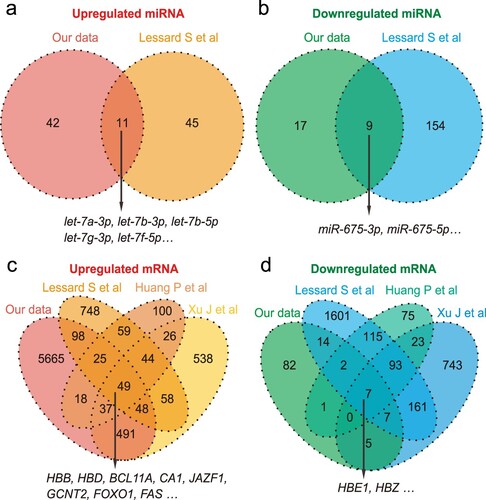
In addition to the above genes, we observed that CA1, JAZF1, GCNT2, FOXO1, FAS were all upregulated in the four mRNA datasets, suggesting that these genes may be involved in globin switching (c). CA1 and JAZF1 were then detected using RT-qPCR.
3.4. GO and KEGG enrichment analysis of differentially expressed mRNAs and target genes of the differentially expressed miRNAs and lncRNAs
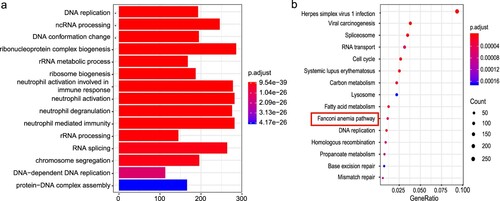
GO enrichment analysis of the known differentially expressed mRNAs revealed 967 terms related to biological processes (a), including DNA replication, DNA conformation changes, and RNA splicing. The KEGG pathway enrichment analysis revealed that the differentially expressed mRNAs were enriched in 57 pathways, including spliceosome, RNA transport, cell cycle, systemic lupus erythematosus, Fanconi anemia pathway, DNA replication, and other critical regulatory processes (b). We also performed GO and KEGG enrichment analysis of the target genes of the differentially expressed miRNAs and lncRNAs, and identified enrichment in DNA conformation changes, RNA splicing, DNA replication, RNA transport, histone modification, covalent chromatin modification, negative regulation of protein phosphorylation, protein methylation, stem cell differentiation, Wnt signaling pathway, spliceosome, ubiquitin mediated proteolysis, the mRNA surveillance pathway, and chronic myeloid leukemia (Figure S3a–d). These pathways, or genes in the pathways, may be related to globin switching.
Figure 4. GO and KEGG enrichment analysis of differentially expressed mRNA. (a) GO enrichment analysis. The X-axis represents the number of genes. (b) KEGG enrichment analysis.
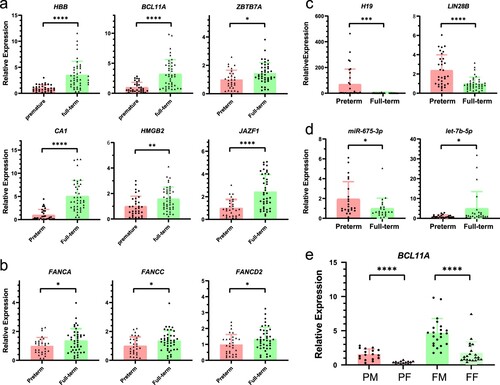
3.5. Validation of differentially expressed genes by RT-qPCR
After excluding three samples carrying thalassemia mutations, we performed RT-qPCR analysis on the NRBCs isolated from 75 umbilical cord blood samples to verify the differential expression of 14 mRNAs and lncRNAs (). Among the 17 genes selected for RT-qPCR, the results of 13 genes were consistent with the transcriptome sequencing results. Compared with the preterm group, the full-term group had higher mRNA expression levels of HBB, BCL11A, ZBTB7A, CA1, HMGB2, JAZF1 (3.52-, 3.24-, 1.45-, 5.07-, 1.59-, and 2.45-fold, respectively) (a). The expression levels of Fanconi anemia-related genes, such as FANCA, FANCC, and FANCD2, was 1.36-, 1.35-, and 1.35-fold higher in the full-term group (b). The expression levels of H19, LIN28B, and miR-675-3p were 69.98-, 2.38-, and 1.95-fold lower in the full-term group, whereas let-7b-5p was 4.98-fold higher in the full-term group (c, d). The results were consistent with those of the RNA-seq. We observed no significant differences in the expression of DANCR, SIRT6, and miR-675-5p, but FANCF was lower in the full-term group (Figure S3e, f). In addition, we found that BCL11A expression significantly differed based on biological sex. The NRBCs from preterm male neonates had 4.25-fold higher expression than that from PF neonates, and full-term male neonates had 2.64-fold higher expression than FF neonates (e).
Figure 5. RT-qPCR-based detection of mRNA and lncRNA expression. (a) The expression levels of six upregulated genes in the full-term group. (b) The expression of three Fanconi anemia pathway-related genes. (c) The expression of two downregulated genes. (d) The expression of two miRNAs. (e)The expression of BCL11A based on sex segregation. PM: preterm male; PF: preterm female; FM: full-term male; FF: full-term female. The ordinate represents the fold change in relative quantity. Values shown are the mean ± SD (ns: P ≥ 0.05; *P < 0.05, **P < 0.01, ***P < 0.001; ****P < 0.0001).
3.6. Hub genes of differentially expressed transcription factors and H19-related lncRNA/miRNA/mRNA network
To identify the differentially expressed genes with transcriptional regulatory functions, we selected all 595 TFs from the differentially expressed mRNAs, and constructed a PPI network to illustrate the interactions among differentially expressed TFs in globin switching. We calculated the node degree of the PPI network to identify the top 30 hub genes, constructed a network, and visualized it using Cytoscape (a). In the hub gene network, ZBTB7A, MTA2, and GATAD2A have been reported to be related to globin transformation [Citation28], whereas the other TFs have not been reported. The network also contains proto-oncogenes, such as MYC, JUN, FOS, tumor-suppressor gene TP53, and the epigenetic regulator TET2.
Figure 6. Hub genes of differentially expressed transcription factors and the H19-related lncRNA/miRNA/mRNA network. (a) Hub genes. Red represents a high connection degree and yellow represents a low connection degree. (b) The H19-related network. Red represents lncRNAs, blue represent miRNAs, orange represent genes, and yellow represents globin genes. Dotted lines denote interactions.
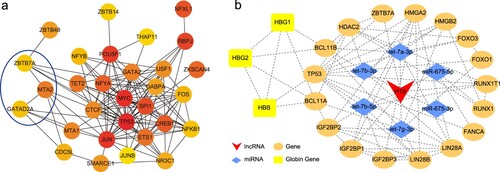
RNA-seq and RT-qPCR results showed that H19 was a significantly differentially expressed lncRNA in preterm and full-term NRBCs. Thus, we constructed the H19-related network, comprising one lncRNA, six miRNAs, and 20 protein-coding genes, among which there were three globin genes (b). As a lncRNA, H19 possesses sponge functions to absorb miRNA, such as let-7, and interact with mRNAs or proteins, such as ZBTB7A and IGF2BP1.
4. Discussion
At present, there are few studies on the transcriptome changes during the important switch from γ- to β-globin gene expression before and after birth, especially using fresh in vivo samples. In this study, we applied RNA-seq technology on NRBCs isolated from the umbilical cord blood of preterm and full-term neonates to perform a comprehensive analysis of the mRNA, lncRNA, and small RNA profiles, with the aim of guiding the study of fetal-to-adult hemoglobin switching. Because the expression of HBB is reduced or even absent in neonates with β-thalassemia, the γ- to β-globin switch cannot be clearly observed during fetal development. Therefore, in this study, we collected umbilical cord blood samples from healthy neonates excluding β-thalassemia to compare the transcriptome differences between preterm and full-term neonates.
From the RNA-seq analysis, it was found that the transcription factor gene BCL11A, known as an important γ-globin gene repressor, was highly expressed in full-term samples. Interestingly, significant sex-based differences of BCL11A were observed by RT-qPCR analysis in both preterm and full-term cord blood samples. The expression of BCL11A mRNA was significantly higher in male neonates than in female neonates. To our knowledge, this is the first report of sex-based differences in the expression of BCL11A. However, our previous study indicated that in the peripheral blood of adults, the reference range of HbF in male adults (<0.5%) was significantly lower than that in female adults (<1.1%) [Citation29]. Whether the difference between the HbF levels in male and female adults is related to the sex-based differential expression of BCL11A requires further exploration.
The KEGG pathway enrichment analyses revealed that the differentially expressed RNAs were linked to the Fanconi anemia pathway. Fanconi anemia is a rare autosomal recessive genetic disease characterized by congenital aplastic anemia, accompanied by multiple congenital malformations. Up to now, at least 22 pathogenic genes related to Fanconi anemia have been reported [Citation30]. We found significantly increased expression of the Fanconi anemia genes, including FANCA, FANCC, and FANCD2, in the FF group, in which the level of HbF is lower than in the PF group. Meanwhile, high levels of HbF are often observed in patients with Fanconi anemia, with an average increase of 11.3% compared with healthy individuals [Citation31], suggesting a direct or indirect relationship between the upregulation of Fanconi anemia genes and the downregulation of the γ-globin gene.
In recent years, a relationship between miRNAs and the fetal-to-adult hemoglobin switch has been discovered. Sankaran et al. [Citation32] demonstrated that the increased expression of miR-15a and mir-16-1 resulted in elevated HbF gene expression levels by downregulating the expression of MYB; our results indicated that miR-16-1-3p was downregulated, which could lead to the downregulation of γ-globin gene expression. Previous studies have demonstrated that the induction of the expression of miR-210 could promote the synthesis of γ-globin [Citation33]. In contrast, some miRNAs inhibit the expression of γ-globin genes; for example, genetic knockdown of endogenous miR-96 increased γ-globin expression by 20% [Citation34]. However, we found no significant differences between the expression of miR-210, miR-96-3p, or miR-96-5p in the FF and PF groups. This discrepancy may be due to the different research subjects evaluated in this study and others.
Our results demonstrated that the expression of lncRNA H19, one of the earliest reported lncRNAs, was significantly lower in the FF group compared with the PF group. lncRNA H19 has not been reported to be related to hemoglobin switching, but H19 interacts with γ-globin regulators, such as let-7 and LIN28B [Citation35]. Thus, the role of this lncRNA in γ-globin expression requires further investigation. The paternally imprinted and maternally expressed gene H19, one of the earliest reported lncRNAs, has an important role in embryonic development and growth control [Citation36]. The expression of H19 in long-term HSCs regulates embryonic HSC production and adult HSC quiescence [Citation37,Citation38]. H19 lncRNA was highly expressed in developing embryos, but became significantly downregulated in most tissues after birth [Citation35], with obvious spatiotemporal expression characteristics. Interestingly, this expression pattern is comparable with that of the β-globin gene cluster. The γ-globin genes HBG1 and HBG2 are expressed throughout most of fetal development, but their expression is gradually replaced by β-globin gene (HBB) expression after birth. Thus, the spatiotemporal expression of H19 may be related to the changes in β-globin cluster expression.
We speculate that H19 may be involved in the regulation of hemoglobin switching via various pathways/mechanisms (Figure S4). First, H19 could act as a competitive endogenous RNA sponge to absorb let-7 miRNAs, freeing let-7 to participate in the negative regulation of γ-globin via several mechanisms. During the differentiation of CD34+ cells, let-7 and LIN28B affect the expression of the γ-globin gene by upregulating and downregulating BCL11A, respectively [Citation27]. It has been reported that LIN28B is highly expressed in undifferentiated cells and that these proteins block the biogenesis of the let-7 miRNA family. As differentiation progresses, LIN28B expression is lost, leading to the production of mature let-7 miRNAs, which themselves negatively regulate LIN28B, thereby establishing a double-negative feedback loop [Citation39]. Later, it was confirmed that LIN28B suppressed BCL11A mRNA translation through a direct interaction, and that BCL11A was the major target of LIN28B-mediated HbF induction [Citation40]. HMGA2 is also a downstream target of the let-7 miRNA family, and overexpressed HMGA2 in CD34+ cells resulted in increased γ-globin expression at both the gene and protein level [Citation41]. H19 transcripts could also serve as precursors for miR-675, which is an important regulatory miRNA. The main downstream regulatory gene of miR-675 is RUNX1, which has a critical role in the process of hematopoiesis [Citation42]. Therefore, H19 may have an important influence on γ-globin expression through the regulation of the miR-675/RUNX1 axis. Collectively, these findings suggest that H19 may be an important regulator of γ- to β-globin gene switching, but the specific regulatory mechanism is yet to be determined.
Our study identified differentially expressed transcripts in NRBCs freshly isolated from the cord blood of preterm and full-term neonates using transcriptome sequencing. These differentially regulated transcripts, as well as their related genes and pathways, may participate in regulating the switch from γ- to β-globin gene expression. As such, they may provide important insight into globin switching mechanisms, thereby guiding subsequent studies and the development of therapies for β-hemoglobinopathies.
Authors’ contributions
SWH and YKJ conceived and designed the study; MZ and TTJ prepared experimental samples; YYH, XYT, and SJG contributed to bioinformatic analysis and data analysis; ZJZ and XDF conceived and supervised the study; YYH performed the RT-qPCR experiments and drafted the manuscript; SWH, YKJ, and XDF finalized the manuscript. All authors discussed and interpreted results, and all authors read and approved the final manuscript.
Supplemental Material
Download MS Excel (251.7 KB)Supplemental Material
Download MS Excel (574.9 KB)Supplemental Material
Download MS Excel (13.3 KB)Supplemental Material
Download MS Word (29.8 KB)Supplemental Material
Download MS Word (1.3 MB)Acknowledgements
The authors are grateful to all the donors for their interest and cooperation.
Disclosure statement
No potential conflict of interest was reported by the author(s).
Additional information
Funding
Related Research Data
References
- Park SH, Lee CM, Dever DP, et al. Highly efficient editing of the β-globin gene in patient-derived hematopoietic stem and progenitor cells to treat sickle cell disease. Nucleic Acids Res 2019;47:7955–7972.
- Orkin SH, Bauer DE. Emerging genetic therapy for Sickle cell disease. Annu Rev Med. 2019;70:257–271. doi:10.1146/annurev-med-041817-125507.
- Lohani N, Bhargava N, Munshi A, et al. Pharmacological and molecular approaches for the treatment of beta-hemoglobin disorders. J Cell Physiol. 2018;233:4563–4577. doi:10.1002/jcp.26292.
- Vinjamur DS, Bauer DE, Orkin SH. Recent progress in understanding and manipulating haemoglobin switching for the haemoglobinopathies. Br J Haematol. 2018;180:630–643. doi:10.1111/bjh.15038.
- Liu N, Hargreaves VV, Zhu Q, et al. Direct promoter repression by BCL11A controls the fetal to adult hemoglobin switch. Cell. 2018;173:430–442. e417. doi: 10.1016/j.cell.2018.03.016.
- Yang Y, Xu Z, He C, et al. Structural insights into the recognition of gamma-globin gene promoter by BCL11A. Cell Res. 2019;29:960–963. doi:10.1038/s41422-019-0221-0.
- Huang P, Keller CA, Giardine B, et al. Comparative analysis of three-dimensional chromosomal architecture identifies a novel fetal hemoglobin regulatory element. Genes Dev. 2017;31:1704–1713. doi:10.1101/gad.303461.117.
- Xu J, Shao Z, Glass K, et al. Combinatorial assembly of developmental stage-specific enhancers controls gene expression programs during human erythropoiesis. Dev Cell. 2012;23:796–811. doi:10.1016/j.devcel.2012.09.003.
- Morrison TA, Wilcox I, Luo HY, et al. A long noncoding RNA from the HBS1L-MYB intergenic region on chr6q23 regulates human fetal hemoglobin expression. Blood Cells Mol Dis. 2018;69:1–9. doi:10.1016/j.bcmd.2017.11.003.
- Ivaldi MS, Diaz LF, Chakalova L, et al. Fetal gamma-globin genes are regulated by the BGLT3 long noncoding RNA locus. Blood. 2018;132:1963–1973. doi:10.1182/blood-2018-07-862003.
- Langmead B, Trapnell C, Pop M, et al. Ultrafast and memory-efficient alignment of short DNA sequences to the human genome. Genome Biol 2009;10:R25.
- John B, Enright AJ, Aravin A, et al. Human MicroRNA targets. PLoS Biol 2004;2:e363.
- Agarwal V, Bell GW, Nam JW, et al. Predicting effective microRNA target sites in mammalian mRNAs. eLife. 2015;4:e05005.
- Tarazona S, García-Alcalde F, Dopazo J, et al. Differential expression in RNA-seq: a matter of depth. Genome Res 2011;21:2213–2223.
- Kim D, Langmead B, Salzberg SL. Hisat: a fast spliced aligner with low memory requirements. Nat Methods. 2015;12:357–360.
- Pertea M, Pertea GM, Antonescu CM, et al. Stringtie enables improved reconstruction of a transcriptome from RNA-seq reads. Nat Biotechnol 2015;33:290–295.
- Trapnell C, Williams BA, Pertea G, et al. Transcript assembly and quantification by RNA-Seq reveals unannotated transcripts and isoform switching during cell differentiation. Nat Biotechnol 2010;28:511–515.
- Wang L, Feng Z, Wang X, et al. Degseq: an R package for identifying differentially expressed genes from RNA-seq data. Bioinformatics (Oxford, England). 2010;26:136–138. doi:10.1093/bioinformatics/btp612.
- Ramírez F, Dündar F, Diehl S, et al. Deeptools: a flexible platform for exploring deep-sequencing data. Nucleic Acids Res. 2014;42:W187–W191. doi:10.1093/nar/gku365.
- Yu G, Wang LG, Han Y, et al. Clusterprofiler: an R package for comparing biological themes among gene clusters. Omics: A Journal of Integrative Biology. 2012;16:284–287.
- Lessard S, Beaudoin M, Orkin SH, et al. 14q32 and let-7 microRNAs regulate transcriptional networks in fetal and adult human erythroblasts. Hum Mol Genet. 2018;27:1411–1420. doi:10.1093/hmg/ddy051.
- Zhang HM, Chen H, Liu W, et al. Animaltfdb: a comprehensive animal transcription factor database. Nucleic Acids Res. 2012;40:D144–D149. doi:10.1093/nar/gkr965.
- Szklarczyk D, Gable AL, Nastou KC, et al. The STRING database in 2021: customizable protein-protein networks, and functional characterization of user-uploaded gene/measurement sets. Nucleic Acids Res. 2021;49:D605–d612. doi:10.1093/nar/gkaa1074.
- Shannon P, Markiel A, Ozier O, et al. Cytoscape: a software environment for integrated models of biomolecular interaction networks. Genome Res 2003;13:2498–2504.
- Li JH, Liu S, Zhou H, et al. Starbase v2.0: decoding miRNA-ceRNA, miRNA-ncRNA and protein-RNA interaction networks from large-scale CLIP-Seq data. Nucleic Acids Res. 2014;42:D92–D97. doi:10.1093/nar/gkt1248.
- Chen Y, Wang X. Mirdb: an online database for prediction of functional microRNA targets. Nucleic Acids Res. 2020;48:D127–d131. doi:10.1093/nar/gkz757.
- Lee YT, de Vasconcellos JF, Yuan J, et al. LIN28B-mediated expression of fetal hemoglobin and production of fetal-like erythrocytes from adult human erythroblasts ex vivo. Blood. 2013;122:1034–1041.
- Sher F, Hossain M, Seruggia D, et al. Rational targeting of a NuRD subcomplex guided by comprehensive in situ mutagenesis. Nat Genet. 2019;51:1149–1159. doi:10.1038/s41588-019-0453-4.
- Han WP, Huang L, Li YY, et al. Reference intervals for HbA2 and HbF and cut-off value of HbA2 for beta-thalassemia carrier screening in a Guizhou population of reproductive age. Clin Biochem. 2019;65:24–28. doi:10.1016/j.clinbiochem.2018.11.007.
- Jung M, Ramanagoudr-Bhojappa R, van Twest S, et al. Association of clinical severity with FANCB variant type in Fanconi anemia. Blood. 2020;135:1588–1602.
- Sousa R, Goncalves C, Guerra IC, et al. Increased red cell distribution width in Fanconi anemia: a novel marker of stress erythropoiesis. Orphanet J Rare Dis. 2016;11:102), doi:10.1186/s13023-016-0485-0.
- Sankaran VG, Menne TF, Šćepanović D, et al. MicroRNA-15a and -16-1 act via MYB to elevate fetal hemoglobin expression in human trisomy 13. Proc Natl Acad Sci U S A. 2011;108:1519–1524. doi:10.1073/pnas.1018384108.
- Bianchi N, Finotti A, Ferracin M, et al. Increase of microRNA-210, decrease of raptor gene expression and alteration of mammalian target of rapamycin regulated proteins following mithramycin treatment of human erythroid cells. PLoS One. 2015;10:e0121567.
- Azzouzi I, Moest H, Winkler J, et al. MicroRNA-96 directly inhibits gamma-globin expression in human erythropoiesis. PLoS One. 2011;6:e22838), doi:10.1371/journal.pone.0022838.
- Peng F, Li TT, Wang KL, et al. H19/let-7/LIN28 reciprocal negative regulatory circuit promotes breast cancer stem cell maintenance. Cell Death Dis. 2017;8:e2569), doi:10.1038/cddis.2016.438.
- Gabory A, Jammes H, Dandolo L. The H19 locus: role of an imprinted non-coding RNA in growth and development. Bioessays. 2010;32:473–480.
- Zhou J, Xu J, Zhang L, et al. Combined single-cell profiling of lncRNAs and functional screening reveals that H19 Is pivotal for embryonic hematopoietic stem cell development. Cell Stem Cell. 2019;24:285–298. e285. doi: 10.1016/j.stem.2018.11.023.
- Venkatraman A, He XC, Thorvaldsen JL, et al. Maternal imprinting at the H19-Igf2 locus maintains adult haematopoietic stem cell quiescence. Nature. 2013;500:345–349.
- Balzeau J, Menezes MR, Cao S, et al. The LIN28/let-7 pathway in cancer. Front Genet. 2017;8:31), doi:10.3389/fgene.2017.00031.
- Basak A, Munschauer M, Lareau CA, et al. Control of human hemoglobin switching by LIN28B-mediated regulation of BCL11A translation. Nat Genet. 2020;52:138–145. doi:10.1038/s41588-019-0568-7.
- de Vasconcellos JF, Lee YT, Byrnes C, et al. Hmga2 moderately increases fetal hemoglobin expression in human adult erythroblasts. PLoS One. 2016;11:e0166928.
- Ran D, Shia WJ, Lo MC, et al. Runx1a enhances hematopoietic lineage commitment from human embryonic stem cells and inducible pluripotent stem cells. Blood. 2013;121:2882–2890.