
ABSTRACT
Objectives
Thrombin generation assays and activated partial thromboplastin time (aPTT)-based clot waveform analysis (CWA), are some examples of global coagulation assays. Each modality evaluates different aspects of the clot forming process to globally define haemostasis with exclusive measurement parameters. Data on CWA are emerging, but its performance against other haemostatic assays is yet to be ascertained. This study evaluates the correlation between aPTT-based CWA and CAT parameters across a range of INR in warfarin-treated patients.
Patients/Methods
A prospective study consisting of patients on warfarin anticoagulation with varying INR levels. CWA and CAT were performed for the study subjects.
Results
54 samples were included covering an INR range from 1.33–6.89, with a mean of 4.31 +/- 1.13. For CAT parameters, endogenous thrombin potential (ETP) and peak thrombin were assessed. Both unadjusted and adjusted (adjusted for final plateau transmittance) aPTT-based CWA were evaluated for parameters min1 (maximum velocity), min2 (maximum acceleration) and max2 (maximum deceleration). Peak thrombin showed significant correlation with all CWA parameters (min1: r = 0.435, P<0.001; min2: r = 0.485, P<0.001; max2: r = 0.578, P<0.001; adjusted min1: r = 0.734, P<0.001, adjusted min2: r = 0.693, P<0.001; adjusted max2: r = 0.751, P<0.001). ETP correlated significantly with all CWA parameters except unadjusted min1 (min1: r = 0.235, P = 0.087; min2: r = 0.326, P = 0.016; max2: r = 0.437, P<0.001; adjusted min1: r = 0.610, P<0.001, adjusted min2: r = 0.563, P<0.001; adjusted max2: r = 0.642, P<0.001).
Conclusion
We demonstrated a modest correlation between CAT and CWA parameters. Adjusted CWA improved this correlation. These findings provide additional understanding of CWA and it’s role in the evaluation of global haemostatic function.
Introduction
Global coagulation assays (GCA) are laboratory platforms that are touted to evaluate the haemostatic process in a comprehensive manner in contrast to the conventional clotting screen. Such conventional clotting screens like prothrombin time (PT), activated partial thromboplastin time (aPTT) and fibrinogen, are highly accessible for routine clinical care but potentially misrepresent the actual state of haemostasis in more complex situations. Thromboelastography, thrombin generation assays (TGA) and aPTT-based clot waveform analysis (CWA) are some of the best-described GCAs with various clinical and research applications. Each modality interrogates different aspects of the clot forming process but aim to globally define haemostasis with exclusive measurement parameters. The conceptual basis for such testing modalities has been around for decades. However, it is only in recent times that their accessibility has been expanded via automation and software improvements [Citation1]. This opens up new avenues to explore their clinical utility. In this respect, a aPTT-based CWA offers the best possibility of widespread accessibility.
aPTT-CWA is an extended study of the usual aPTT test that utilizes pre-existing test protocol and machinery. Many automated analysers now use light transmittance or absorbance changes to measure clotting times, and these optical changes over time as the clot forms can be captured and presented as a clot waveform curve. Subsequently, the clot waveform curve can be further analysed, providing additional information about the coagulation process. () [Citation2] aPTT-CWA has clinical applications in the assessment of coagulation status in various haemostatic disorders such as haemophilia and disseminated intravascular coagulation [Citation3,Citation4]. However, it is the least studied among the various GCA platforms.
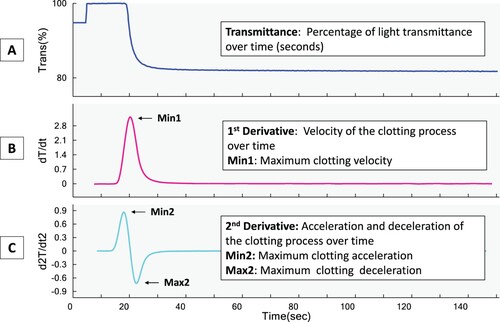
Figure 1. aPTT-clot waveform analysis transmittance curve (A) and the first (B) and second derivatives (C). Trans%: Percentage of transmittance, dT/dt: the derivative of transmittance taken with respect to time, d2T/dt2: the second derivative calculated from dT/dt with respect to time Min 1: Maximum clotting velocity, Min 2: Maximum clotting acceleration, Max2: Maximum clotting deceleration
Studies comparing the different GCA platforms are also limited. There are some correlation studies between thromboelastography and TGA reported [Citation5]. The use of samples from patients on warfarin as the surrogate population to demonstrate correlation across a range of coagulation status has been studies before as well [Citation6]. However, the correlation of CWA against other platforms in the assessment of haemostasis in-vitro has not been evaluated. In this study, we compared measurements of CWA parameters with TGA using the Calibrated Automated Thrombogram (CAT), and this paper reports our findings.
Materials and methods
This is a prospective study carried out at Singapore General Hospital, a tertiary academic centre in Singapore, over six months from 01 May 2017 and 31 October 2017. The research related to human use has complied with all the relevant national regulations, institutional policies and in accordance with the tenets of the Helsinki Declaration and has been approved by the Singapore General Hospital institutional review board (Protocol Reference: 2017/2073). Informed consent was obtained for blood investigations and retrieval of relevant clinical data. The study group consisted of patients on warfarin anticoagulation.
Blood sampling
Blood samples from subjects were collected into vacuum tubes (Becton Dickinson, Franklin Lakes NJ, USA) containing 0.109M sodium citrate as an anticoagulant at a proportion of 9:1 (blood: anticoagulant) using a 21G needle without tubing. Whole blood samples were centrifuged at 1500g for 15 min (Andreas Hettich GmbH & Co., Tuttlingen, Germany) to obtain platelet-poor plasma (PPP) for PT and aPTT analysis which was verified to a platelet count of less than 10 x109/L. The PPP was aliquoted and further centrifuged for 10 min at 10,000g to obtain the platelet-free plasma used for the thrombin generation analysis. The plasma was quick-frozen and stored at −80°C until tested in batches no later than 6 months after blood collection. Samples were analysed immediately after thawing for not more than 10 min in a 37°C water bath.
Coagulation assays – PT/INR and aPTT
PT and aPTT were analysed using the Sysmex CS2100i automated coagulation analyser (Sysmex Corporation, Kobe, Japan). The International Normalized Ration (INR) was automatically calculated by the analyser using the lab-determined geometric mean with the lot-specific international sensitivity index (ISI) for the Dade Innovin reagent (Siemens Healthcare, Marburg, Germany) used for PT. aPTT is analysed using the Dade Actin FSL (Siemens Healthcare, Marburg, Germany) reagent.
Thrombin generation assay – calibrated automated thrombogram
Thrombin generation was analysed using the Calibrated Automated Thrombogram® (CAT, Diagnostica Stago, S.A.S, Paris, France) system following the manufacturer's published protocol [Citation7]. Briefly, a trigger solution consisting of a mixture of 4 μM phospholipid and 5 pM tissue factor was added to the plasma, and each sample was run in triplicate. CAT parameters generated are (1) lag time (min), (2) peak height (nM), (3) endogenous thrombin potential (ETP) (nM/min), (4) time to peak (min): time needed to achieve the peak height [Citation7].
Collection of CWA data
PT and aPTT-based CWA parameters were retrieved from the in-built algorithm of the CS2100i coagulometer. The unadjusted CWA data were collected: Min1 (maximum velocity), Min2 (maximum acceleration) and Max2 (maximum deceleration). The adjusted CWA data were generated based on the final plateau transmittance and was obtained from the analysis files by the Sysmex software team. The minimum transmittance is affected by fibrin clot density and fibrinogen levels, and hence the adjusted CWA data eliminate the influence of these factors [Citation8].
Statistical analysis
Statistical analysis was performed using SPSS version 20.0 software (SPSS Inc., Chicago, IL, USA). Normality testing was performed using Kolmogorov–Smirnov and data are presented as mean +/- SD as they were normally distributed. Pearson's correlation (r) test was used for correlation analysis. To account for the effect of multiple comparisons of the three CWA parameters (min1, min2 and max2), Bonferroni correction was performed with P values < 0.017 (0.05 / 3) considered statistically significant.
Results
54 outpatient subjects on warfarin were included in this study covering a wide INR range from 1.33–6.89 with a mean INR (± standard deviation) of 4.31 (± 1.13). The mean age of patients was 61.5 (± 12.7) years of age and 63.0% of them were female. Indications for warfarin anticoagulation were venous thromboembolism (n = 24, 44.4%), atrial fibrillation (n = 19, 35.2%), mechanical heart valve (n = 6, 11.1%), and antiphospholipid syndrome (n = 5, 9.3%). Laboratory parameters of the patients are shown in .
Table 1. Laboratory results, PT, aPTT and its associated CWA parameters and thrombin generation results of 54 study subjects on warfarin.
Correlation Data of INR, against CAT and aPTT-CWA parameters
Correlation studies were done between INR and CAT as well as CWA parameters, respectively. Consistent with published data, there was statistically significant weak to moderate negative correlation between INR and CAT parameters (ETP: r = −0.317, p = 0.020; Peak thrombin: r = −0.348, p = 0.010) [Citation6,Citation9]. With respect to aPTT-based CWA parameters, INR showed statistically significant, albeit moderate correlation to the adjusted CWA parameters but not the unadjusted data (min1: r = −0.140, P = 0.313; min2: r = −0.213, P = 0.123; max2: r = −0.293, P = 0.031; adjusted min1: r = −0.379, P = 0.005, adjusted min2: r = −0.364, P = 0.007, adjusted max2: r = −0.407, P = 0.002).
Correlation Data between CAT parameters and aPTT-CWA
The correlation of CAT parameters with aPTT-based CWA parameters was evaluated to study the relationship between the two types of GCAs. The results are reflected in . To summarize, both ETP and peak thrombin of CAT showed modest, statistically significant correlations with both unadjusted and adjusted CWA parameters, except for the correlation between ETP and unadjusted min1. The strongest correlation with aPTT-based CWA parameters was observed for peak thrombin parameters. Adjusted aPTT-based CWA parameters demonstrated improved correlation. Amongst all the CWA parameters, adjusted max2 had the strongest correlation with ETP and peak thrombin, respectively. Consistently, the association can also be observed by visualizing the changes in clot transmission curves of both the TGA and CWA profiles at different INR levels, as demonstrated in .
Figure 2. A comparison of thrombin generation curves measured by the CAT and aPTT-CWA transmittance curves of two different patients with two extremes of INR ranges of 1.94 and 4.50 r, respectively. (A) and (C) show the thrombin generation curves while (B) and (D) show the 1st and 2nd derivatives curves of the aPTT-based clot waveform transmittance curves. CAT: Calibrated automated thrombogram; CWA: Clot waveform analysis; ETP: Endogenous thrombin potential.
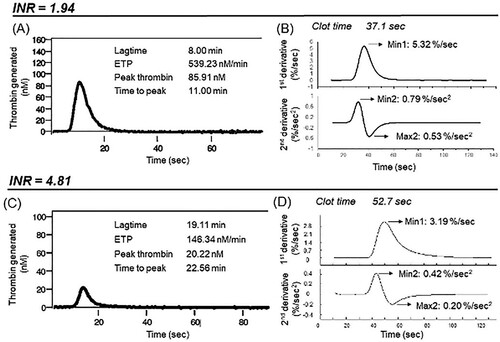
Table 2. Correlation between aPTT-CWA and thrombin generation parameters in 54 patients on warfarin anticoagulation*.
Correlation data with PT-based CWA
PT-based CWA was also evaluated against CAT and INR, and the data are presented in . PT-based parameters, in general, demonstrated no to weak correlations to peak thrombin and ETP. There is also a limited correlation of PT-based CWA to INR with an overall poor correlation with limited statistical significance. On the other hand, PT-based CWA parameters showed statistically significant weak to moderate correlation with aPTT-based CWA.
Table 3. Correlation between unadjusted PT-CWA and INR and thrombin generation parameters respectively in 54 patients on warfarin anticoagulation*/**.
Discussion
APTT-based CWA is more established than PT-based CWA and was the main focus of our study. Using samples from patients on anticoagulation with warfarin across a wide range of INR to depict varying degrees of haemostatic dysfunction, we demonstrated significant correlations between CAT and aPTT-based CWA parameters in this study [Citation5,Citation8]. The strongest correlations observed were between adjusted aPTT-based CWA parameters and peak thrombin parameters. Consistently, the association can also be observed by visualizing the changes in clot transmission curves of both the TGA and CWA profiles at different INR levels, as demonstrated in .
Mathematical models have suggested that the first derivative curve derived from the original aPTT clot waveform describes thrombin activity. Thus, CWA parameters evaluated in this study may define changes in thrombin generation patterns with min1 corresponding to the maximum thrombin generation rate. The second derivatives of min2 and max2 will correspond respectively to the highest and the lowest rate of change of the velocity of thrombin generation [Citation3]. These CWA parameters are, however, not equivalent to the peak thrombin and ETP of CAT. Therefore, they are not expected to correlate perfectly with each other. Nonetheless, their positive correlation validates their mutual standing as global assays.
The correlation with CAT parameters was further strengthened when adjusted CWA parameters were utilized. This improvement in correlation is predictable as the adjustment for the final plateau transmittance essentially eliminates the influence of the fibrin clot density and fibrinogen concentration, thus making the adjusted CWA parameters an exclusive measurement of the effect of thrombin generation [Citation3,Citation8]. Also, the significant negative correlation between INR and CAT parameters is consistent with published data and lends weight to the reliability of our data and its interpretation [Citation6,Citation9].
Apart from our present study, there is currently minimal data available comparing CWA and other GCAs. However, Matsumoto et al. demonstrated a strong correlation, with Pearson's r approaching 0.9, between CWA and CAT, in response to the addition of single factor FVIII or FIX to the respective factor deficient plasmas in vitro [Citation10]. With a few notable differences in study methods, we showed a more modest correlation in the present study. A few factors can explain these differences. Firstly, warfarin interacts with multiple clotting factors through a more complex pathway to influence the eventual clot formation than just a single factor deficiency. Secondly, our CWA was performed on Sysmex analysers rather than the MDA analysers (Organon Teknika, UK), which have since been phased out. Thirdly, Matsumoto et al. performed an in-house modification of the commercially available aPTT-SLA reagent used in their study whilst we employed the Dade Actin FSL commercial reagent in its original form [Citation10]. Significantly, we conducted this study using unmanipulated patient samples.
We also evaluated PT-based CWA, a less studied and recognized variation of CWA. Of interest, in comparison to aPTT-based CWA, PT-based parameters demonstrated an overall poor correlation to CAT parameters and INR. As tissue factors trigger both PT and CAT, one would expect PT-based CWA to share more similarity with CAT. The notable difference is the concentration of tissue factor used between the two assays. Our CAT assay was triggered by a significantly lower amount of tissue factor (5 pM) compared to the average of 1.2nM used in our PT assay [Citation11]. Therefore, CAT might be more sensitive in detecting changes in thrombin generation process [Citation12]. Click or tap here to enter text. We also noted that the amplitude changes and the clot time in the original PT-based transmittance curve are strikingly smaller and shorter, respectively, compared to aPTT-based curve. These differences would understandably affect all the CWA parameters as these parameters are derived from the first and second derivatives of the transmittance curve and are measurements of the rate of transmittance change over time [Citation13]. In addition, we opine that PT-based CWA in its current form is not adequately sensitive to detect changes in the clot formation process, and further optimization of the analysis is required before it can be recognized as a form of global haemostatic test.
Our study has several limitations. Although we analysed data over a wide INR range with highly statistically significant results, our sample size was relatively small and without a comparator healthy control group. We also did not account for the potential influence of other underlying medical conditions and did not evaluate the contribution of protein C and protein S. In addition, as currently there is no standardized platforms and reagents for both thrombin generation and CWA assays and we only evaluated the correlation between TGA and CWA parameters on a single platform and reagent type for the respective assays in warfarin-treated patients [Citation14]. Hence, these findings cannot be generalized to other analysers, reagents or other haemostatic conditions. Finally, we have used samples from patients on warfarin as a surrogate for a range of coagulopathy. This reflects deficiencies of only the vitamin K dependent coagulation factors and may not be generalizable to combinations of other clotting factor deficiencies [Citation15].
In conclusion, this study has demonstrated the congruence of aPTT-based CWA with CAT in their role as global coagulation assays using warfarin-treated patient samples as the surrogate test bed. This finding may enhance the understanding and interpretation of coagulation defects measured independently on these two platforms in clinical and research settings.
Author contributions
All authors have accepted responsibility for the entire content of this manuscript and approved its submission. MA Cheong and CW Tan analysed conceived the project, analysed the data and wrote the paper. WH Wong contributed analysis tools and performed the analysis. MC Kong, E See HY Shu, SK Koh collected the data. LH Lee and HJ Ng reviewed the manuscript.
Ethical approval
The study was approved by the Singapore General Hospital institutional review board (Protocol Reference: 2017/2073).
Informed consent
Informed consent was obtained from all individuals included in this study.
Disclosure statement
No potential conflict of interest was reported by the author(s).
References
- Lancé MD. A general review of major global coagulation assays: thrombelastography, thrombin generation test and clot waveform analysis. Thromb J. 2015;13(1).https://doi.org/10.1186/1477-9560-13-1.
- Shima M, Thachil J, Nair SC, et al. Scientific. towards standardization of clot waveform analysis and recommendations for its clinical applications. J Thromb Haemost. 2013;11(7):1417–1420.
- Siegemund T, Scholz U, Schobess R, et al. Clot waveform analysis in patients with haemophilia A. Hamostaseologie. 2014;34:S48–S62.
- Toh CH, Giles AR. Waveform analysis of clotting test optical profiles in the diagnosis and management of disseminated intravascular coagulation (DIC). Clin Lab Haematol. 2002;24(6):321–327.
- Rivard GE, Brummel-Ziedins KE, Mann KG, et al. Evaluation of the profile of thrombin generation during the process of whole blood clotting as assessed by thrombelastography. J Thromb Haemost. 2005 Sep;3(9):2039–2043. Available from: https://onlinelibrary.wiley.com/doi/10.1111/j.1538-7836.2005.01513.x.
- Schmidt DE, Chaireti R, Bruzelius M, et al. Correlation of thromboelastography and thrombin generation assays in warfarin-treated patients. Thromb Res. 2019;178(February):34–40.
- Hemker HC, Giesen P, Aldieri R, et al. The Calibrated Automated Thrombogram (CAT): a universal routine test for hyper- and hypocoagulability. Pathophysiol Haemost Thromb. 2002;32:249–253.
- Nogami K, Matsumoto T, Tabuchi Y, et al. Modified clot waveform analysis to measure plasma coagulation potential in the presence of the anti-factor IXa/factor X bispecific antibody emicizumab. J Thromb Haemostasis. 2018;16(6):1078–1088.
- Gatt A, Van Veen JJ, Bowyer A, et al. Wide variation in thrombin generation in patients with atrial fibrillation and therapeutic International Normalized Ratio is not due to inflammation. Br J Haematol. 2008;142(6):946–952.
- Matsumoto T, Shima M, Takeyama M, et al. The measurement of low levels of factor VIII or factor IX in hemophilia A and hemophilia B plasma by clot waveform analysis and thrombin generation assay. J Thromb Haemostasis. 2006;4(2):377–384.
- Smith SA, Comp PC, Morrissey JH. Phospholipid composition controls thromboplastin sensitivity to individual clotting factors. J Thromb Haemostasis. 2006;4(4):820–827.
- Kintigh J, Monagle P, Ignjatovic V. A review of commercially available thrombin generation assays. Res Pract Thromb Haemost. 2018;2(1):42–48.
- Braun PJ, Givens TB, Stead AG, et al. Properties of optical data from activated partial thromboplastin time and prothrombin time assays. Thromb Haemostasis. 1997;78(3):1079–1087.
- Machlus K, Colby E, Wu J, et al. Effects of tissue factor, thrombomodulin and elevated clotting factor levels on thrombin generation in the calibrated automated thrombogram. Thromb Haemost. 2009 Nov 27;102(11):936–944. Available from: http://www.thieme-connect.de/DOI/DOI?10.1160/TH09-03-0180.
- Watala C, Golanski J, Kardas P. Multivariate relationships between international normalized ratio and vitamin K-dependent coagulation-derived parameters in normal healthy donors and oral anticoagulant therapy patients. Thromb J. 2003;1.