
ABSTRACT
Objectives: Genomic instability has several implications for acute myeloid leukemia (AML) prognosis. This article aims to construct a somatic mutation-associated risk index (SMRI) of genomic instability for AML to predict prognosis and explore the potential determinants of AML prognosis.
Methods: We obtained differentially expressed lncRNAs from genomic instability subtypes and selected six lncRNAs to construct the SMRI through multivariate Cox regression analysis. The median SMRI classified patients into high and low SMRI groups. Kaplan–Meier survival analysis was used to clarify the prognostic differences of SMRI subtypes. Receiver operating characteristic curve analysis was performed to elucidate the value of SMRI as a prognostic indicator. Gene set variation analysis, tumor mutation burden (TMB) analysis, immune infiltration, and immune checkpoint expression analysis were performed to investigate possible causes for the differences in prognosis of SMRI subtypes.
Results: The high SMRI group exhibited a poor prognosis, which was characterized by elevated levels of TMB, mutation counts (TP53, NPM1, DNMT3A, and FLT3-TKD), CD8+ T cell infiltration, and immune checkpoint (PD-1, PD-L2, CTLA4, LAG3) expression. The SMRI was still associated with prognosis, even after adjustment for age, sex, cytogenetic risk, DNMT3A status, FLT3 status, and NPM1 status. Gene set variation analysis showed that AML with FLT3-ITD mutation, CEBPA mutation, and LSCs (leukemia stem cells) were enriched in the high SMRI group.
Conclusion: Our research suggests that the SMRI derived from genomic instability subtypes is a useful biomarker for predicting prognosis and may be beneficial for improving the clinical outcome of patients with AML.
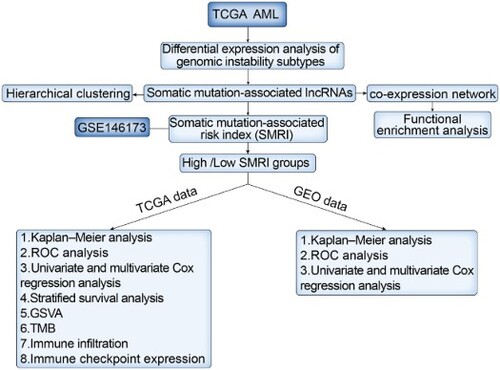
GRAPHICAL ABSTRACT
1. Introduction
Acute myeloid leukemia (AML) is the most common leukemia in adults and the most deadly disease of all leukemias [Citation1]. In recent years, the understanding of the pathobiology and the genetic basis of AML has improved, leading to tremendous progress in the treatment of acute myeloid leukemia [Citation2]. However, primary and secondary drug resistance is still a problem. AML is a heterogeneous disease, which contained a variety of cytogenetic and molecular abnormalities that can affect clinical outcomes and may offer potential targets.
Genomic instability refers to high-frequency mutations within the genome of a cell lineage and is a common phenomenon in almost all cancers, including AML [Citation3,Citation4]. Large-scale genomic analyses have identified many types of genetic aberrations in AML patients [Citation5]. Importantly, the value of genomic instability in cancer prognosis is also prominent [Citation6Citation–Citation8]. Some studies showed that compared with genome instability, genome stability had a significantly higher survival rate [Citation9,Citation10]. Studies have found that long non-coding RNA (lncRNA), one type of endogenous RNA longer than 200nt, is associated with recurrent mutations in AML, thereby predicting treatment response and survival rates [Citation11,Citation12]. Dysregulated expression of lncRNA may have an impact on cell differentiation, proliferation, and tumor progression [Citation13Citation–Citation15]. Some research had suggested that lncRNA GUARDIN [Citation16] and NORAD [Citation17] are essential for maintaining genome stability. However, the function of lncRNA is still largely unknown, especially in genome instability [Citation18,Citation19]. Lately, Pu et al. proposed that there are multiple links between genomic instability and antitumor immunity, and presented the point of predicting immune checkpoint inhibition (ICI) therapy response through the status of genomic stress [Citation20]. ICI therapy is to slow down the recurrence of tumors by causing specific immune responses to inhibit and kill tumor cells [Citation21]. However, few patients benefit from ICI therapy.
In this analysis, we hypothesized that SMRI has a positive effect on predicting AML survival outcomes and ICI therapy response. For this purpose, lncRNA expression profiles, clinical data, and somatic mutation profiles from The Cancer Genome Atlas (TCGA), University of California Santa Cruz (UCSC) Xena, and Gene Expression Omnibus (GEO) databases were subjected to multiple bioinformatics analyses. In addition, given that the comprehensive prognostic analysis of multiple lncRNAs is more significant than the predictive value of a single lncRNA, we chose to construct an integrative risk index model (also denoted as SMRI) consisting of multiple lncRNAs associated with somatic mutations. Our goal is to use the SMRI for risk stratification to offer references for improving the prognosis of patients with AML.
2. Materials and methods
2.1. Data acquisition and preprocessing
In this analysis, 151 AML samples were acquired from the TCGA database (https://tcga-data.nci.nih.gov/tcga/), and 246 AML samples were obtained from GSE146173 in the GEO database (https://www.ncbi.nlm.nih.gov/geo/). Samples in which the key clinical information (survival time, survival status) was incomplete were excluded. Information about mutation profiles of TCGA AML samples was taken from UCSC Xena (https://xenabrowser.net/). All the above data are available from the internet without any charge.
2.2. Selection of lncRNAs related to genomic instability in TCGA dataset
Before data processing, lncRNAs with median absolute deviation (MAD) < 0.5 were excluded from the analysis. The somatic mutation counts of samples were obtained from UCSC Xena, and samples with missing transcriptome data were excluded. The included 138 samples were sorted in ascending order according to the mutation counts. The top 25% of the samples were classified as genomic stable (GS) group, and the last 25% were classified as genomic unstable (GU) group. The differential expression analysis based on the 'limma' package was performed between GS and GU groups to identify somatic mutation-associated lncRNAs (SMlncs, |log2 FC (fold-change)| > 0.6 and false discovery rate adjusted p < 0.05).
2.3. Identification of AML subclasses and functional enrichment analysis
The 'hclust' function was used to perform hierarchical clustering of samples based on 254 SMlncs to identify TCGA AML subclasses. We performed Spearman correlation analysis to identify the correlation between lncRNAs and protein-coding genes, and the top ten components were regarded as co-expressed lncRNA-related partners. To identify the biological functions involved in these 254 SMlncs, we conducted functional enrichment analysis of lncRNA-related protein-coding genes to recognize enriched Gene Ontology (GO) terms. The R package 'clusterProfiler' was used for GO enrichment analysis.
2.4. Construction and validation of SMRI
The optimal SMlncs were screened by Kaplan–Meier analysis and univariate Cox proportional hazards regression analysis based on TCGA dataset; besides, the least absolute shrinkage and selection operator (LASSO) Cox regression analysis was introduced to further screen the pivotal candidate SMlncs. Briefly, LASSO is considered to be a method of estimation in linear models which imposes penalties on parameter estimates to prevent the model from overfitting [Citation22]. These penalties serve the function of reducing the parameter estimates to zero to eliminate overfitting between genes. After that, the optimization and adjustment of the LASSO penalty terms are carried out through ten-fold cross-validation. In this work, we regarded 142 TCGA samples harboring survival time and survival status as the training cohort. Due to the complete clinical information of TCGA, we also randomly divided the TCGA dataset into cohorts A and B in the ratio of 5:5. The 246 GEO samples served as an external verification cohort to test the robustness of SMRI in risk stratification. The clinical characteristics of TCGA and GEO samples were shown in . Before constructing SMRI, we implemented the 'ComBat' function to eliminate potential batch effects of data on different platforms. SMlncs for constructing SMRI were then selected from the multivariate Cox proportional hazard regression analysis based on the bidirectional selection of the Akaike Information Criterion (AIC). The expression values and Cox regression coefficients of SMlncs were used to calculate the SMRI of each sample. The median SMRI of the training cohort was used to distinguish high and low SMRI groups of four cohorts. The prognostic difference between high SMRI and low SMRI was identified by Kaplan–Meier survival analysis. Before performing other analyses, we assigned patients to different risk groups (favorable, intermediate, or poor) based on the 2017 European LeukemiaNet (ELN) risk stratification determined by cytogenetic abnormalities [Citation23]. ROC curves were yielded for each prognostic factor to acquire the area under the ROC curve (AUC) and to determine whether SMRI was more acceptable than other clinical variables (age, sex, cytogenetic risk, and 2017 ELN risk factors). Univariate and multivariate analyses were used to explore the independence of SMRI from other clinical variables. We distinguished subgroups by age, sex, NPM1 mutation status, DNMT3A mutation status, FLT3 internal tandem duplication (ITD) mutation status, TP53 mutation status, and cytogenetic risk and tested the differences in SMRI in different clinical subgroups.
Table 1. Clinical characteristics of AML patients in TCGA and GEO cohorts.
2.5. Characteristics and gene set variation analysis (GSVA) of risk subgroups of the training cohort
We collected the main clinical information and status of the highly mutated genes of each TCGA sample and then used a heatmap to visualize the different characteristics of the risk subgroups (high SMRI and low SMRI groups). The differences in the distribution of clinical variables between risk subgroups of the training cohort were identified by the chi-square test. GSVA is an effective method to predict the pathway activity scores from gene expression data in an unsupervised and non-parametric manner. After collecting the activity estimates of the relevant pathways of interest, a differential analysis was implemented between TCGA risk subgroups based on limma’s t-test.
2.6. Mutation and immune landscapes of risk subgroups of the training cohort
The mutation activity of cancer cells can produce tumor-specific neoantigens, which may be used as biomarkers in cancer immunotherapy [Citation24]. The subtypes of immune cells (T lymphocytes, macrophages, and dendritic cells) enriched in the tumor microenvironment have an important impact on tumor outcome [Citation25]. The differences in prognosis between risk subgroups may stem from the extent of TMB and immune infiltration and the type of immune cells. With this consideration, we compared the differences in TMB levels between risk subgroups of the training cohort. TMB was defined as the number of mutations per million bases, based on the total number of somatic mutations in each sample. The immune score based on the ESTIMATE algorithm was used to evaluate the immune status of risk subgroups. As for immune infiltration, we used CIBERSORT (https://cibersort.stanford.edu/) to estimate the relative abundance of 22 tumor-infiltrating immune cells (TIICs) in AML. Wilcoxon rank-sum test was used to compare the differences of TIICs between risk subgroups. Besides, we identified the divergences in the expression levels of immune checkpoint molecules (such as PD-1, PD-L2, CTLA4, and LAG3) between the risk subgroups. Immune checkpoint proteins have implications for tumor immune escape and patient outcomes [Citation26].
2.7. Statistical analysis
All statistical analyses were implemented in R software version 4.0.0. The survival analysis between each group was performed by the Kaplan–Meier method. Differences in clinical variables between risk subgroups were compared by the chi-square test. Limma’s t-test was used to determine differential pathway activities and differentially expressed lncRNAs and genes. For continuous variables, the comparison results between two groups were derived from the Wilcox test, and the comparison results between multiple groups were derived from Kruskal–Wallis test. The correlation between protein-coding genes and lncRNAs was tested by Spearman’s correlation analysis.
3. Results
3.1. Somatic mutation-associated lncRNAs (SMlncs) in TCGA AML patients
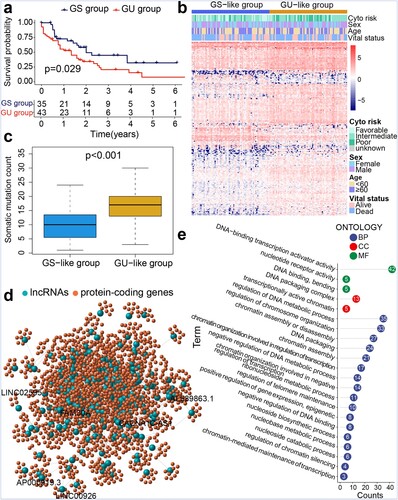
We identified 2633 lncRNAs through median absolute deviation. Based on the differences in somatic mutation counts of the TCGA samples, we selected 35 samples with the lowest mutation counts (defined as the GS group) and 43 samples with the highest mutation counts (defined as the GU group) (Table S1). The Kaplan–Meier survival curve revealed that the overall survival (OS) of the GU group was lower than that of the GS group (p = 0.029; a). Using the 'limma' R package, we found that 205 lncRNAs were upregulated whereas 49 lncRNAs were downregulated in the GU group (Table S2). Subsequently, we excluded samples with missing prognostic information and obtained clustering information of TCGA samples based on 254 SMlncs. As shown in b, the samples were classified into two groups based on the lncRNA expression profiles. Similarly, the subgroup with higher somatic mutation counts was designated as the GU-like group, while the other group was designated as the GS-like group. c showed the higher median somatic mutation counts of the GU-like group than the GS-like group (p < 0.001). To explore the biological functions involved in these 254 SMlncs, we performed functional enrichment analysis on the protein-coding genes related to SMlncs. Therefore, we conducted an expression correlation analysis between SMlncs and protein-coding genes and extracted the top ten protein-coding genes most relevant to each SMlncs. We visualized the connections between them through the co-expression network diagram (d). If a lncRNA and a protein-coding gene are correlated, they are linked by lines. Nodes with different colors represented protein-coding genes and lncRNAs, respectively. Related GO analysis showed that these protein-coding genes were involved in negative regulation of DNA binding, nucleobase metabolic process, chromatin-mediated maintenance of transcription, regulation of telomere maintenance, regulation of chromatin silencing, and DNA-binding transcription activator activity (e). Subsequently, the 254 SMlncs were used as seed genes for the construction of SMRI. We selected 18 components from the seed genes that have significant prognostic significance with the help of Kaplan–Meier survival analysis and univariate Cox proportional hazards regression analysis (Table S3). To improve the accuracy of the analysis, we implemented LASSO regression analysis and selected ten lncRNAs for further identification (Figure S1).
Figure 1. Genomic instability characteristics-based hierarchical clustering of TCGA samples. (a) Kaplan–Meier survival analysis of genomic stable (GS) and genomic unstable (GU) groups. (b) Hierarchical clustering of TCGA AML samples. Samples were classified into GU-like and GS-like groups. (c) Boxplot for somatic mutation counts. (d) Co-expression network of lncRNAs and protein-coding genes. (e) Functional enrichment analysis of GO terms for protein-coding genes.
3.2. Somatic mutation-associated risk index (SMRI) for AML
We previously mentioned that TCGA samples are randomly divided into cohorts A and B in the ratio of 5:5. The chi-square test showed that there were no differences between the two cohorts in terms of age (p = 0.736), sex (p = 0.866), cytogenetic risk (p = 0.446), survival status (p = 1), FLT3-TKD mutation (p = 0.159), FLT3-ITD mutation (p = 1), DNMT3A mutation (p = 1), TP53 mutation (p = 0.743), and NPM1 mutation (p = 0.850) (Table S4). These results suggested that our random allocation of samples was successful. Then we retained six lncRNAs through the multivariate Cox regression analysis and calculated the SMRI of each sample from the regression coefficient and expression level: SMRI = FAM30A*0.207952 + LINC00926*(-0.050003) + LINC02595*(-0.300374) + AP000919.3*(-0.094579) + AL589863.1*(-0.478995) + CACNA1C-AS1*(-0.206377). The median SMRI of the training cohort was the critical point for distinguishing high SMRI and low SMRI patients. For the TCGA data, we found that the high SMRI group tended to have a poor prognosis compared to the low SMRI group in the training cohort (p < 0.001; a), A cohort (p < 0.001; d), and B cohort (p < 0.001; g). The ROC curves of the three AML cohorts proved that SMRI has a higher prognostic value than age, cytogenetic risk, and other 2017 ELN risk factors (b, e, h; Figure S2a-c). The expression characteristics of six lncRNAs were also visualized, and the high SMRI group was accompanied by more deaths (c, f, i). For the external verification cohort, the OS of the high SMRI group was worse than that of the low SMRI group (p = 0.011; a). The area under the ROC curve suggested that the predictive value of SMRI was slightly inferior to the age and cytogenetic risk (b; Figure S2d). We also visualized the gene expression, SMRI, and survival status of each sample in the risk subgroups of the verification cohort (c). Data from training (p < 0.001), A (p = 0.009), B (p < 0.001), and verification (p = 0.030) cohorts proved that SMRI was still significantly correlated with overall survival after adjusting for clinicopathological characteristics such as age, sex, and cytogenetic risk (; d).
Figure 2. Construction of SMRI of AML patients in TCGA. Kaplan–Meier survival plots of high SMRI and low SMRI groups in the training (a), A (d), and B (g) cohorts. ROC curve analysis of SMRI and clinical characteristics in the training (b), A (e), and B (h) cohorts. Distribution of gene expression, SMRI, and vital status in the training (c), A (f), and B (i) cohorts.
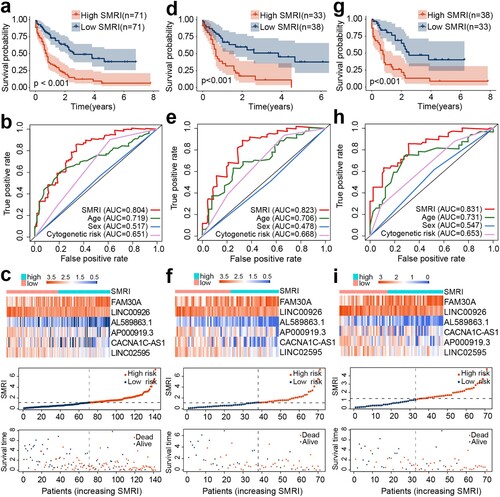
Figure 3. Validation of SMRI in GEO. (a) Kaplan–Meier survival analysis of SMRI subtypes. (b) The area under the ROC curve based on SMRI, age, sex, and cytogenetic risk. (c) The variation trends of lncRNA expression, SMRI, and vital status of the risk subgroups. (d) Univariate and Multivariate analysis of SMRI and other prognostic factors in GEO dataset.
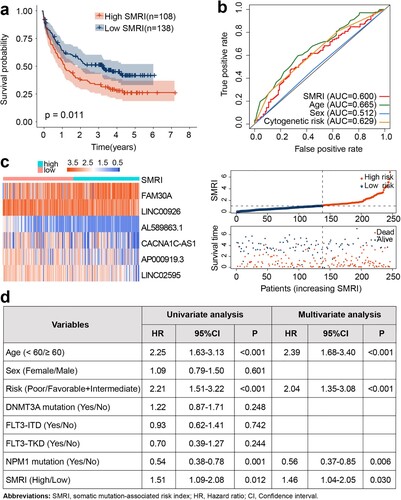
Table 2. Univariate and Multivariate analysis of SMRI and other prognostic factors in TCGA dataset.
3.3. Exploring the prognostic prediction potential of SMRI based on TCGA training cohort
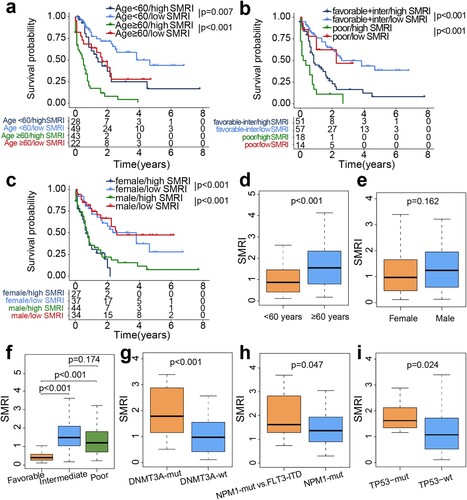
We further revealed the prognostic differences of SMRI subtypes in different hierarchical features, including age (age < 60 and age ≥ 60), sex (female and male), and cytogenetic risk (poor, favorable, and intermediate). Kaplan–Meier plots manifested low survival rates of the high SMRI, which revealed that age, cytogenetic risk, and sex do not disturb the robustness of SMRI in AML prognostic prediction (a-c). Subsequently, we compared the differences in SMRI in clinical subgroups (d-i). Notably, in patients with advanced age (p < 0.001), the SMRI was usually observed to be elevated, but the SMRI was not correlated with sex (p = 0.162). The group with favorable cytogenetic risk scored the lowest SMRI, but the intermediate- and poor-risk showed no difference in SMRI. In different clinical characteristic groups, patients with DNMT3A (p < 0.001) or TP53 (p = 0.024) mutation status exhibited a tendency to acquire higher SMRI. Also, patients harboring FLT3-ITD and NPM1 mutations had higher SMRI than patients with only NPM1 mutations (p = 0.047).
Figure 4. Stratified survival analysis and differential distribution of SMRI in TCGA clinical subgroups. Kaplan–Meier survival curves of SMRI subtypes in clinical subgroups, samples were classified according to age (a), cytogenetic risk (b), and sex (c). (d-i) Differences of the SMRI in clinical subgroups.
3.4. Clinical characteristics and differential pathways in risk subgroups
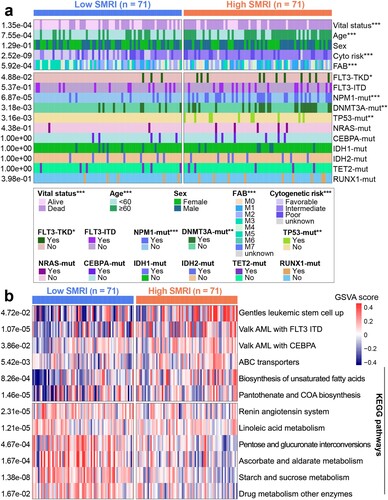
We exhibited the distribution of clinical characteristics and top-ranked mutant genes in the TCGA risk subgroups in the heatmap (a). The Chi-square test revealed several distinct differences between AML subgroups. Compared with the low SMRI group, patients in the high SMRI group tended to have unfavorable clinicopathological factors, such as advanced age (p = 7.55e-04) and poor cytogenetic risk (p = 2.52e-09). In addition, the high SMRI group showed more patients with death status (p = 1.35e-04). Chi-square test displayed that highly mutated FLT3-TKD (p = 4.88e-02), NPM1 (p = 6.87e-05), TP53 (p = 3.16e-03), DNMT3A (p = 3.18e-03) were associated with high SMRI group. However, no differences in the distribution of sex (p = 1.29e-01), FLT3-ITD status (p = 5.37e-01), NRAS status (p = 4.38e-01), CEBPA status (p = 1), IDH1 status (p = 1), IDH2 status (p = 1), TET2 status (p = 1), and RUNX1 status (p = 3.98e-01) were observed between risk subgroups. Gene set variation analysis results proved that AML with FLT3-ITD mutation, CEBPA mutation, and LSCs were related to the high SMRI group (b). Starch and sucrose metabolism, ascorbate and aldarate metabolism, pentose and glucuronate interconversions, linoleic acid metabolism, and drug metabolism other enzymes were related to the low SMRI group (b).
Figure 5. Distribution of clinical features and GSVA of risk subgroups in training cohort. (a) Differences in clinicopathological characteristics and gene mutation status. (b) Heatmap of subgroup-specific biological pathways.
3.5. The mutation profiles and immune microenvironment of risk subgroups in the training cohort
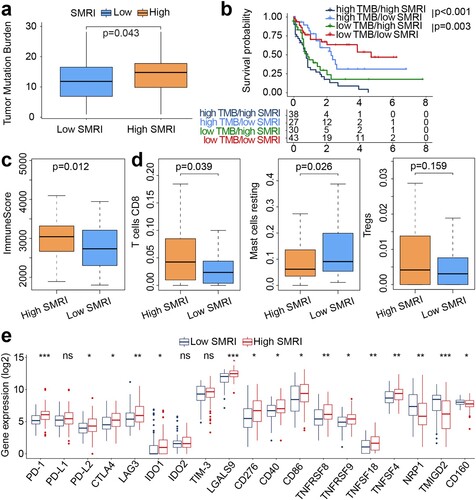
a showed the higher TMB of the high SMRI group (p = 0.043). As shown in b, the median SMRI can still distinguish patients into different survival groups with statistical significance in the high TMB group and the low TMB group, regardless of TMB level. The immune score of the high SMRI group was higher than that of the low SMRI group (p = 0.012; c). The statistical differences indicated that the high SMRI group had higher abundance of CD8+ T cells (p = 0.039) and lower abundance of mast cells resting (p = 0.026) than the low SMRI group (d). No differential infiltration of regulatory T cells (Tregs) was observed between risk subgroups (p = 0.159; d). We also determined the correlation between risk subgroups and the expression of multiple immune checkpoint molecules. In addition to PD-L1, IDO2, and TIM-3, the high SMRI group showed higher expression for PD-1, PD-L2, CTLA4, LAG3, and IDO1 than the low SMRI group (e).
Figure 6. Mutation profiles and immune landscapes of risk subgroups in the training cohort. (a) Boxplot of TMB between risk subgroups (high SMRI and low SMRI groups). (b) Kaplan–Meier survival curves of SMRI subtypes in high TMB and low TMB groups. (c) Boxplot of immune score between risk subgroups. (d) Boxplot for immune cell infiltration. (e) Boxplot for immune checkpoint expression. *p < 0.05, **p < 0.01, ***p < 0.001.
3.6. Prognostic analysis of lncRNAs
As described in the section 'Materials and methods', we screened the differentially expressed lncRNAs between the GS group and the GU group based on the somatic mutation counts in the TCGA dataset. FAM30A, CACNA1C-AS1, and LINC02595 were found to be up-regulated in the GU group; LINC00926, AL589863.1, and AP000919.3 were found to be up-regulated in the GS group (Figure S3). For the TCGA dataset, the elevated expression of CACNA1C-AS1 (p = 0.044), LINC02595 (p = 0.021), LINC00926 (p = 0.017), AL589863.1 (p = 0.012), and AP000919.3 (p = 0.047) predicted a better prognosis, while elevated expression of FAM30A (p = 0.014) indicated a poor prognosis (Figure S4a). For the GEO dataset, we only found the prognostic value of FAM30A (p = 0.049), LINC00926 (p = 0.007), and AP000919.3 (p = 0.050) expression in AML patients (Figure S4b).
4. Discussion
Although some breakthroughs have been made in clinical and basic research on AML, the available treatment methods are still relatively limited. Age, performance status, cytogenetics, and gene mutations (such as FLT3, NPM1, DNMT3A, and CEBPA) are considered to be important prognostic factors at initial diagnosis [Citation27]. With the advancement of genome-wide sequencing technology, it has gradually become a consensus of people to focus on the implementation of personalized targeted therapies to achieve the best therapeutic effect according to the cellular and molecular genetic characteristics of different AML patients [Citation28]. However, the high degree of heterogeneity of AML makes it show a poor prognosis [Citation29].
Genomic instability is considered to be one of the driving factors in tumorigenesis with important significance in patient survival [Citation30,Citation31]. LncRNA expression is commonly altered in various cancer types and correlates to patient outcomes [Citation32Citation–Citation34]. Although it has been shown that lncRNAs are related to patient prognosis, the somatic mutation-associated lncRNAs of genomic instability and their clinical values in AML remain unknown. Therefore, we combined the lncRNA expression profile and AML mutation profile to identify lncRNAs and biomarkers related to genomic instability. In this analysis, we identified 254 SMlncs related to AML. Functional enrichment analysis of related targets of these SMlncs revealed enrichment in GO terms for negative regulation of DNA binding, nucleobase metabolic process, chromatin-mediated maintenance of transcription, regulation of telomere maintenance, regulation of chromatin silencing, and DNA-binding transcription activator activity. Such results suggested the connection between SMlncs and genetic instability [Citation35,Citation36]. We then examined the prognostic significance of SMlncs and constructed the SMRI based on six SMlncs.
We verified the application value of SMRI in clinical prognosis prediction. The low SMRI group showed significantly favorable OS on the Kaplan–Meier survival curve. In fact, we further evaluated whether the medium SMRI can still distinguish patients into different survival groups with statistical significance in the same clinical subgroups (such as a younger group, an elder group, a female group, a male group, a poor cytogenetic risk group, etc.). Stratified survival analysis revealed that the medium SMRI can still identify high-risk and low-risk patients in these clinical subgroups. More importantly, both TCGA and GEO cohorts presented that the SMRI is still significantly associated with clinical prognosis, even after adjustment for clinical factors (age, sex, cytogenetic risk, FLT3-ITD, FLT3-TKD, DNMT3A, and NPM1 mutation status). ROC curve analysis of the TCGA cohort showed that the predictive value of SMRI is higher than age and cytogenetics risk. These results indicate that the SMRI we established has good application value in clinical prognosis prediction. After that, we attempted to parse out potential clinical characteristics of patients with high SMRI, and we then found that high SMRI was correlated with advanced age, unfavorable cytogenetic risk, DNMT3A mutations, and TP53 mutations, all of which were clues of adverse prognosis of AML patients [Citation27,Citation37,Citation38]. We also found that the high SMRI group showed a higher frequency of FLT3-TKD, but its prognostic value in AML is still controversial [Citation38]. As reported, NPM1 mutation is treated as a favorable prognostic marker in the absence of FLT3-ITD mutation. However, patients with NPM1 mutation frequently have FLT3-ITD mutation, and FLT3-ITD mutation often exerts its negative impact in NPM1 mutated patients [Citation39]. Consistent with this report, we noticed that the SMRI of AML patients with FLT3-ITD and NPM1 mutations was higher than that of patients with only NPM1 mutation, and previous results have shown that high SMRI was associated with poor prognosis.
To understand the potential reasons for the differential prognosis of SMRI subtypes, we further compared the mutation and immune characteristics of risk subgroups of the training cohort. We found that the high TMB levels mainly appeared in the high SMRI group. High levels of TMB were reported to be associated with favorable immunotherapy response of certain solid tumors such as non-small-cell lung cancer [Citation40,Citation41]. However, AML is typically a low mutational burden disease [Citation42], and the role of TMB for immunotherapeutic approaches in AML has not been fully elucidated. More and more evidence shows that AML can activate different immune pathways, lead to immunosuppressive function, determine the tumor’s immune microenvironment, and reduce overall survival rates [Citation43,Citation44]. The roles of TIICs in cancers have gradually been disclosed, especially in the regulation of tumor prospects [Citation25]. In our prediction data, high SMRI populations manifested less infiltration of resting mast cells and significant infiltration of CD8+ T cells in comparison to low SMRI populations; besides, although the difference was not statistically significant, the higher infiltration abundance of Tregs mainly appeared in the high SMRI group. The risk subgroups defined by SMRI were demonstrated to have differing immune checkpoint expression patterns, with a larger share of PD-1, PD-L2, CTLA4, LAG3, and IDO1expression in high SMRI populations. Tregs exert a significant role in the immunosuppressive networks that lead to a disabled antileukemic immune response [Citation45]. Although CD8+ T cells show an essential role in anti-tumor immune responses, their tumor-killing functions are present at an inferior level in AML [Citation46]. Programmed cell death 1 (PD-1), which is highly expressed on the surface of activated T lymphocytes, is considered to be a T cell brake, and its combination with PD-L1 ligand expressed on the tumor cells incurs the decrease of tumor suppressors, thus restraining the anti-tumor immune effect and tumor clearance ability mediated by cytotoxic T cells [Citation47,Citation48]. AML patients with high PD-1 expression tend to develop an exhausted T cell phenotype, which leads to immune escape and poor outcomes [Citation49]. Similarly, cytotoxic T lymphocyte antigen 4 (CTLA4) expressed by CD4+ and CD8+ T cells is a key co-inhibitory molecule that can inhibit T cell activation and T cell response [Citation50]. Hence, we speculated that hypermutation phenotype (TP53 and DNMT3A mutations), advanced age, poor cytogenetic risk, weak CD8+ T cell killing function, and overexpressed immunosuppressive targets (PD-1, PD-L2, CTLA4, LAG3, and IDO1) might be responsible for the unfavorable prognosis observed in patients with high SMRI. It is well known that immune checkpoint inhibitors suppress checkpoints on immune cells, thereby activating the anti-tumor response of T cells [Citation21]. The role of PD-1 and PD-L1 in the immunosuppression of cancers makes them potential targets of ICI therapy [Citation51]. A recent phase 2 study proposed that ICI therapy (nivolumab) concurrent with azacytidine resulted in a higher objective response rate, longer median overall survival, and event-free survival compared with chemotherapy alone [Citation52]. While ICI therapy activates T cells and triggers antitumor immunity in many patients, a large proportion of AML patients do not respond to ICI therapy [Citation53]. In the prediction results of this analysis, we speculated that higher immune checkpoint expression and CD8+ T cell infiltration make the high SMRI group more likely to benefit from ICI therapy. Also, the high SMRI group showed a higher NPM1 mutation rate than the low SMRI group, and the mutated NPM1 is considered to be a possible target of immunotherapy [Citation54].
GSVA revealed that LSCs were associated with high SMRI patients. Leukemia stem cells (LSCs) have the ability to trigger leukemia and continue generating leukemia cells and also show immune resistance characteristics [Citation55].
Although our analysis provides a potential reference for the prognosis prediction of AML, there remain some limitations: This study is based on retrospective data from TCGA and GEO databases, and it is not easy to obtain more prognostic information that affects patient outcomes; The characteristics of immune infiltration between risk subgroups are predicted based on bioinformatics methods, and their actual significance needs to be verified.
5. Conclusion
In conclusion, we constructed and tested SMRI based on somatic mutation-associated lncRNAs. SMRI was predictive of overall survival independent of age and cytogenetic risk. The current SMRI might provide more information for risk stratification and ICI therapy for AML.
Consent to participate
Not applicable
Authors’ contributions
QX was responsible for study design, data analysis, figure visualization, and manuscript; TG contributed to the writing and review of the paper.
Supplemental Material
Download MS Word (1.4 MB)Supplemental Material
Download MS Excel (32.6 KB)Disclosure statement
The authors report no conflict of interest
Data availability statement
All data related to this manuscript can be downloaded for free from TCGA (https://portal.gdc.cancer.gov/), GEO (https://www.ncbi.nlm.nih.gov/geo/), and UCSC Xena (https://xenabrowser.net/).
Additional information
Funding
Related Research Data
References
- Siegel RL, Miller KD, Fuchs HE, et al. Cancer Statistics, 2021. CA Cancer J Clin. 2021;71(1):7–33.
- Blum WG, Mims AS. Treating acute myeloid leukemia in the modern era: A primer. Cancer. 2020;126(21):4668–4677.
- Negrini S, Gorgoulis VG, Halazonetis TD. Genomic instability--an evolving hallmark of cancer. Nat Rev Mol Cell Biol. 2010;11(3):220–228.
- Sallmyr A, Fan J, Rassool FV. Genomic instability in myeloid malignancies: increased reactive oxygen species (ROS), DNA double strand breaks (DSBs) and error-prone repair. Cancer Lett. 2008;270(1):1–9.
- Marcucci G, Haferlach T, Döhner H. Molecular genetics of adult acute myeloid leukemia: prognostic and therapeutic implications. J Clin Oncol. 2011;29(5):475–486.
- Lischka A, Doberstein N, Freitag-Wolf S, et al. Genome Instability Profiles Predict Disease Outcome in a Cohort of 4,003 Patients with Breast Cancer. Clin Cancer Res. 2020;26(17):4606–4615.
- Lin Y, Luo Y, Sun Y, et al. Genomic and transcriptomic alterations associated with drug vulnerabilities and prognosis in adenocarcinoma at the gastroesophageal junction. Nat Commun. 2020;11(1):6091.
- Malihi PD, Graf RP, Rodriguez A, et al. Single-Cell Circulating Tumor Cell Analysis Reveals Genomic Instability as a Distinctive Feature of Aggressive Prostate Cancer. Clin Cancer Res. 2020;26(15):4143–4153.
- Kronenwett U, Ploner A, Zetterberg A, et al. Genomic instability and prognosis in breast carcinomas. Cancer Epidemiol Biomarkers Prev. 2006;15(9):1630–1635.
- Bao S, Hu T, Liu J, et al. Genomic instability-derived plasma extracellular vesicle-microRNA signature as a minimally invasive predictor of risk and unfavorable prognosis in breast cancer. J Nanobiotechnology. 2021;19(1):22.
- Garzon R, Volinia S, Papaioannou D, et al. Expression and prognostic impact of lncRNAs in acute myeloid leukemia. Proc Natl Acad Sci U S A. 2014;111(52):18679–18684.
- Cao L, Xiao PF, Tao YF, et al. Microarray profiling of bone marrow long non-coding RNA expression in Chinese pediatric acute myeloid leukemia patients. Oncol Rep. 2016;35(2):757–770.
- Hu YP, Jin YP, Wu XS, et al. LncRNA-HGBC stabilized by HuR promotes gallbladder cancer progression by regulating miR-502-3p/SET/AKT axis. Mol Cancer. 2019;18(1):167.
- Zuo X, Chen Z, Gao W, et al. M6A-mediated upregulation of LINC00958 increases lipogenesis and acts as a nanotherapeutic target in hepatocellular carcinoma. J Hematol Oncol. 2020;13(1):5.
- Zheng ZQ, Li ZX, Zhou GQ, et al. Long Noncoding RNA FAM225A Promotes Nasopharyngeal Carcinoma Tumorigenesis and Metastasis by Acting as ceRNA to Sponge miR-590-3p/miR-1275 and Upregulate ITGB3. Cancer Res. 2019;79(18):4612–4626.
- Hu WL, Jin L, Xu A, et al. Guardin is a p53-responsive long non-coding RNA that is essential for genomic stability. Nat Cell Biol. 2018;20(4):492–502.
- Munschauer M, Nguyen CT, Sirokman K, et al. The NORAD lncRNA assembles a topoisomerase complex critical for genome stability. Nature. 2018;561(7721):132–136.
- Bartonicek N, Maag JL, Dinger ME. Long noncoding RNAs in cancer: mechanisms of action and technological advancements. Mol Cancer. 2016;15(1):43.
- Huarte M. The emerging role of lncRNAs in cancer. Nat Med. 2015;21(11):1253–1261.
- Pu C, Tao S, Xu J, et al. Harnessing Genomic Stress for Antitumor Immunity. Antioxid Redox Signal. 2021;34(14):1128–1150.
- Vago L, Gojo I. Immune escape and immunotherapy of acute myeloid leukemia. J Clin Invest. 2020;130(4):1552–1564.
- Tibshirani R. Regression shrinkage and selection via the lasso: a retrospective. J R Stat Soc Series B Stat Methodol. 2011;73(3):273–282.
- Dohner H, Estey E, Grimwade D, et al. Diagnosis and management of AML in adults: 2017 ELN recommendations from an international expert panel. Blood. 2017;129(4):424–447.
- Schumacher TN, Schreiber RD. Neoantigens in cancer immunotherapy. Science. 2015;348(6230):69–74.
- Grivennikov SI, Greten FR, Karin M. Immunity, inflammation, and cancer. Cell. 2010;140(6):883–899.
- Wilky BA. Immune checkpoint inhibitors: The linchpins of modern immunotherapy. Immunol Rev. 2019;290(1):6–23.
- Liersch R, Muller-Tidow C, Berdel WE, et al. Prognostic factors for acute myeloid leukaemia in adults--biological significance and clinical use. Br J Haematol. 2014;165(1):17–38.
- Grimwade D, Ivey A, Huntly BJ. Molecular landscape of acute myeloid leukemia in younger adults and its clinical relevance. Blood. 2016;127(1):29–41.
- Li H, Mar BG, Zhang H, et al. The EMT regulator ZEB2 is a novel dependency of human and murine acute myeloid leukemia. Blood. 2017;129(4):497–508.
- Carter SL, Eklund AC, Kohane IS, et al. A signature of chromosomal instability inferred from gene expression profiles predicts clinical outcome in multiple human cancers. Nat Genet. 2006;38(9):1043–1048.
- Hieronymus H, Murali R, Tin A, et al. Tumor copy number alteration burden is a pan-cancer prognostic factor associated with recurrence and death. Elife. 2018;7:e37294.
- Ling H, Spizzo R, Atlasi Y, et al. Ccat2, a novel noncoding RNA mapping to 8q24, underlies metastatic progression and chromosomal instability in colon cancer. Genome Res. 2013;23(9):1446–1461.
- Papaioannou D, Nicolet D, Ozer HG, et al. Prognostic and Biologic Relevance of Clinically Applicable Long Noncoding RNA Profiling in Older Patients with Cytogenetically Normal Acute Myeloid Leukemia. Mol Cancer Ther. 2019;18(8):1451–1459.
- Sun J, Li W, Sun Y, et al. A novel antisense long noncoding RNA within the IGF1R gene locus is imprinted in hematopoietic malignancies. Nucleic Acids Res. 2014;42(15):9588–9601.
- Wang G, Vasquez KM. Effects of Replication and Transcription on DNA Structure-Related Genetic Instability. Genes (Basel). 2017;8(1):17.
- Sarek G, Marzec P, Margalef P, et al. Molecular basis of telomere dysfunction in human genetic diseases. Nat Struct Mol Biol. 2015;22(11):867–874.
- Ley TJ, Ding L, Walter MJ, et al. Dnmt3a mutations in acute myeloid leukemia. N Engl J Med. 2010;363(25):2424–2433.
- Kayser S, Levis MJ. Clinical implications of molecular markers in acute myeloid leukemia. Eur J Haematol. 2019;102(1):20–35.
- Gale RE, Green C, Allen C, et al. The impact of FLT3 internal tandem duplication mutant level, number, size, and interaction with NPM1 mutations in a large cohort of young adult patients with acute myeloid leukemia. BLOOD. 2008;111(5):2776–2784.
- Hellmann MD, Nathanson T, Rizvi H, et al. Genomic Features of Response to Combination Immunotherapy in Patients with Advanced Non-Small-Cell Lung Cancer. Cancer Cell. 2018;33(5):843–852.e4.
- Rizvi NA, Hellmann MD, Snyder A, et al. Cancer immunology. Mutational landscape determines sensitivity to PD-1 blockade in non-small cell lung cancer. Science. 2015;348(6230):124–128.
- Chalmers ZR, Connelly CF, Fabrizio D, et al. Analysis of 100,000 human cancer genomes reveals the landscape of tumor mutational burden. Genome Med. 2017;9(1):34.
- Zhang J, Hu X, Wang J, et al. Immune receptor repertoires in pediatric and adult acute myeloid leukemia. Genome Med. 2019;11(1):73.
- van Galen P, Hovestadt V, Wadsworth IM, et al. Single-Cell RNA-Seq Reveals AML Hierarchies Relevant to Disease Progression and Immunity. Cell. 2019;176(6):1265–1281.e24.
- Ustun C, Miller JS, Munn DH, et al. Regulatory T cells in acute myelogenous leukemia: is it time for immunomodulation? Blood. 2011;118(19):5084–5095.
- Jia B, Wang L, Claxton DF, et al. Bone marrow CD8 T cells express high frequency of PD-1 and exhibit reduced anti-leukemia response in newly diagnosed AML patients. Blood Cancer J. 2018;8(3):34.
- Fife BT, Pauken KE, Eagar TN, et al. Interactions between PD-1 and PD-L1 promote tolerance by blocking the TCR-induced stop signal. Nat Immunol. 2009;10(11):1185–1192.
- Keir ME, Liang SC, Guleria I, et al. Tissue expression of PD-L1 mediates peripheral T cell tolerance. J Exp Med. 2006;203(4):883–895.
- Tan J, Yu Z, Huang J, et al. Increased PD-1+Tim-3+ exhausted T cells in bone marrow may influence the clinical outcome of patients with AML. Biomark Res. 2020;8:6.
- Hobo W, Hutten T, Schaap N, et al. Immune checkpoint molecules in acute myeloid leukaemia: managing the double-edged sword. Br J Haematol. 2018;181(1):38–53.
- Ghahremanloo A, Soltani A, Modaresi S, et al. Recent advances in the clinical development of immune checkpoint blockade therapy. Cell Oncol (Dordr). 2019;42(5):609–626.
- Daver N, Garcia-Manero G, Basu S, et al. Efficacy, Safety, and Biomarkers of Response to Azacitidine and Nivolumab in Relapsed/Refractory Acute Myeloid Leukemia: A Nonrandomized, Open-Label, Phase II Study. Cancer Discov. 2019;9(3):370–383.
- Ghosh A, Barba P, Perales MA. Checkpoint inhibitors in AML: are we there yet? Br J Haematol. 2020;188(1):159–167.
- van der Lee DI, Reijmers RM, Honders MW, et al. Mutated nucleophosmin 1 as immunotherapy target in acute myeloid leukemia. J Clin Invest. 2019;129(2):774–785.
- Perry JM, Tao F, Roy A, et al. Overcoming Wnt-beta-catenin dependent anticancer therapy resistance in leukaemia stem cells. Nat Cell Biol. 2020;22(6):689–700.