
ABSTRACT
Objective
The interplay between intrinsic and extrinsic elements involved in the physiology of hematopoietic cells is not completely understood. In the present study, we analyzed the transcriptional profiles of human cord blood-derived hematopoietic stem cells (HSCs), as well as myeloid (MPCs) and erythroid (EPCs) progenitors, and assessed their proliferation and expansion kinetics in vitro.
Methods
All cell populations were obtained by cell-sorting, and were cultured in liquid cultures supplemented with different cytokine combinations. Their gene expression profiles were determined by RNA microarrays right after cell-sorting, before culture.
Results
HSCs showed the highest proliferation and expansion capacities in culture, and were found to be more closely related, in transcriptional terms, to MPCs than to EPCs. This correlated with the fact that after 30 days, only cultures initiated with HSCs and MPCs were sustained. Expression of cell cycle and cell division-related genes was enriched in EPCs. Such cells showed significantly higher proliferation than MPCs, however, their expansion potential was reduced, so that cultures initiated with EPCs declined after 15 days and became exhausted by day 30. Proliferation and expansion of HSCs and EPCs were higher in the presence of a cytokine combination that favors erythropoiesis, whereas the growth of MPCs was higher under a cytokine combination that favors myelopoiesis.
Conclusion
This study shows a correlation between the transcriptional profiles of HSCs, MPCs, and EPCs, and their respective in vitro growth under particular culture conditions. These results may be relevant in the development of ex vivo systems for the expansion of hematopoietic cells for clinical application.
Introduction
Blood cell production (hematopoiesis) is a complex and tightly regulated process that involves different cell types and a variety of molecular regulators [Citation1,Citation2]. The hematopoietic system can be viewed as a hierarchy of different cellular compartments, from self-renewing multipotent hematopoietic stem cells (HSCs) to mature non-dividing circulating blood cells of different lineages. Intermediate compartments include multipotent, oligopotent, bipotent, and monopotent progenitors (HPCs), as well as morphologically recognizable precursor cells [Citation3]. The HSC compartment corresponds to <0.05% of bone marrow cells and consists of different subpopulations of self-renewing cells expressing cell surface markers CD34, CD49f, CD90, CD117 and CD133 [Citation4,Citation5]. HPCs, on the other hand, correspond to 0.1–0.5% of bone marrow cells; they are unable to self-renew but possess high/intermediate proliferation potentials and are capable of forming colonies in semisolid cultures. They express variable levels of CD34, CD38, and CD45RA, and acquire lineage-specific antigens depending on their commitment to particular cell lineages [Citation3].
Both HSCs and HPCs possess specific genetic programs that determine their functional capacities and cell fate [Citation6–8]. It is noteworthy, however, that dynamics of hematopoiesis not only depends on the molecular and functional integrity of HSCs/HPCs, but also on the interaction of such cells with the bone marrow hematopoietic microenvironment (HM) in which they develop [Citation9–14]. Thus, HSC/HPC viability, self-renewal, proliferation, expansion, and differentiation are determined by the celĺs own genetic programs (intrinsic elements) and the effects of stimulatory/inhibitory molecules provided by the HM (extrinsic elements). The above principles stand not only in vivo but also in vitro. Indeed, when cultured in vitro, the growth of HSCs and HPCs depends on the experimental conditions used; that is to say, the input cell population, cytokine combination, presence or absence of supportive cells, etc. [Citation15–17].
We have previously presented evidence indicating that HSCs and HPCs generated in vitro differ from their freshly isolated counterparts in transcriptional and functional terms [Citation18]. In the present study, we have followed a similar approach to analyze the global gene expression profiles of HSCs, as well as of myeloid (MPCs) and erythroid (EPCs) progenitor cells, and assessed their in vitro proliferation and expansion kinetics under different cytokine combinations. Our goal was to compare these three cell populations (HSCs, MPCs, EPCs) between each other in terms of their basal (before being cultured) transcription programs and their in vitro proliferation/expansion capacities under the influence of different cytokine environments.
Materials and methods
Cell Collection and processing
Human Umbilical Cord Blood (UCB) cells, collected according to institutional guidelines, were obtained from normal full-term deliveries at the Troncoso Hospital (IMSS, Mexico City), as described previously by us [Citation18,Citation19]. Informed consent was obtained from every single donor.
Purification of HSCs, MPCs, and EPCs
Purification of human UCB-derived HSCs, MPCs, and EPCs was performed as previously described [Citation18]. Briefly, Cells expressing the CD34 antigen (CD34+ cells) were enriched from mononuclear cells (MNCs) by negative selection [Citation20], using the EasySep™ system, according to the manufacturer’s instructions (StemCell Technologies Inc [STI], Vancouver, Canada). Before negative selection, CD34+ cells corresponded to 0.7–2.1% of MNCs; after negative selection, CD34+ cells corresponded to 67.2–89.0% of the enriched Lineage-negative (Lin-) cell population. From the recovered cells, CD34+ cell subpopulations were purified by Fluorescence Activated Cell Sorting (FACS), using a FACS Aria II (BD; San Jose, California). All the antibodies used were purchased from BD Bioscience, and were selected using the antibodies approved by EuroFlow Guide for Flow Cytometry (2011). Three different cell populations were obtained by standard FACS protocols: HSCs, defined as CD34+ CD38- CD45RA- CD71- Lin- cells; MPCs, defined as CD34+ CD38+ CD45RA+ CD71- Lin- cells; and EPCs, defined as CD34+ CD38+ CD45RA- CD71+ Lin- cells. These immunophenotypic criteria were based on previous studies [Citation18,Citation21].
Microarrays and gene expression analysis
Microarrays were performed on freshly isolated cells, before any culture. For the HSC population, 12,432 ± 5,934 cells were obtained with 98.6% purity; for the MPC population, 35,282 ± 16,795 cells were obtained with 97.9% purity; for the EPC population, 54,530 ± 17,780 cells were obtained with 98.6% purity. The quality of the RNA obtained from the cells was evaluated by capillary electrophoresis (Agilent 2100 Bioanalyzer; Agilent Technologies). Only RNA samples with an RNA Integrity Number greater than 6 were processed for microarray studies. One hundred picograms of RNA from each experimental condition were evaluated in the Human Transcriptome Array 2.0 gene chip (HTA 2.0; Affymetrix, Santa Clara, CA), which includes both coding (44,699) and non-coding (22,829) transcripts. The cDNA synthesis, amplification, and gene expression profiling were done with WT Pico Reagent Kit for fresh samples (Affymetrix). Wash and stain processes were performed with the GeneChip Hybridization wash and stain kit in the GeneChip Fluid Station 450 (Affymetrix). The probe arrays were scanned using the GeneChip Scanner 3000 7G (Affymetrix). Array signal intensities were analyzed with the Affymetrix expression console. Raw data probes were normalized using Signal Space Transformation-Robust Multichip Analysis (SST-RMA) for the background correction and quantile algorithm. To define the differential expression profile within the different cell populations, Affymetrix Transcriptome Analysis Console (TAC) software was used. Genes with fold change greater than 2 or lower than −2, p-value <0.05, and FDR <0.05 were considered significantly altered between the three different cell populations included in this study (MPCs vs HSCs, EPCs vs HSCs, and MPCs vs EPCs). All data were uploaded in GEO (ID: GSE107497). In order to obtain high-quality gene annotation and to identify non-Affymetrix-annotated transcripts, the Bioconductor biomaRt package was used to enrich biological data. Differentially expressed genes were employed for further analysis.
Enrichment Analysis
Key Pathway Advisor (KPA, version 17.4) was used to identify the main biological processes altered in erythroid and myeloid progenitor cells. To infer the essential cellular pathways and processes involved in the regulation of each cell population, we used the differentially expressed gene list.
Data processing and Multivariate analysis
Volcano plot. We constructed volcano plots using the expression data from 67,528 probes of the HTA 2.0 microarray. Data were plotted in the GraphPad Prism 9.0 software using log2 fold change vs -log FDR values. In each comparison, differentially expressed genes with a fold change >2 or <−2, p-value <0.05, and adjusted p-value (FDR) <0.05 were identified.
Principal Component Analysis (PCA). We perform an unsupervised analysis using BioVinci 2.0. This analysis was used to reduce the dimensionality of high-dimensional data.
Heatmap. A heatmap with the expression levels of the differentially expressed genes was generated using ClustVis, a modified version of the heatmap R package (version 0.7.7). Samples were pooled by unsupervised analysis using euclidean correlation distances.
Dendrogram. A similarity analysis was performed by generating a cluster dendrogram using Past (2.0). The dendrogram represents the clustering of gene expression experiments.
GSEA Analysis
Gene Set Enrichment Analysis (GSEA) was performed with GSEA 4.1.0 software. The official gene sets were downloaded from the MSigDB database (Broad Institute). GSEA emphasizes that enrichment gene sets with an FDR <0.25 are appropriate for interpreting data analyzes. A phenotype permutation of 1000 was used with a weighted enrichment statistic.
Real Time RT–PCR
To validate the microarray results, cDNA was generated using High Capacity cDNA Reverse Transcription Kit (ThermoFisher Scientific), from RNA of cells from three different UCB samples, following the manufacturer’s protocol. Samples were different from those used for gene microarrays. The following genes were selected for qPCR validation: MPC vs HSCs: MPO, CD38, SGIP1, and CAMK1D; EPCs vs HSCs: CDC6, CD38, AMICA1, and CCR7; MPCs vs EPCs: RUNX3, FLT3, HBD, and EPOR. Primers design and probes selection were made using Universal Probe Library System Assay designed by Roche for qPCR. Quantitative PCR experiments were performed in a Light Cycler 480 (Roche Life Science). Primers for each gene were synthesized at T4 Oligo Company. Fold change of gene expression was determined with the 2−ΔΔCT method using GAPDH as the housekeeping gene. Statistical analysis was performed using Student’s t- test.
Liquid suspension cultures
HSCs, MPCs and EPCs were cultured in liquid suspension cultures, in order to assess their proliferation and expansion potentials. Proliferation was defined as the capacity of a primitive cell to divide and give rise to new cells, regardless of their lineage and maturation stage. Expansion was defined as the capacity of a primitive cell to divide and give rise to new primitive cells, biologically similar to the initial cell. Each one of the cell populations obtained was resuspended in Serum-Free Expansion Medium (StemSpan™ SFEM; STI). The culture medium was supplemented with different combinations of the following recombinant hematopoietic cytokines: Thrombopoietin (TPO), FLT-3-ligand (FL), Stem Cell Factor (SCF), Interleukin-3 (IL-3), IL-6, Granulocyte-Macrophage Colony-Stimulating Factor (GM-CSF), G-CSF, and erythropoietin (EPO). All cytokines were purchased from R&D (Minneapolis, MN) and were added at 10 ng/ml; except for EPO, which was added at 3 IU/ml. Cells were cultured in 24-well tissue culture plates at 37°C in an atmosphere of 5% CO2 in air, at a concentration of 5 × 10³ cells/ml/well. After 5 days of culture, cells were harvested from the wells, counted, and analyzed for progenitor cell content. Secondary cultures were initiated with 5–10 × 104 nucleated cells. Cultures were processed in this manner every 5 days.
Hematopoietic colony assays
Hematopoietic progenitor cells capable of forming colonies in vitro (colony-forming cells; CFCs) were assayed in methylcellulose-based semisolid cultures (MethoCult™, STI), as previously described in detail [Citation19,Citation21].
Statistics
Results shown correspond to mean ± S.D. of the indicated number of samples. Statistical analysis was performed by using Anova-test.
Results
Cell populations
For all three cell populations analyzed (HSCs, MPCs, and EPCs), purity was >98% (Supplemental Figure 1A). In terms of CFC content, 18 ± 5% of HSCs were capable of forming hematopoietic colonies in semisolid cultures. Among such CFCs, 4% of them gave rise to colonies containing both myeloid and erythroid cells, 49% gave rise to myeloid colonies, including both granulocytic and monocitic colonies, and 47% gave rise to erythroid colonies (Supplemental Figure 1B). The majority of the latter consisted of large erythroid colonies (BFU-E). In the MPC population, 9 ± 5% of the cells were CFCs; 95% of them gave rise to myeloid colonies and 5% to small erythroid colonies (CFU-E). Finally, 24 ± 6% of the cells in the EPC population were CFCs; 97% of them gave rise to both large and small erythroid colonies, and 3% to small myeloid colonies. No myeloid-erythroid colonies were observed in the MPC or EPC populations (Supplemental Figure 1B).
Transcriptional profiles of HSCs, MPCs, and EPCs
To visualize the spatial distribution of samples, we performed an unsupervised principal component analysis (PCA). In this way, we identified 3 different clusters separating samples according to their identity (HSCs, MPCs and EPCs). This grouping analysis of the transcriptomes revealed that the greatest variation is due to PC1 with 27.51%, followed by a 16.1% variation in PC2 (A). PCA 1 showed two different branches separating HSCs and MPCs from EPCs, while principal component 2 reflected the differences between HSC and MPC. To identify the transcriptional changes that render erythroid and myeloid progenitors different from HSCs, we performed expression analysis using the HTA 2.0 microarray. Gene expression profiles of HSCs were compared with each progenitor cell type, and the expression profiles of the progenitor populations were compared with each other. Considering a fold change >2 and <−2, and an FDR <0.05, we found 822 differentially expressed transcripts between the different cell types. The gene expression profiles of these RNAs were represented in an unsupervised Heatmap. Clusters revealed the presence of three branches, each one representing a distinct cell type (B). The results showed that EPCs samples exhibited the highest number of differentially expressed genes when compared with the other cell types. Interestingly, gene expression patterns of MPCs were more closely related to HSCs.
Figure 1. Multivariate analysis of expression profiles. (A) The graph shows the principal components analysis (PCA) of freshly isolated HSC (black dots), EPC (red dots), and MPC (blue dots) populations before being cultured. Each dot on the graph represents one biological replicate. (B) Heatmap shows the unsupervised cluster of samples using euclidean correlation distances of differentially expressed genes, considering a fold change >2 or <−2 and an FDR <0.05. The color scale from red to blue represents a gradient from high to low expression, respectively. Columns represent the indicated population, and rows represent individual transcripts. The hierarchical clustering of samples is shown. C. Cluster analysis dendrogram showing the relationship between HSCs, MPCs, and EPCs. The “y” axis shows the euclidean distance and the “x” axis shows each of the analyzed samples.
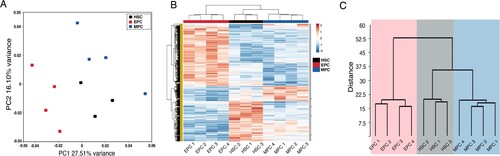
To more precisely examine similarities and differences between HSCs, MPCs and EPCs, we performed a dendrogram analysis measuring euclidian distances. The dendrogram confirmed that the expression profile of the MPCs samples was most closely related to the HSCs profile, while the EPCs samples were well separated from the expression profiles of HSCs and MPCs (C). Supporting these data, the transcriptome analysis revealed fewer differentially expressed genes between the MPCs and HSCs populations (66 genes), while a higher number of differentially expressed genes was found between EPCs and HSCs (407 genes), or even MPCs and EPCs (371 genes).
In order to visualize significant gene expression changes, we constructed volcano plots. Each plot showed the distributions of fold changes and FDRs of 67,528 probes for each comparison. The transcriptome analysis of MPCs and HSCs showed that only 54 protein-coding transcripts (12 upregulated and 42 downregulated) and 12 non-coding transcripts (5 upregulated and 7 downregulated) were differentially expressed (A). Among the most significant transcripts upregulated in MPCs we found CD48, TRAT1, JCHAIN, CD38, MPO, and GPR183; whereas among the most downregulated genes we found LXN, GBP5, FOXO1, IL1RL1, LRIG1, TNFSF10, MEIS1, and PI3K (). To gain deeper insight into the behavior of MPCs and HSCs, we performed pathway enrichment analysis using Key Pathway Advisor (KPA). Network processes and pathways were predicted using causal reasoning interactome analysis. The predicted pathways in the MPC vs HSC samples indicated that only the B cell antigen receptor pathway (BCR) was positively regulated (B). The low number of differentially expressed genes between MPCs and HSCs prevented the identification of molecular processes enriched in the MPCs. GSEA analysis showed that, as compared with MPCs, myeloid differentiation was negatively enriched in HSCs (C, D). Gene expression levels were corroborated in selected genes by real time qRT-PCR (Supplemental Figure 2).
Figure 2. Comparative transcriptome analysis of freshly isolated MPCs and HSCs. (A) Volcano plot showing differential expression of genes between MPCs and HSCs. Each dot represents a transcript. The “x” axis represents the log fold-change, and the “y” axis indicates the -log (FDR). Blue (downregulation) and red (upregulation) dots represent DEGs with fold change >2 or <−2, and FDR <0.05. Some of the most significant transcripts were labeled. (B) Key pathways with prediction of activity in myeloid progenitor cells are depicted. The “x” axis represents the -log p-value of genes enriched for each pathway, the bars in red color refer to activation and the gray bars indicate that the prediction of activity is not available of the signaling pathway. (C, D) Gene Set Enrichment Analysis of MPCs vs HSCs. Gene sets were obtained from MSigDB database (Broad Institute) and then compared against the MPC and HSC signatures. Plots depict negatively enriched gene sets in HSCs. Black lines indicate the position of each gene across the ranked dataset. The normalized enrichment score (NES) is indicated in each plot. The representative expressed genes in myeloid cell differentiation signature are GATA1, FOXO3, NFKBIA, CSF1, HIF1A, among others. The representative genes in hematopoietic stem cell differentiation signature are GATA2, GATA1, NFATC2, FOSB, KCNH2, among others.
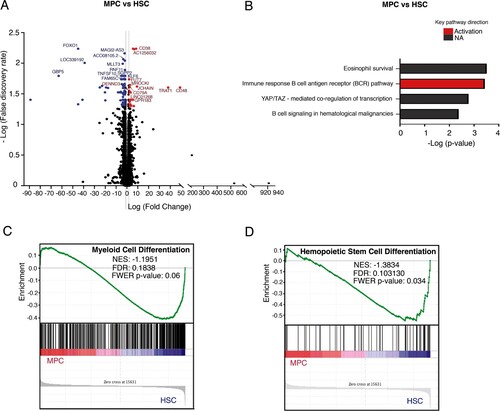
Table 1. Representative genes that were differentially expressed between hematopoietic stem and progenitor cells.
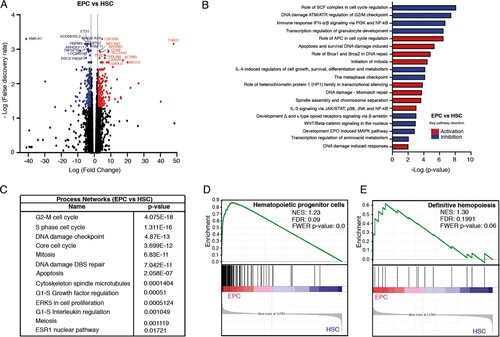
When comparing EPCs vs HSCs, we found 378 protein-coding transcripts (196 upregulated and 182 downregulated) and 29 non-coding transcripts (14 upregulated and 15 downregulated) differentially expressed (A). Among the most significant transcripts upregulated in EPCs, we found THBS1, HIST1H3B, CDC6, MYC, CD38, AURKB, FANCA, CDC25A, TFR2, E2F1, DNAJC9, GATA1, CDK1, and EPOR; whereas among the most downregulated genes we found AMICA1, CD74, HOXA5, FOXO1, PTGER4, MLLT3, TNFRSF11A, WNTA8, NFKB1, IL10RA, CD40, MEIS1, TGFBR1, and STAT6 (). We found 19 pathways with a clear prediction of activity, 10 pathways were negatively regulated and 9 were positively regulated. Among the 10 pathways negatively regulated, we found a role of SCF complex, immune response IFN-alpha/ beta signaling via PI3 K and NF-kB, transcription regulation of granulocyte development, WNT/B-catenin signaling among others. Regarding the nine activated pathways, we found a role for APC in cell cycle regulation, IL-3 signaling via JAK/STAT, p38, JNK and NF-kB, among others (B). Interestingly, differentially expressed genes participated in molecular processes, including cell cycle, DNA damage, apoptosis, and proliferation (C). GSEA analysis showed that, in contrast to HSCs, EPCs exhibited a gene signature related to committed progenitors (D, E). Gene expression levels were corroborated in selected genes by real time qRT-PCR (Supplemental Figure 2).
Figure 3. Comparative transcriptome analysis of freshly isolated EPCs and HSCs. (A) Volcano plot showing differential expression of genes between EPCs and HSCs. Each dot represents a transcript. The “x” axis represents the log fold-change, and the “y” axis indicates the -log (FDR). Blue (downregulation) and red (upregulation) dots represent DEGs with fold change >2 or <−2, and FDR <0.05. Some of the most significant transcripts were labeled. (B) Key pathways with prediction of activity in erythroid progenitor cells are depicted. The “x” axis represents the -log p-value of genes enriched for each pathway. Blue bars indicate inhibition and red bars indicate activation of the signaling pathway. (C) The process networks with changes in the erythroid population are shown. (D, E) Gene Set Enrichment Analysis of EPCs vs HSCs. Gene sets were obtained from MSigDB database (Broad Institute) and then compared against the EPC and HSC signatures. Plots depict enriched gene sets in EPC. Black lines indicate the position of each gene across the ranked dataset. The normalized enrichment score (NES) is indicated in each plot. The representative expressed genes in the hematopoietic progenitor cells signature are RYR3, PCLAF, CDK6, PLK4 among others. The representative genes in the definitive hemopoiesis signature are GATA1, GATA2, CBFB, AFPM1, among others.
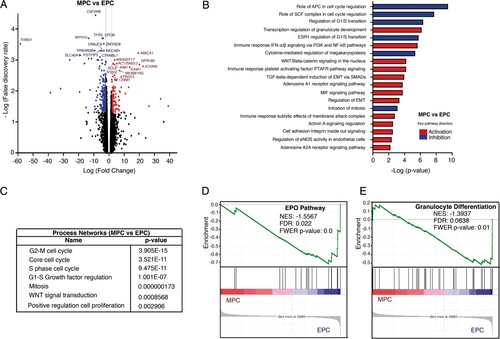
The comparison of both myeloid and erythroid progenitors (MPCs vs EPCs) revealed 343 protein-coding transcripts (104 upregulated and 239 downregulated) and 28 non-coding transcripts (12 upregulated and 16 downregulated) (A). Among the most significant transcripts upregulated in MPCs we found CCR7, JCHAIN, GPR183, CD44, FLT3, CD48, PRAM1, MAP3K8, IL10RA, TNFSF8, FGFBP2, BCL6, and CD99; whereas among the most downregulated genes we found THBS1, EPOR, CDC6, ANK1, AURKB, TFR2, GATA2, GATA1, DNAJC9, CDC45, CDK2, CDC25, DSCC1, GSPT1, TAL1 and KLF1 (). Finally, we found 19 pathways with a clear prediction of activity. Among the 6 inhibited pathways we found the role of APC and SCF complex in cell cycle regulation, the cytokine-mediated regulation of megakaryopoiesis, among others. Regarding the 13 activated pathways, we found the transcription regulation of granulocyte development, immune response IFNα/β signaling via pi3 K and NF-kb pathways, Wnt/B catenin signaling, TGF-B-dependent induction of EMT via Smads, Cell adhesion, among others (B). The analysis also indicated that differentially expressed genes participated in some molecular processes such as cell cycle, Wnt signaling transduction, and positive regulation of proliferation (C). GSEA analysis showed that the granulocytic differentiation pathway was negatively enriched in EPCs, and that EPOR and other erythroid differentiation-related genes were enriched in EPCs (D, E). Gene expression levels were corroborated in selected genes by real time qRT-PCR (Supplemental Figure 2).
Figure 4. Comparative transcriptome analysis of freshly isolated MPCs and EPCs. (A) Volcano plot showing differential expression of genes between MPCs and EPCs. Each dot represents a transcript. The “x” axis represents the log fold-change, and the “y” axis indicates the -log (FDR). Blue (downregulation) and red (upregulation) dots represent DEGs with fold change >2 or <−2, and FDR <0.05. Some of the most significant transcripts were labeled. (B) Key pathways with prediction of activity in MPCs are depicted. The “x” axis represents the -log p-value of genes enriched for each pathway. Blue bars indicate inhibition and red bars indicate activation of the signaling pathway. (C) The process networks with changes in the myeloid population are shown. (D, E) Gene Set Enrichment Analysis of MPCs vs EPCs. Gene sets were obtained from MSigDB database (Broad Institute) and then compared against the MPC and EPC signatures. Plots depict negatively enriched gene sets in EPCs. Black lines indicate the position of each gene across the ranked dataset. The normalized enrichment score (NES) is indicated in each plot. The representative expressed genes in EPO pathway signature are SHC1, SOS1, ELK1, STAT5B, PTPN6, STAT5A and EPOR. The representative genes in granulocyte differentiation signature are TAL1, FASN, ZFPM1, LEF1, GATA2, GATA1 and TESC.
Proliferation kinetics of HSCs, MPCs, and EPCs
In order to assess the proliferation capacity of all three cell populations, they were cultured in liquid cultures under two different cytokine combinations: TPO, FL, SCF, IL-6, GM-CSF, and G-CSF (myeloid cytokine mix; M mix), and TPO, FL, SCF, IL-6, IL-3, and EPO (erythroid cytokine mix; E mix). As shown in (A,B), among the three cell populations, HSCs showed the largest proliferation capacity regardless of the cytokine mix used. Interestingly, in the presence of the M mix, HSCs reached a 1967-fold increase in total cell number, by day 20 of culture (A), whereas in the presence of the E mix, they reached a 4219-fold increase, also at day 20 (B). After 30 days of culture, the total cell numbers in cultures of HSCs were similar, regardless of the cytokine mix used, corresponding to a 200–300-fold increase, as compared to day 0.
Figure 5. Proliferation and expansion kinetics of HSCs, MPCs, and EPCs. Proliferation kinetics of the three cell populations throughout liquid culture in the presence of the M cytokine mix (A) and the E cytokine mix (B). Values (mean ± S.D.; n = 7) represent the increments in total nucleated cell number, as compared to day 0. Expansion kinetics of the three cell populations throughout liquid culture in the presence of the M cytokine mix (C) and the E cytokine mix (D). Values (mean ± S.D.; n = 7) represent the increments in CFC number, as compared to day 0. Cultures were not assessed on day 25 of culture. Based on data shown in A – D, we calculated the cumulative number of total nucleated cells (proliferation) and CFCs (expansion) generated in culture during days 0–20 (E), and on day 30 (F). Cumulative cell numbers for MPCs correspond to those observed in cultures supplemented with M cytokine mix. Cumulative cell numbers for EPCs correspond to those observed in cultures supplemented with E cytokine mix.
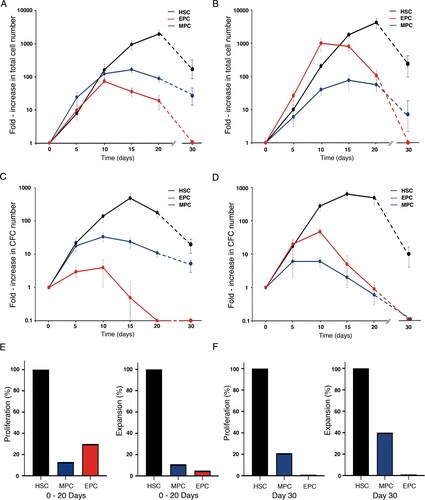
When MPCs were cultured in the presence of the M mix, they reached a 166-fold increase (at day 15) in total cell number, and by day 30, such a number corresponded to a 30-40-fold increase, as compared to day 0 (A). In the presence of the E mix, MPCs reached a 76-fold increase in total cell number (at day 15 of culture), and by day 30, their levels corresponded to an 8-fold increase, as compared to day 0 (B). Thus, it is clear that the growth of the MPC population was better under the M mix, as compared to the E mix. The cumulative number of total nucleated cells generated under the M mix on days 0–20, corresponded to 13% of the number generated in cultures of HSCs, whereas on day 30, the number of cells corresponded to 21% of the number in cultures of HSCs (E, F).
The proliferation kinetics of EPCs was also influenced by the cytokine mix used. In the presence of the M mix, they reached a 74-fold increase in total cell number by day 10 of culture (A); in contrast, in the presence of the E mix, they reached a 1000-fold increase, also on day 10 (B). It is noteworthy that by day 30, their total numbers reached undetectable levels under either cytokine combination (F). These results indicate that the in vitro growth of EPCs was better under the E mix, as compared to the M mix. The cumulative number of total nucleated cells generated under the E mix on days 0–20, corresponded to 30% of the number generated in cultures of HSCs (E).
Expansion kinetics of HSCs, MPCs, and EPCs
The expansion kinetics of the three cell populations was also assessed under both myeloid and erythroid cytokine combinations. HSCs showed large expansion potentials (as determined by the increase in the number of CFCs) in the presence of both cytokine combinations (C and D). Similar to their proliferation potential, the increment of CFC was higher in the presence of the E mix (626-fold increase, at day 15), as compared to the one observed under the M mix (491-fold increase, at day 15). At day 30 of culture, a 10–20-fold increase in CFC numbers was still observed under both conditions. A clear predominance of myeloid colonies was observed in the presence of the M mix throughout the entire culture period; in fact, on days 20 and 30, only myeloid colonies were observed (). Interestingly, in the presence of the E mix, a predominance of erythroid colonies was observed only during the first 5 days of culture; afterwards, a predominance of small myeloid colonies was observed ().
Table 2. Types of hematopoietic colonies generated in cultures from hematopoietic stem and progenitor cells.
When cultured under the M mix, MPCs reached a 34-fold increase in CFC numbers on day 10 of culture (C). Such numbers dropped during the following days and by day 30, their levels corresponded to an 8-fold increase, as compared to day 0. As expected, during the entire culture period, only myeloid colonies were observed (). In the presence of E mix, CFC numbers reached their maximum level on day 5 (6-fold increase, as compared to day 0) and reached undetectable levels by day 30 of culture (D). No erythroid colonies were observed throughout the culture period (). The cumulative number of CFCs generated under M mix on days 0–20, corresponded to 11% of the number generated in cultures of HSCs, whereas on day 30, the number of cells corresponded to 40% of the number in cultures of HSCs (E, F).
EPCs showed only a modest expansion potential when cultured in M mix, with a 4-fold increase by day 10 of culture, and reaching undetectable levels by day 20 (C). Interestingly, at day 5 of culture, almost 30% of the progenitors capable of forming colonies in semisolid cultures gave rise to small myeloid colonies (). When cultured in the presence of E mix, EPCs reached a 47-fold increase in CFC numbers, by day 10 of culture (D). After 30 days, no CFCs were detected (F). As expected, on days 5 and 20, a predominance of erythroid colonies was observed (). The cumulative number of CFCs generated under E mix on days 0–20 corresponded to 5% of the number generated in cultures of HSCs (E).
Discussion
It has been recognized that the hierarchy within the hematopoietic system is more dynamic than previously thought, and that the HSC and HPC compartments are more heterogeneous than previously considered [Citation4,Citation5,Citation22–29]. It is also clear that within such a complexity, HSCs coexist with numerous HPCs subtypes that possess variable proliferation and differentiation potentials [Citation1,Citation4,Citation5]. Today, the transcriptional and functional properties of such primitive hematopoietic cell populations are still not completely understood. In trying to contribute to our knowledge on this issue, in the present study we analyzed the global gene expression profiles of UCB-derived HSCs, MPCs and EPCs, and assessed their in vitro proliferation and expansion kinetics under different cytokine combinations.
Within the HSC population, cells capable of giving rise to myeloid, erythroid and mixed colonies were detected. Interestingly, in the MPC population a small fraction of CFCs gave rise to erythroid colonies; similarly, within the EPC population, some myeloid colonies were observed. These findings are consistent with a recent report indicating that in many cases, the subpopulations of UCB-derived CD34+ cells conventionally accepted as lineage-restricted, contained cells able to generate progeny of other lineages [Citation30].
As expected, the transcriptional profile of HSCs was clearly different from the ones of MPCs and EPCs. In this regard, it is noteworthy that between HSCs and MPCs only 66 genes were differentially expressed, whereas between HSCs and EPCs, 407 genes were differentially expressed. Between MPCs and EPCs, 371 differentially expressed genes were identified. These observations indicate that, in transcriptional terms, HSCs are more closely related to MPCs than to EPCs. Recent reports suggest that progenitor cells committed to the Erythroid/Megakaryocytic lineage derive directly from long-term HSCs very early in the hematopoietic hierarchy, whereas myeloid progenitors derive from short-term HSCs and multipotent progenitors in a more gradual way [Citation31]. Furthermore, some authors have suggested that the myeloid transcriptional program may be the default program throughout the hematopoietic multipotent hierarchy [Citation32]. Thus, it is possible that the HSC population obtained in our study contains a mixture of long- and short-term HSCs all of which may show a myeloid transcriptional program.
In keeping with the above notion and our own results, it has been reported that when the transcriptional profile of CD34+ cells was compared to those of myeloid (myeloblasts) and erythroid (erythroblasts) precursor cells, 47 genes were differentially expressed between CD34+ cells and myeloblasts, in contrast to 492 genes between CD34+ cells and erythroblasts [Citation33]. Interestingly, many of the genes preferentially expressed in myeloblasts (e.g. genes involved in inflammatory response) or erythroblasts (e.g. genes involved in heme biosynthesis and erythrocyte antigens) [Citation34] were not found among the most represented genes observed in MPCs or EPCs (this study). This observation correlates with the more immature stage of the two progenitor cell populations analyzed herein, as compared to morphologically recognizable precursor cells.
Evidence has been presented indicating that increased expression of GATA2 and TAL1 is involved in the transition from HSCs to erythroid progenitors [Citation35]. In this regard, it is noteworthy that in our study, we found increased levels of GATA2 and TAL1 in EPCs. Interestingly, several genes involved in T and B cell development and function were upregulated in MPCs. In our study, we defined MPCs as CD34+ CD38+ CD45RA+ CD71- Lin- cells; however, we did not include any lymphoid antigen in the selection strategy. It has been shown that common lymphoid progenitors (CLPs) also express the CD34+ CD38+ CD45RA+ Lin- immunophenotype [Citation34]; thus, it is possible that the population we identified as MPCs may also include CLPs.
Not all HPC types possess the same intrinsic proliferation and expansion potentials [Citation36]. Furthermore, their growth is highly influenced by their microenvironment, both in vivo and in vitro [Citation11,Citation15,Citation17]. In our culture system, HSCs showed the largest proliferation and expansion potentials, as compared to both MPCs and EPCs. This was evident throughout the first 20 days of culture, and on day 30. Such a result was expected considering the primitiveness and self-renewal capacity of HSCs. Interestingly, on days 5–20, HSCs proliferation and, to a lesser extent, expansion were higher in the presence of the E mix as compared to their growth under the M mix. EPO has been shown to be a strong proliferation inducer for EPCs and erythroblasts under both, steady state and stress conditions [Citation37]; thus, considering the significant presence of erythroid-CFCs within the HSC population, it seems reasonable to suggest that EPO could be responsible for the extraordinary increment in the total number of nucleated cells in cultures of HSCs. It is noteworthy, however, that on day 30, the numbers of total nucleated cells and CFCs under M mix and E mix were similar. This seems to be due to the fact that after 30 days of culture, erythroid cells were practically absent in cultures of HSCs and only myeloid-committed cells were still present; thus, the presence of EPO in the culture medium became irrelevant.
As expected, on days 5–20, EPCs showed higher proliferation and expansion potentials in the presence of the E mix, whereas proliferation and expansion of MPCs were higher in the presence of M mix. Proliferation of EPCs under the E mix was significantly higher than the proliferation shown by MPCs under the M mix. It has been previously shown, at the single-cell level, that an early erythroid progenitor produces more cells in vitro than an early myeloid progenitor [Citation36]. Thus, the results of the present study, at the population level, are in keeping with such an observation. High expression of proliferation-related genes (genes involved in cell cycle and mitosis) seems to be one of the reasons for the increased proliferation capacity of EPCs. These cells, however, showed a very limited expansion potential, and such a population was exhausted after 20 days of culture, reaching undetectable levels in total cell numbers and CFCs by day 30. In contrast, significant levels of nucleated cells were still observed in MPC cultures at day 30, even under E mix. Of note, CFCs at day 30 were observed only in cultures supplemented with M mix.
A recent report demonstrated that increased expression of the NF-kB signaling pathway in murine HSCs induces an erythroid transcription program (erythroid signature) and results in bone marrow failure [Citation38]. It has also been shown that increased expression of Gata1 – a gene directly regulated by NF-kB [Citation39]- in HSCs results in loss of self-renewal capacity [Citation40]. Furthermore, it has been shown that genes involved in metabolic stress, such as heat-shock proteins (hsp), are usually upregulated in proliferating cells that are prone to differentiation and exhaustion [Citation41]. Our results are in keeping with these reports, since we observed that Gata1, Gata2, DNAJC9 (hsp40) and Klf1, as well as the NF-kB pathway, were upregulated in EPCs, and that such cells showed a reduced expansion potential and became exhausted after 20 days of culture.
The fact that on day 30 of culture, only cultures initiated with HSCs or MPCs were still active maybe related to the similar transcriptional signatures of these two cell populations. It is clear, however, that within the HSC population there is an erythroid-lineage component that is absent/negligible in MPCs. Such a component seems to be responsible for some of the functional differences between both cell populations. Our results indicate that long-term hematopoiesis correlated with the expansion potential of each cell population rather than their proliferation potential. It has been shown that in aplastic anemia, E progenitors and HSCs reach undetectable levels, whereas the myeloid progenitor pool can continue to persist [Citation31]. It has also been shown that M progenitors can be sustained long-term in a murine in vivo model, even without contribution from HSCs [Citation24,Citation25]. Thus, it will be important to determine the molecular elements – intrinsic and extrinsic- that give MPCs the capacity to persist, both in vitro and in vivo, after long periods of time.
In summary, our results indicate that the transcriptional profile of HSCs is more similar to the one of MPCs than to the one of EPCs. Among such three cell populations, HSCs showed the largest proliferation and expansion capacities. When comparing the two progenitor cell types, EPCs showed the largest proliferation potential, whereas MPCs showed the largest expansion potential. After 30 days, only cultures initiated with HSCs and MPCs were sustained, which may be related to the similarities in their gene expression profiles. Proliferation and expansion of HSCs and EPCs were always higher in E mix, whereas the growth of MPCs was higher under the M mix. Our results may be relevant in the development of ex vivo systems for the expansion of hematopoietic cells for clinical application.
Ethics approval
This study was registered and approved by the Ethics Committee of the Coordinación de Investigación en Salud del Instituto Mexicano del Seguro Social (registration number R-2012-785-063).
Availability of data/material
Data generated/analyzed in this study are included in this published article. All genomic data were uploaded in GEO (ID: GSE107497).
Consent to participate
All cord blood samples used in this study were obtained after informed consent from the donors, as established by the Ethics Committee of the Coordinación de Investigación en Salud del Instituto Mexicano del Seguro Social.
Consent for publication
All authors have read and approved the final version of the manuscript.
Author’s contributions
Roberto Dircio-Maldonado: Conception and design, collection and assembly of data, data analysis and interpretation, manuscript writing, final approval. Rosario Castro-Oropeza: Collection and assembly of data, data analysis and interpretation, manuscript writing, final approval. Patricia Flores-Guzman: Collection and assembly of data, data analysis and interpretation, final approval. Alberto Cedro-Tanda: Collection and assembly of data, final approval. Fredy Omar Beltran-Anaya: Collection and assembly of data, final approval. Alfredo Hidalgo-Miranda: Data analysis and interpretation, financial support, final approval. Hector Mayani: Conception and design, financial support, data analysis and interpretation, manuscript writing, final approval.
Supplemental Material
Download JPEG Image (1.1 MB)
Supplemental Material
Download JPEG Image (1.1 MB)
Acknowledgements
We would like to thank Mr. Luis Enrique Torres-Galeana and Mr. Ignacio Valencia-Plata for excellent technical assistance. We would also like to thank the staff at the Flow Cytometry Core Facility (Coordinacion de Investigacion en Salud, IMSS) for their technical assistance and support.
Disclosure statement
No potential conflict of interest was reported by the author(s).
Additional information
Funding
Related Research Data
References
- Doulatov S, Notta F, Laurenti E, et al. Hematopoiesis: a human perspective. Cell Stem Cell. 2012;10:120–136.
- Dzierzak E, Bigas A. Blood development: hematopoietic stem cell dependence and independence. Cell Stem Cell. 2018;22:639–651.
- Metcalf D. The regulatory control of hemopoietic populations. Prog Clin Biol Res. 1990;356:147–154.
- Eaves CJ. Hematopoietic stem cells: concepts, definitions and the new reality. Blood. 2015;125:2605–2613.
- Mayani H. The regulation of hematopoietic stem cell populations. F1000Res. 2016;5:1524.
- Orkin SH, Zon LI. Hematopoiesis: an evolving paradigm for stem cell biology. Cell. 2008;132:631–644.
- Mansson R, Hultquist A, Luc S, et al. Molecular evidence for hierarchical transcriptional lineage priming in fetal and adult stem cells and multipotent progenitors. Immunity. 2007;26:407–419.
- Báez A, Martín-Antonio B, Piruat JI, et al. Gene and miRNA expression profiles of hematopoietic progenitor cells vary depending on their origin. Biol Blood Marrow Transplant. 2014;20:630–639.
- Mayani H, Guilbert LJ, Janowska-Wieczorek A. Biology of the hemopoietic microenvironment. Eur J Haematol. 1992; 49:225–233.
- Morrison SJ, Scadden DT. The bone marrow niche for haematopoietic stem cells. Nature. 2014;505:327–334.
- Pinho S, Frenette PS. Haematopoietic stem cell activity and interactions with the niche. Nat Rev Mol Cell Biol 2019. doi. 10.1038/s41580-019-0103-9.
- Metcalf D. Hematopoietic cytokines. Blood. 2008;111:485–491.
- Szilvassy SJ. Early-acting hematopoietic growth factors: biology and clinical experience. Cancer Treat Res. 2011;157:11–31.
- Kaimakis P, Crisan M, Dzierzak E. The biochemistry of hematopoietic stem cell development. Biochim Biophys Acta. 2013;1830:2395–2403.
- Douay L. Experimental culture conditions are critical for ex vivo expansion of hematopoietic cells. J Hematother Stem Cell Res. 2001;10:341–346.
- Dahlberg A, Delaney C, Bernstein ID. Ex vivo expansion of human hematopoietic stem and progenitor cells. Blood. 2011;117:6083–6090.
- Flores-Guzman P, Fernandez-Sanchez V, Mayani H. Concise review: Ex vivo expansion of cord blood-derived hematopoietic stem and progenitor cells: basic principles, experimental approaches, and impact in regenerative medicine. Stem Cells Trans Med. 2013;2:830–838.
- Dircio-Maldonado R, Flores-Guzmán P, Corral-Navarro J, et al. Functional integrity and gene expression profiles of human cord blood-derived hematopoietic stem and progenitor cells generated in vitro. Stem Cells Trans Med. 2018;7:602–614.
- Fernández-Sánchez V, Pelayo R, Flores-Guzmán P, et al. In vitro effects of stromal cells expressing different levels of Jagged-1 and Delta-1 on the growth of primitive and intermediate CD34+ cell subsets from human cord blood. Blood Cells Mol Dis. 2011;47:205–213.
- Wognum AW, Eaves AC, Thomas TE. Identification and isolation of hematopoietic stem cells. Arch Med Res. 2003;34:461–475.
- Mayani H, Dragowska W, Lansdorp PM. Characterization of functionally distinct subpopulations of CD34+ cord blood cells in serum-free long-term cultures supplemented with hematopoietic cytokines. Blood. 1993;82:2664–2672.
- Ema H, Morita Y, Suda T. Heterogeneity and hierarchy of hematopoietic stem cells. Exp Hematol. 2014;42:74–82.
- Yokota T. “Hierarchy” and “Holocracy”; a paradigm of the hematopoietic system. Cells. 2019;8:1138.
- Sun J, Ramos A, Chapman B, et al. Clonal dynamics of native hematopoiesis. Nature. 2014;514:322–327.
- Busch K, Klapproth K, Barile M, et al. Fundamental properties of unperturbed haematopoiesis from stem cells in vivo. Nature. 2015;518:542–546.
- Scala S, Aiuti A. In vivo dynamics of human hematopoietic stem cells: novel concepts and future directions. Blood Adv. 2019;3:1916–1924.
- Bast L, Buck MC, Hecker JS, et al. Computational modeling of stem and progenitor cell kinetics identifies plausible hematopoietic lineage hierarchies. iScience. 2021;24:102120.
- Yamamoto R, Wilkinson A, Nakauchi H. Changing concepts in hematopoietic stem cells. Science. 2018;362:895–896.
- Pellin D, Loperfido M, Baricordi C, et al. A comprehensive single cell transcriptional landscape of human hematopoietic progenitors. Nat Commun. 2019;10(1):2395.
- Knapp DJHF, Hammond CA, Wang F, et al. A topological view of human CD34 + cell state trajectories from integrated single-cell output and proteomic data. Blood. 2019;133:927–939.
- Notta F, Zandi S, Takayama N, et al. Distinct routes of lineage development reshape the human blood hierarchy across ontogeny. Science. 2016;351:2116.
- Mansson R, Hultquist A, Luc S, et al. Molecular evidence for hierarchical transcriptional lineage priming in fetal and adult stem cells and multipotent progenitors. Immunity. 2007;26:407–419.
- Ferrari F, Bortoluzzi S, Coppe A, et al. Genomic expression during human myelopoiesis. BMC Genomics. 2007;8:264.
- Chen L, Kostadima M, Martens JHA, et al. Transcriptional diversity during lineage commitment of human blood progenitors. Science. 2014;345:1251033.
- Thoms JAI, Truong P, Subramanian S, et al. Disruption of a GATA2-TAL1-ERG regulatory circuit promotes erythroid transition in healthy and leukemic stem cells. Blood. 2021;138:1441–1455.
- Mayani H, Lansdorp PM. Proliferation of individual hematopoietic progenitors purified from umbilical cord blood. Exp Hematol. 1995;23:1453–1462.
- Socolovsky M. Molecular insights into stress erythropoiesis. Curr Opin Hematol. 2007;14:215–224.
- Nakagawa MM, Rathinam CV. Constitutive activation of the canonical NF-kB pathway leads to bone marrow failure and induction of erythroid signature in hematopoietic stem cells. Cell Rep. 2018;25:2094–2909.
- Corn RA, Hunter C, Liou HC, et al. Opposing roles for RelB and Bcl3 in regulation of T-box expressed in T cells, GATA3, and Th effector differentiation. J Immunol. 2005;175:2102–2110.
- Ferreira R, Wai A, Shimizu R, et al. Dynamic regulation of gata factor levels is more important than their identity. Blood. 2007;109:5481–5490.
- Araki D, Fu JF, Huntsman H, et al. NOTCH-mediated ex vivo expansion of human hematopoietic stem and progenitor cells by culture under hypoxia. Stem Cell Rep. 2021;16:2336–2350.