
ABSTRACT
Objectives
To investigate the performance of H22954, a novel long non-coding RNA (lncRNA), in inhibiting glucose uptake in leukemia cells.
Methods
18F-FDG uptake, RNA half-life quantitative real-time polymerase chain reaction (qRT-PCR) and luciferase assays were performed to detect the glucose uptake in the condition of leukemia. Microarrays and qRT-PCR analyses were used to identify the related genes or proteins and elucidate the underlying these processes.
Results
H22954, a novel lncRNA, inhibited glucose uptake in leukemia cells. Using bioinformatics and microarray analyses, GLUT10 was identified as a possible target molecule of H22954. H22954 targeted the 3′untranslated region of GLUT10. In the luciferase assay, the luciferase activity of pGL3-GLUT10 was inhibited by H22954. Consistently, H22954 expression levels were inversely correlated with GLUT10 expression in cell lines and acute myeloid leukemia (AML) samples. Conversely, the degradation rate of GLUT10 mRNA was increased after H22954 overexpression. Moreover, glucose uptake was recovered when the GLUT10-interaction sites in H22954 were mutated.
Conclusion
The lncRNA H22954 regulated GLUT10 expression to inhibit glucose uptake in leukemia cells. Our findings provide potentially valuable data for designing new targeted strategies based on H22954.
Introduction
Energy metabolism is reprogramed during tumor development [Citation1]. Glycolysis is boosted in solid tumor cells, even in the presence of oxygen, as shown by increased levels of glucose intake and lactic acid product [Citation2,Citation3]. Similarly, glycolysis is also enhanced in leukemia cells. Glucose transporters, such as GLUT, can be activated to increase the transport of glucose into the cytoplasm [Citation4–9].
Our previous research proved that as a novel lncRNA, H22954 could inhibit the growth, promote the differentiation, and induce the apoptosis in leukemia cells [Citation10]. In this study, we found that in leukemia cells, H22954 could inhibit glucose uptake in a GLUT10-dependent mechanism.
Materials and methods
AML patient samples
The study was approved by the Ethics Committee of the First Affiliated Hospital of Soochow University and conducted in accordance with the Helsinki Declaration. After obtaining written informed consent was provided, bone marrow samples were obtained from the patients. For subsequent studies, bone marrow mononuclear cells (BMNCs) were isolated by Ficoll density gradient centrifugation [Citation11].
Cell culture
K562, NB4, and SHI-I cells were provided by the American Type Culture Collection, and cultured in RPMI-1640 medium with 10% fetal bovine serum (FBS) at 37°C in humidified incubators [Citation12].
RT–PCR and plasmid constructs
pcDNA3.0-based plasmids were used to overexpress H22954. After RNAs were isolated from BMNCs or cell lines, H22954 was amplified by RT-PCR, and plasmids were constructed as previously reported [Citation10]. Lentivirus (pLKO.1-based plasmid) was used for H22954 knockdown. We designed small hairpin RNA (shRNA) according to its siRNA sequence, and packed shRNA into the lentivirus to knockdown H22954. shRNA sequences were F: CCGGGGAGGCAAAGAGCG-ACCTTACCTCGAGGTAAGGTCGCTCTTTGCCTCCTTTTTG; R: AATTCAAAAAGGAGGC-AAAGAGCGACCTTACCTCGAGGTAAGGTCGCTCTTTGCCTCC. Total RNAs from BMNCs or cell lines were isolated, treated with RNase-free DNase, and used to prepare cDNAs. qRT-PCR was performed to amplify H22954 mRNA with the forward primer: GGG AGC TTG GAC ATG AAT TTA AA; and reverse primer: act GGT CTC AAA CTC CTG ATC TCA; probe: FAM-TGG CTC ATG CCT GTA ATC CCA GCA-TAMRA. Primer for ABL F: GAT ACG AAG GGA GGG TGT ACC A; R: CTC GGC CAG GGT GTT GAA; probe: FAM-TGC TTC TGA TGG CAA GCT CTA CGT CTC CT-TAMRA.
Gene expression microarray analysis
Sample preparation and microarray procedures were performed according to the Affymetrix protocols. Total RNAs were extracted from K562 cells with or without H22954 overexpression using TRIzol reagents (Invitrogen, Carlsbad, CA, USA). RNAs were hybridized to Affymetrix U133A Plus 2.0 Arrays (Santa Clara, CA, USA). Data were normalized using a quantile regression algorithm. Limma R package was used to select differentially expressed genes with >2-fold change and p-value < 0.05. Hierarchical clustering was used to visualize the differentially expressed genes identified by Limma [Citation10].
Cell transfection and Western blotting
As described previously, the cells were transfected with plasmids using Lipofectamine 2000 according to the manufacturer's instructions (Invitrogen). After 48 h, cell lysates were prepared by using RIPA buffer containing protease inhibitors (Beyotime, China). Proteins were analyzed by Western blotting [Citation13]. GLUT10 antibody and ß-actin antibody were purchased from Cell Signaling Technology (CST, Danvers, MA, USA).
qRT-PCR assay for RNA degradation
The cells were harvested at 0, 0.5, and 1 h after treatment with actinomycin D (5 μg/ml) (Sigma-Aldrich, Saint Louis, MO, USA). RNA was collected, and qRT-PCR was performed. The proportion of GLUT10 RNA at a given point of time was standardized to the amount of GLUT10 RNA at time 0. The degradation rate was calculated as the slope of the semi-logarithmic plot of the RNA over time.
18F-FDG Uptake assay
A total of 1.95 ml of sugar-free RPMI 1640 culture medium was added to the cells for 12 h. Then, 3.7 kBq (50 μl) 18F-FDG was added to these cultured cells and incubated at 37°C for 100 min. The cells were harvested to measure counts per minute (CPM) in cells (B) and CPM in the supernatant (F). The uptake rate of 18F-FDG (%) was calculated as B/(B + F) × 100%. Cell radioactivity was normalized using total protein concentration determined with Pierce BCA Kit (Thermo Fisher Scientific, Waltham, MA, USA). All experiments were repeated thrice [Citation14].
Luciferase assay
K562 cells were transfected with 0.8 μg of H22954 plasmid or control vector together with 1.2 μg of luciferase reporter vector. 50 ng of pRLTK plasmid (Promega, Madison, WI, USA) was used to normalize the transfection efficiency in each experiment. Luciferase activity was measured using the dual-luciferase reporter assay (Promega) [Citation10].
Statistical analyses
All data were analyzed using SPSS16 software and presented as mean values ± the standard error of the mean. Statistical significance was set as p < .05.
Results
H22954 regulated the glycolysis in leukemia cells
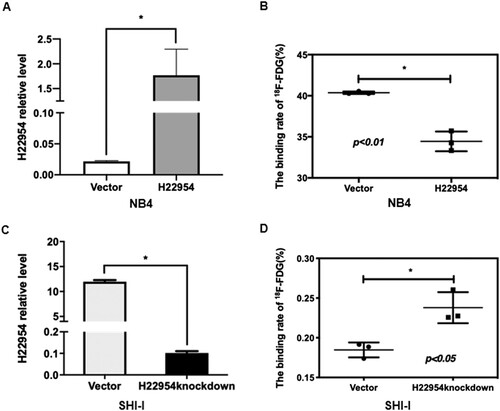
Our previous study showed that the expression of H22954 mRNA was lower in K562 and NB4 cells, but higher in SHI-1 cell line. To determine whether H22954 regulated glycolysis, we first measured lactic acid production and glucose intake in K562 cells with H22954 overexpression ((A)). Lactic acid production was lower in K562 cells with H22954 overexpression ((B)). Given that glucose intake can indicate the production of lactic acid, we tested the ability of leukemia cells to take in glucose. H22954 overexpression decreased 1⁸F-FDG uptake in both K562 ((C)) and NB4 cells ((A,B)); 1⁸F-FDG uptake was enhanced when H22954 was knocked down in SHI-1 cells ((C,D)). These results suggested that H22954 regulated the glycolysis and glucose transport in leukemia cells.
Figure 1. H22954 regulated the glycolysis in leukemia cells. (A) H22954 mRNA expressions in K562 cells stably transfected with the H22954-expressing plasmid vector were analyzed by qRT-PCR. (B) GC/MS analysis of lactic acid in the culture medium of K562 cells stably transfected with the H22954-expressing plasmid vector. Fold change meaning culture medium/uncultured medium. (C) 18F-FDG uptake assay showed that the glucose uptake in K562 cell lines with or without H22954-expressing plasmid.
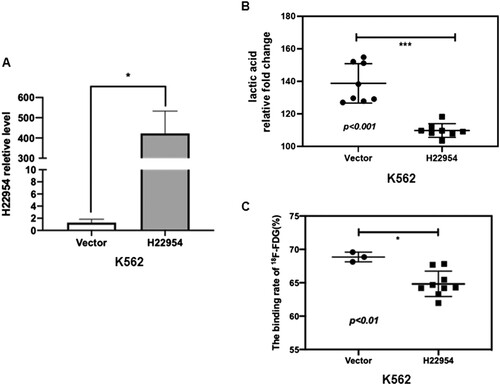
Figure 2. H22954 regulated the glucose uptake in NB4 and SHI-I cell lines. (A) H22954 mRNA expressions in NB4 cell lines stably transfected with the H22954-expressing plasmid vector were analyzed by qRT-PCR. (B) 18F-FDG uptake assay showed that the glucose uptake in K562 cell lines with or without H22954 overexpressing plasmid. (C) H22954 mRNA expressions in SHI-I cells with H22954 knockdown or control were analyzed by qRT-PCR. (D) 18F-FDG uptake assay showed that the glucose uptake in SHI-I cell lines with or without H22954 knockdown.
H22954 regulated GLUT10 expression
To understand how H22954 inhibits glucose uptake, we compared the gene expression profiles in stable K562 cells with or without H22954 overexpression. In the microarray analysis, most genes in the glucose transporter family were similarly expressed. However, the expression of GLUT10 showed >2-fold change in K562 cells without H22954 overexpression, according to that in the control group ((A)). QRT-PCR showed that GLUT1 and GLUT3 expression increased (Supplement Figure S1), whereas GLUT10 expression decreased in K562 cells when H22954 was overexpressed ((B)). In SHI-1 cells, GLUT10 expression increased when H22954 was knocked down ((C)). Western blotting assay also confirmed these results ((B)).
Figure 3. H22954 regulated the GLUT10 expression. (A) Hierarchical clustering of glucose transporter family genes expressed in individual K562 cells with the H22954-expressing plasmid or a vector. An individual sample was represented in each column and each row as a gene in the microarray. (B) GLUT10 mRNA expression in K562 cells with the H22954-expressing plasmid or a vector was analyzed by qRT-PCR. (C) GLUT10 mRNA expression in SHI-I cells with or without H22954 knockdown was analyzed by qRT-PCR. H22954 (D) and GLUT10 (E) mRNA levels in BMNCs from non-malignant controls (NMC) and newly diagnosed and untreated AML patients of M2 subtype were analyzed by qRT-PCR. The data were from the nonparametric analysis. All p values were <.05 vs. NC.
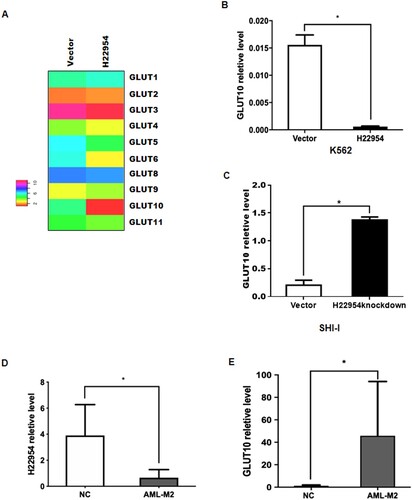
H22954 and GLUT10 mRNA levels in BMNCs from nine newly diagnosed and untreated AML-M2 patients (Supplement table) were also examined and compared with those in 10 patients with non-malignant hematological diseases. Similar to the results observed in cells, higher GLUT10 and lower H22954 mRNA levels were detected in BMNCs of M2 patients ((D)).
All these data showed that H22954 regulated GLUT10 expression to inhibit glucose uptake.
H22954 accelerated GLUT10 mRNA degradation
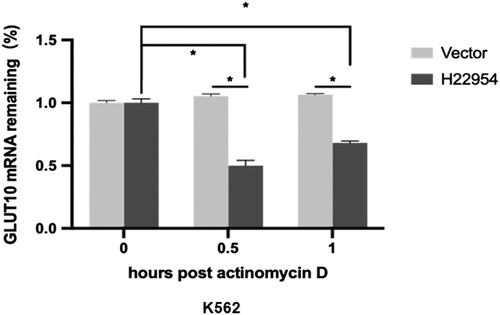
To determine how H22954 down-regulated GLUT10 expression, we tested the degradation rate of GLUT10 mRNA in K562 cells with or without H22954 overexpression. We first used actinomycin D to inhibit new RNA synthesis, then measured GLUT10 mRNA levels at different points of time. The results showed that GLUT10 mRNA was less degraded at 0.5 and 1 h after the addition of actinomycin D to the control cells. In K562 cells overexpressing H22954, approximately 50% of the GLUT10 mRNA was degraded. Although it may be due to a decrease in actinomycin D inhibition efficiency, GLUT10 mRNA increased slightly at 1 h compared to that at 0.5 h. We hypothesized that H22954 could accelerate GLUT10 mRNA degradation and inhibit GLUT10 expression ().
Figure 4. H22954 accelerated the GLUT10 mRNA degradation. H22954-expressing plasmids or a vector were transiently transfected into K562 cell lines. After 24 h, actinomycin D (5 μg/ml) were added. Total RNA was isolated at different time points. GLUT10 mRNA levels were analyzed by qRT-PCR and relative levels vs. at time 0 were calculated (n = 3).
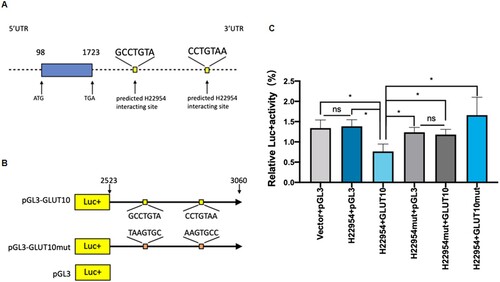
H22954 interacted with GLUT10 3′UTR
Some lncRNAs interact with 3′UTRs to regulate gene expression. In bioinformatics analysis, the TargetScanHuman database has shown that the nucleotide ‘GCCTGTA’ and ‘CCTGTAA’ sequences in GLUT10 3′UTR may be targeted by H22954 ((A)). To test this hypothesis, GLUT10 3′UTR fragments were inserted into the pGL3 vectors with luciferase activity ((B)). Additionally, pGL3 vectors alone or with a mutated H22954-targeted sequence in the GLUT10 3′UTR (pGL3-GLUT10mut) were used as controls ((B)). We also constructed another control in K562 cells, in which the target sequence in the GLUT10 3′UTR of H22954 was mutated (pcDNA3-H22954mut). In K562 cells, the luciferase activity of the pGL3-GLUT10 3′UTR plasmid was inhibited after co-transfection with the H22954 plasmid, but did not change after co-transfection with the vector and pGL3-GLUT10mut plasmids ((C)). Luciferase activity was unaffected by co-transfection with H22954 m and pGL3-GLUT10 3′UTR, ((C)). These results indicated out that H22954 interacted with the 3′UTR of GLUT10 to inhibit its expression.
Figure 5. H22954 interacted with GLUT10 3′UTR. (A) Diagram of a H22954-targeting sequence in GLUT10 3′UTR. (B) Illustration of pGL3 plasmids with the luciferase (Luc) reporter gene and a mutant (pGL3-GLUT10 m) GLUT10 3′UTR sequence or a wild-type (pGL3-GLUT10). (C) Relative Luc activity in K562 cells transfected with pGL3-derived plasmids. p < .05 by Student's t-test (n = 3).
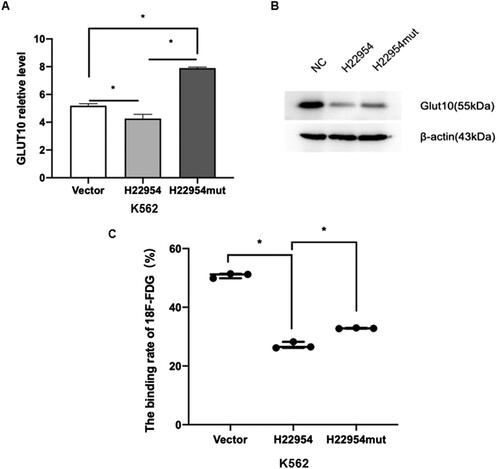
Blocking the interaction between H22954 and GLUT10 recovered the glucose uptake in leukemia cells
To verify that H22954 affected glucose uptake by inhibiting GLUT10 expression, the K562 cell line with transiently highly expressed H22954mut was constructed. Other interaction sites might also be present, the expression level of GLUT10 was recovered only partly when the interaction sites of H22954 were mutated, compared with that of unmutated transient cell lines in qRT-PCR and Western blot assays ((A,B)). Consistently, the 18F-FDG uptake assay showed that the glucose uptake was increased in the transient H22954mut cell line, compared to that in the transient H22954 cell line ((C)).
Figure 6. Blocking the interaction between H22954 and GLUT10 recovered glucose uptake in leukemia cells. (A) GLUT10 mRNA expression in K562 cells with the H22954-expressing plasmid, control vector, or H22954mut, which interact sites with GLUT10 mutant were analyzed by qRT-PCR. (B) Western blot analysis of GLUT10 expression in K562 cells with the H22954-expressing plasmid, control vector, or H22954mut, which interact sites with GLUT10 mutant. (C) 18F-FDG uptake assay showed that the glucose uptake in K562 cell lines with or without H22954-expressing plasmid and H22954mut which interact sites with GLUT10 mutant.
Discussion
Energy metabolism is reprogramed in cancer cells [Citation1]. Even in the presence of oxygen, glycolysis is potentiated to fuel the growth and division of cancer cells [Citation2,Citation3]. However, the efficiency of ATP production was 18-fold lower under ‘aerobic glycolysis’ than that under mitochondrial oxidative phosphorylation in cancer cells [Citation1]. To overcome this problem, cancer cells must employ more transporters to transport glucose into the cytoplasm [Citation1]. Therefore, the level of FDG increases in these cells, accompanied by high lactate secretion [Citation1,Citation14].
Although 1⁸F-FDG can enter the cell via transporter and be phosphorylated by hexokinase, it cannot be recognized by fructose-1-phosphate kinase and thus remains un-catalyzed in the cytoplasm. Therefore, the glucose uptake level of cells can be indicated by the 1⁸F-FDG level, which can be detected according to γ photons emitted after 1⁸F annihilation radiation [Citation14,Citation15].
Glucose uptake and glycolysis are enhanced in leukemia patients. Reducing the expression of glucose transporters has been considered as an effective way to inhibit glycolysis [Citation4–7]. There are 14 members of the glucose transporter family that play a vital role in maintaining energy metabolism [Citation8]. Studies have shown that when AML cells grow rapidly and external glucose cannot provide cells sufficient energy, glucose uptake is stoked up by GLUT in leukemia cells, such as GLUT1 and GLUT5 [Citation4,Citation5,Citation9].
As a novel lncRNA, H22954 inhibited the development and progression of AML both in vitro and in vivo. In the present study, we found that lactic acid production was inhibited in K562 cells culture medium with H22954 overexpression, resulting in lower glucose uptake in these cells. Similar results were observed in NB4 cells. In SHI-I cells, supportive results were also observed when H22954 was knocked down. According to the qRT-PCR results, the expression of pyruvate kinase M (PKM) and lactate dehydrogenase A (LDHA), two key molecules in aerobic glycolysis [Citation16,Citation17], showed no significant or consistent changes in K562 or SHI-I cells with H22954 overexpression or knockdown (Supplement Figure S2), implying that H22954 regulated ‘aerobic glycolysis’ in leukemia cells depends on glucose uptake.
What is the molecular mechanism by which H22954 inhibits glucose uptake? Most lncRNAs interact with 3′UTRs to regulate gene expression [Citation10]. In bioinformatics and microarray analyses, GLUT10 was identified as a possible target of H22954. The luciferase activity was inhibited after co-transfection of H22954 with pGL3 constructs containing a GLUT10 3′UTR sequence, supporting that H22954 interacts with GLUT10 3′UTR to regulate GLUT10 expression. Consistently, H22954 expression levels were inversely correlated with GLUT10 expression in cell lines and AML samples. Conversely, when H22954 was overexpressed, the GLUT10 mRNA degradation was accelerated. Moreover, glucose uptake was recovered when the interaction sites in H22954 were mutated.
Conclusion
In summary, lncRNA H22954 blocked GLUT10 expression to inhibit glucose uptake in leukemia cells. Our findings provide potentially valuable data for designing new targeted strategies based on H22954.
Supplemental Material
Download MS Word (16.2 KB)Supplemental Material
Download TIFF Image (70.6 KB)Supplemental Material
Download TIFF Image (76.1 KB)Acknowledgements
The authors thank Dr. Shuyu Zhang for the gift of the pGL3 vector and Dr. Yang Jiao for support.
Disclosure statement
No potential conflict of interest was reported by the author(s).
Additional information
Funding
Related Research Data
References
- Hanahan D, Weinberg RA. Hallmarks of cancer: the next generation. Cell. 2011;144(5):646–674.
- Warburg O. On the origin of cancer cells. Science. 1956;123(3191):309–314.
- Warburg O. On respiratory impairment in cancer cells. Science. 1956;124(3215):269–270.
- Chen WL, Wang YY, Zhao A, et al. Enhanced fructose utilization mediated by SLC2A5 is a unique metabolic feature of acute myeloid leukemia with therapeutic potential. Cancer Cell. 2016;30(5):779–791.
- Song K, Li M, Xu X, et al. Resistance to chemotherapy is associated with altered glucose metabolism in acute myeloid leukemia. Oncol Lett. 2016;12(1):334–342.
- Chen WL, Wang JH, Zhao AH, et al. A distinct glucose metabolism signature of acute myeloid leukemia with prognostic value. Blood. 2014;124(10):1645–1654.
- Wang JH, Chen WL, Li JM, et al. Prognostic significance of 2-hydroxyglutarate levels in acute myeloid leukemia in China. Proc Natl Acad Sci U S A. 2013;110(42):17017–17022.
- Hulleman E, Kazemier KM, Holleman A, et al. Inhibition of glycolysis modulates prednisolone resistance in acute lymphoblastic leukemia cells. Blood. 2009;113(9):2014–2021.
- Tilekar K, Upadhyay N, Hess JD, et al. Structure guided design and synthesis of furyl thiazolidinedione derivatives as inhibitors of GLUT 1 and GLUT 4, and evaluation of their anti-leukemic potential. Eur J Med Chem. 2020;202:112603.
- Qi X, Jiao Y, Cheng C, et al. H22954, a novel long non-coding RNA down-regulated in AML, inhibits cancer growth in a BCL-2-dependent mechanism. Cancer Lett. 2019;454:26–36.
- Qi X, Chen Z, Liu D, et al. Expression of Dlk1 gene in myelodysplastic syndrome determined by microarray, and its effects on leukemia cells. Int J Mol Med. 2008;22(1):61–68.
- Qi X, Jiang J, Zhu M, et al. Human corin isoforms with different cytoplasmic tails that alter cell surface targeting. J Biol Chem. 2011;286(23):20963–20969.
- Ye B, Zhou Y, Liu Y, et al. Pulsatilla saponin A induces apoptosis and differentiation of myeloma cells. Anticancer Agents Med Chem. 2021;21(7):919–926.
- Wang ZX, Zhang B, Deng SM, et al. Early evaluation for treatment efficacy of 5-fluorouracil and hyperthermia on HCT-116 colon cancer cells by fluorine-18-fluorodeoxyglucose uptake. Chin Med J (Engl). 2012;125(4):657–661.
- Zhang LF, Lou JT, Lu MH, et al. Suppression of miR-199a maturation by HuR is crucial for hypoxia-induced glycolytic switch in hepatocellular carcinoma. EMBO J. 2015;34(21):2671–2685.
- Lan Z, Yao X, Sun K, et al. The interaction between lncRNA SNHG6 and hnRNPA1 contributes to the growth of colorectal cancer by enhancing aerobic glycolysis through the regulation of alternative splicing of PKM. Front Oncol. 2020;10:363.
- Wang C, Li Y, Yan S, et al. Interactome analysis reveals that lncRNA HULC promotes aerobic glycolysis through LDHA and PKM2. Nat Commun. 2020;11(1):3162.