
ABSTRACT
Objective
T cell dysfunction is a common characteristic of patients with myeloid leukemia and is closely related to clinical efficacy and prognosis. In order to clarify the mechanisms leading to the T cell dysfunction, we characterized the gene expression profile of T cells from chronic myelogenous leukemia (CML) patients by microarray analysis and investigated the related regulating pathway.
Methods
We employed gene expression profiling, bioinformatics and real-time quantitative reverse transcription PCR (RT-qPCR) to detect genes differentially expressed in CML patients versus healthy donors.
Results
There were 1704 genes differentially expressed between CD3+ T cells from CML patients and healthy donors, including 868 up-regulated genes and 836 down-regulated genes, which mostly related to T cell functional pathways. In particular, lower expression of NFATC1, a member of the TCR signaling pathway, was detected in CD3+ T cells from CML patients. We further found that the expression of IRF4 and BACH2, transcription factors that potentially regulate NFATC1, in CD3+ T cells from CML patients was significantly lower than that in healthy donors.
Conclusion
We for the first time observed the altered gene expression profiles of CD3+ T cells from CML patients, and the results suggested that IRF4, BACH2 and NFATC1 may be involved in regulating T cell dysfunction in CML patients in the form of a transcriptional regulatory network. These findings may provide potential targets for tyrosine kinase inhibitors in combination with other targeted immunotherapies .
Introduction
Chronic myelogenous leukemia (CML) is a common leukemia that is characterized by the BCR-ABL fusion protein in adults [Citation1]. Although tyrosine kinase inhibitor (TKI) targeted therapy is beneficial for most CML patients in the chronic phase, there is a portion of patients who have primary TKI resistance or TKI-induced ABL gene mutations as well as disease progression in the blast phase. Thus, new avenues for improving this therapeutic strategy are needed [Citation2–5]. Effective therapy for such CML patients includes hematopoietic stem cell transplantation (HSCT), including allogenic-HSCT and haploidentical-HSCT; however, its application is limited for older patients [Citation6,Citation7]. Thus, exploration of novel therapeutic approaches such as immunotherapy in combination with TKIs is necessary for CML patients.
T cell immunity is an important component for maintaining anti-tumor and antivirus capability in the body; however, T cell immune deficiency is common in patients with tumors and viral infections. In recent years, anti-programmed death receptor (PD-1) [Citation8] and chimeric antigen receptor T (CAR-T) cell [Citation9–15] have significantly improved clinical outcome for lymphoma and leukemia patients in clinical trials. T cell immunotherapy has become an important method for tumor treatment. Our team and others have found that T cell dysfunction is a common characteristic of CML patients and that it is closely related to disease status, prognosis, and TKI treatment effects [Citation6,Citation16–19]. Based on abnormalities in molecules related to the T cell receptor (TCR) signaling pathway in T cells, such as CD3ζ and ZAP70, regulation of these molecules could only partially restore T cell function [Citation20–23]. Thus, further investigation of the mechanism underlying T cell dysfunction is needed to determine the regulatory approach and to enhance T cells against leukemia.
Nuclear factor of activated T cells (NFAT), a critical transcription factor of TCR signaling pathway, is involved in the regulation of T cell activation, differentiation and dysfunction [Citation24–27]. While we also found that expression of NFATC1 was reduced in T cells from CML patients by gene expression profiling in this study. However, the reason for down-regulation of NFATC1 in T cells from CML patients remains unclear. Therefore, in this study, we focused on analyzing the differential gene expression and related signaling pathway changes in T cells from CML patients and healthy donors.
Materials and methods
Sample preparation
Peripheral blood from three newly diagnosed patients with de novo CML (DN-CML) and four healthy individuals (HIs) was collected for gene expression profiling analysis. In order to verify the result of differentially expressed genes, peripheral blood from 15 DN-CML patients and 19 HIs were collected for RT-qPCR. Both the gene expression profiling analysis and the RT-qPCR used RNA as genetic material. There was no significant difference in age between DN-CML patients and healthy donors (p = 0.088). The diagnostic criteria for DN-CML patients included in this study were in accordance with the 2016 WHO diagnostic criteria [Citation28]. Samples were obtained in the Hematology Department, First Affiliated Hospital of Jinan University. Ethical approval was obtained from the Ethics Committee of the First Affiliated Hospital of Jinan University (20170302), and informed consent was provided by the patients and healthy donors. The clinical information of CML patients and healthy donors was provided in Supplementary Table 1.
CD3+ T cell sorting
Mononuclear cells were isolated from peripheral blood by Ficoll-Hypaque gradient centrifugation. The enrichment of CD3+ T cells was performed with CD3 MicroBeads (130-050-101, Miltenyibiotec) as previously described [Citation29,Citation30].
Gene expression profiling
CD3+ T cell RNA was used to perform global gene expression profile analysis using the Affymetrix HG U133 Plus 2.0 GeneChip (Shanghai Biochip Co., Ltd., Shanghai, China). An Affymetrix GeneChip® Scanner 3000 was used for raw data scanning.
RT-qPCR
Total RNA was prepared using TRIzol (15596018, Invitrogen, Theimo Fisher Scientific) reagent and then used for cDNA synthesis using the High-Capacity cDNA Reverse Transcription Kit (4368813, ABI, Thermo Fisher Scientific) according to the manufacturer’s instructions. RT-qPCR analysis was performed using SuperReal PreMix Plus (SYBR Green) (FP207 TIANGEN) according to the manufacturer’s protocol. Each reaction was performed in a final volume of 20 μL containing 1 μL of the cDNA, 0.5 μL of each primer, and 10 μL 2×SYBR Green PCR Master Mix. The amplification profile was denaturation at 95°C for 15 min, followed by 40 cycles of 95°C for 10 s, 60°C for 20 s, and 72°C for 20 s. At the end of the RT-qPCR cycles, melting curve analyses were performed as well as electrophoresis of the products on 1.5% agarose gels in order to validate the specific generation of the expected RT-qPCR product [Citation31]. ACTB was used as an internal control for NFATC1, NFATC2, NFATC3, IRF4 and BACH2. ΔCt was employed to evaluate the gene expression. The oligonucleotide sequences are provided in Supplementary Table 2.
Statistical analysis
R (version 4.0.4) was used for statistical analysis and graphics in this study. Raw data were read and normalized by the RMA method in the ‘Affy’ package. Differential gene expression analysis was performed with the ‘limma’ R package. Genes with a p-value less than 0.05 and fold change greater than 1.5 or less than −1.5 were regarded differentially expressed and further examined by Kyoto Encyclopedia of Genes and Genomes (KEGG) and Gene Ontology (GO) enrichment analysis using the ‘clusterProfiler’ package. The packages ‘GOplot’, ‘ggplot2’, and ‘pheatmap’ were used to plot images. Protein–Protein Interaction (PPI) analysis was performed with the ‘STRINGdb’ R package. Packages ‘Affy’, ‘clusterProfiler’, ‘limma’ and ‘STRINGdb’ were downloaded from Bioconductor(http://bioconductor.org/). Packages ‘GOplot’, ‘ggolot2’ and ‘pheatmap’ were downloaded from CRAN (https://cran.r-project.org/). Comparison of the gene expression levels in the DN-CML and HI groups was performed by the Mann–Whitney U test, and p < 0.05 was regarded as statistically significant. The potential transcriptional regulators of NFATC1 were predicted using hTFtarget database (http://bioinfo.life.hust.edu.cn/hTFtarget/#!/).
Results
Significantly altered expression of functionally related genes in T cells from CML patients
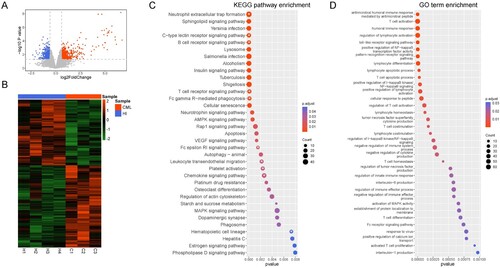
To further clarify the potential regulatory mechanisms leading to specific T cell clonal dysfunction, we collected peripheral blood CD3+ T cells from three chronic CML patients and four healthy donors for microarray analysis. There were 1704 differentially expressed genes (DEGs) when comparing CD3+ T cells from CML patients with healthy donor T cells, including 868 up-regulated genes and 836 down-regulated genes ((A, B)). We then performed KEGG signaling ((C)) and biological process (GO-BP) analysis ((D)) for enriched pathways using the DEGs. We found that several immune-related KEGG pathways are enriched in CML CD3+ T cells (marked by asterisks), including the T cell receptor signaling pathway. In addition, there were seven GO-BPs related to T cell function that were altered, including T cell activation, proliferation, differentiation, co-stimulation, apoptosis, T cell homeostasis, and T cell activated regulation.
Figure 1. Gene differentially expressed in T cells from CML patients and healthy donors. (A) The different gene expression profiles. Differentially expressed genes were selected based on a FC >1.5 or a FC <−1.5 with a p < 0.05. Red: Up-regulated genes; Blue: Down-regulated genes; Gray: other genes. The ‘limma' R package was used for analysis. (B) Heatmap of differentially expressed genes between CML patients and healthy donors. (C) KEGG signaling pathway enrichment analysis. White asterisks: Signaling pathways related to T cells. The ‘clusterProfiler' R package was used for analysis. (D) GO enrichment analysis. The ‘clusterProfiler' R package was used for analysis. The R (version 4.0.4) was used for analysis and graphics in this figure.
Down-regulated NFATC1 expression in the TCR signaling pathway in CD3+ T cells from CML patients
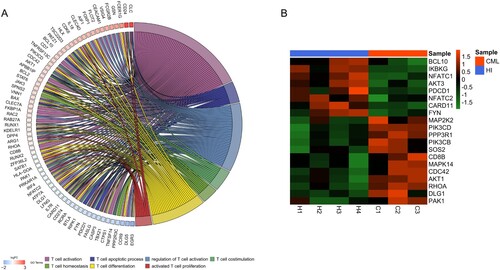
A total of 68 DEGs which were involved in regulating these T cell biological pathways were revealed ((A)). In this study, we mainly focused on the genes enriched in the TCR signaling pathway which is one of the important signaling pathways in regulating T cell function ((B)). There were 20 DEGs involved in regulation of the TCR signaling pathway, and these included NFATC1 (p < 0.05, FC = 1.644), a key transcription factor relatively close to downstream of the TCR signaling pathway, which was down-regulated.
Figure 2. The different genes associated with T cell function in CD3+ T cells from CML patients and healthy donors. (A) The relationship between the different genes and T cell biological behaviors. The ‘GOplot' R package was used for graphics. (B) Heatmap of different genes related to the TCR signaling pathway. The R (version 4.0.4) was used for graphics in this figure.
Decreased expression of IRF4- and BACH2-mediated regulation of NFATC1 in CD3+ T cells from CML patients
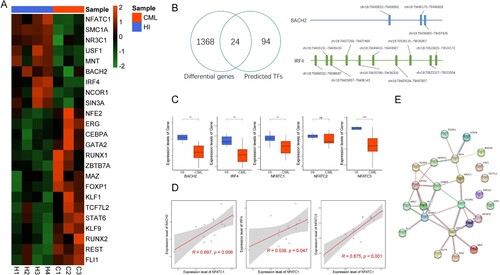
To determine potential reasons for NFATC1 down-regulation in T cells from CML patients. We compared the results which predicted by hTFtarget database with the DEGs identified by microarray analysis. As shown in (A,B), there were 24 potential transcriptional regulators of NFATC1 that were altered. We next analyzed the correlation between the 24 transcription factors and NFATC1 (Figure S1). The results demonstrated that 21 transcription factors correlated with NFATC1, including eight genes that were positively correlated and thirteen genes that were negatively correlated. It has been reported that BTB domain and CNC homolog 2 (BACH2) [Citation32–34] and interferon regulating factor 4 (IRF4) [Citation35,Citation36] are involved in regulating T cell function. It has been reported that NFAT family members NFATC1, NFATC2, and NFATC3 are also expressed in T cells and participate in the regulation of T cell function [Citation37–40]. Thus, we examined the expression level of BACH2, IRF4, NFATC1, NFATC2, and NFATC3 in the CD3+ T cells from CML patients and healthy donors. As shown in (C), the expression of BACH2 (p < 0.01), IRF4 (p < 0.01), NFATC1 (p < 0.01), and NFATC3 (p < 0.001) in CML patient T cells was significantly lower than that in healthy donors. We further analyzed the correlation between these genes and NFATC1, and the results demonstrated that the expression of IRF4 (R = 0.538, p = 0.047), BACH2 (R = 0.697, p = 0.006) and NFATC3 (R = 0.875, p < 0.001) were positively correlated with NFATC1 ((D)). The PPI analysis also shown that there was an interaction between NFATC1 and IRF4, while BACH2 shown an interaction with IRF4 ((E)).
Figure 3. Expression of transcription factors that potentially regulate NFATC1 in CD3+ T cells from CML patients and healthy donors. (A) The expression of 24 transcription factors that may regulate NFATC1 in CML patients and healthy donors. (B) Left: Screening strategy for the 24 potential transcription factors; Right: The predicted genomic positions of the BACH2 and IRF4 that regulate NFATC1. (C) RT-qPCR results for BACH2, IRF4, NFATC1, NFATC2, NFATC3. Mean of two normally distributed variables was compared by independent samples Student’s test. The results are graphing the standard deviation. ** p < 0.01, **** p < 0.001. (D) Correlations between IRF4, NFATC3, BACH2 and NFATC1 from RT-qPCR results. The Pearson’s Correlation was used to analyze the linear relationship between each gene. (E) The interaction of NFATC1, IRF4 and BACH2 that is analyzed by PPI analysis. The R (version 4.0.4) was used for analysis and graphics in this figure.
Discussion
As important members of the immune system, T cells mainly play the role of scavenging and killing infected target or tumor cells. Thus, whether the function of T cells is sound is closely related to the immune status and prognosis of tumor patients. In our previous studies, we found that there were specific anti-leukemia T cell clones in myeloid leukemia patients, but these clones were defective in activation, differentiation, proliferation, and immune function; thus, these clones are unable to exert anti-leukemia effects [Citation16,Citation18,Citation20–23,Citation41]. The TCR signaling pathway is the first signaling pathways in T cells that exerts immune functions. Previous studies from our group have shown that CD3ζ and ZAP70, which are important molecules in the TCR signaling pathway, are down-regulated in CD3+ T cells in CML patients [Citation21,Citation42,Citation43]. However, the mechanism underlying T cell dysfunction in myeloid leukemia patients is still not clear. To understand the mechanism of T cell dysfunction in this study, we performed gene expression profiling analysis and found that the expression of NFATC1, which is a key transcription factor in the TCR signaling pathway, was significantly reduced in CD3+ T cells from CML patients. The NFAT family consists of five members: NFATC1 (also known as NFATc or NFAT2), NFATC2 (also known as NFATp or NFAT1), NFATC3 (also known as NFATx or NFAT4), NFATC4 (also known as NFAT3), and NFAT5 (also known as TonEBP or OREBP). T cells mainly express NFATC1, NFATC2, and NFATC3, and these molecules are important transcription factors involved in the regulation of T cell function [Citation38]. NFATC1 is an important member of the NFAT family, and its classical signaling involves TCR and co-stimulatory signal activation. Research in mice has shown that NFATC1/2 deletion causes a decrease in T cell cytokine secretion [Citation37], T cell dysfunction, exhaustion, and self-tolerance [Citation26,Citation44]. Recently, it has been found that NFATC1 and NFATC2 are involved in regulating the formation of the memory and effector CD8+ T cell subsets in mice [Citation45,Citation46]. Earlier studies have found that NFATC1, NFATC2, and NFATC3 regulate the expression of IL-4 and IFN-γ in mouse CD4+ T cells, thus affecting the differentiation of Th1 and Th2 cells [Citation38,Citation47–49]. These studies demonstrated the important role of the NFAT family in regulating the activation, differentiation, and immune function of mouse T cells. Recently, we also demonstrated that NFATC1 is necessary for normal human CD8+ T cell immune function [Citation30]. Based on the above, down-regulation of NFATC1 may be related to the dysfunction of CD3+ T cells in CML patients.
Therefore, we further explored potential reasons for down-regulation of NFATC1 in CML patient T cells and found that the expression of SMC1A (structural maintenance of chromosomes 1 A), NR3C1 (nuclear receptor subfamily 3 group C member 1), USF1 (upstream transcription factor 1), MNT (MAX network transcription repressor), BACH2, IRF4, NCOR1 (nuclear receptor corepressor 1), and SIN3A (SIN3 transcription regulator family member A) i.e. transcription factors that may potentially regulate NFATC1, was decreased in CML patient T cells. Among these transcription factors, IRF4 [Citation35,Citation36] and BACH2 [Citation32–34]. have been widely studied and are closely related to T cell function.
The IRF transcription factor family consists of nine members, IRF1 to IRF9. This family plays an important role in regulating innate and adaptive immune responses and tumorigenesis. IRF4 is closely related to IRF8 and was initially identified as a nuclear factor [Citation50]. This protein plays an important role in the differentiation and functional regulation of CD4+ and CD8+ T cells [Citation51]. In mice, Irf4 is necessary for the protective effects of CD8+ T cells during infection [Citation35]. A recent study has further shown that IRF4 is an important regulatory factor in the formation of CD8+ memory T cells, and it is necessary for the effective reactivation of CD8+ T cells [Citation36]. Moreover, the results predicted by hTFtarget database shown that IRF4 may regulate the expression of NFATC1, while our recent results have also demonstrated that NFATC1 is necessary for human CD8+ T cells to perform their normal immune function [Citation30]. These results suggested that T cell dysfunction in CML patients may be associated with the reduced expression of IRF4 and NFATC1.
In addition, we found that BACH2, another transcription factor that potentially regulates NFATC1, was decreased in CML patient T cells. Although the PPI analysis result showed that there was no direct interaction between BACH2 and NFATC1, the RT-qPCR results in this study showed that BACH2 expression was positively correlated with NFATC1. One study has shown that up-regulating BACH2 can inhibit the program of terminal exhaustion molecules via transcriptional repression and epigenetic silencing [Citation34]. These data suggested that down-regulation of BACH2 may be also related to T cell dysfunction in CML patients. Interestingly, our previous results have shown that the distribution of memory T cells in CML patients was skewed from naïve and central memory T cells to effector memory and effector T cells [Citation52], in addition, we also found that there was an increased percentage of CD8+ T cell subset among the CD3+ T cell population in CML patients (Unpublished data). All of these alternations seem that the adaptive immune reaction was activated in CML patients, however, the current finding suggested that in the level of genetic, key transcription factors which response for activation, protective function, and inhibition of exhaustion of T cells were down-regulated. Further research needs to understand the clear molecular mechanisms behind these changes more deeply.
Conclusion
In summary, we found that the expression of IRF4 and BACH2, potential transcription factors that regulate NFATC1, are significantly down-regulated in CML patient T cells, and the expression of IRF4 and BACH2 are positively correlated with NFATC1. These preliminary results suggest that decreased expression of IRF4 and BACH2 may be potential factors leading to the down-regulation of NFATC1 in CML patient T cells. These findings will deepen our understanding of T cell dysfunction in CML patients and provide potential targets for CML immunotherapy.
Supplemental Material
Download MS Word (18.3 KB)Supplemental Material
Download MS Word (36.5 KB)Supplemental Material
Download MS Word (15.8 KB)Supplemental Material
Download JPEG Image (1.8 MB)
Disclosure statement
No potential conflict of interest was reported by the author(s).
Data availability statement
The data that support the findings of this study are available from the corresponding author upon reasonable request.
Additional information
Funding
Related Research Data
References
- Chopra R, Pu QQ, Elefanty AG. Biology of BCR-ABL. Blood Rev. 1999;13(4):211–229.
- Druker BJ. Activity of a specific inhibitor of the BCR-ABL tyrosine kinase in the blast crisis of chronic myeloid leukemia and acute lymphoblastic leukemia with the Philadelphia chromosome. N Engl J Med. 2001;344(14):1038–1042.
- Marin D, Milojkovic D, Olavarria E, et al. European LeukemiaNet criteria for failure or suboptimal response reliably identify patients with CML in early chronic phase treated with imatinib whose eventual outcome is poor. Blood. 2008;112(12):4437–4444.
- Jangamreddy JR, Panigrahi S, Lotfi K, et al. Mapping of apoptin-interaction with BCR-ABL1, and development of apoptin-based targeted therapy. Oncotarget. 2014;5(16):7198–7211.
- Liu Z, Shi Y, Yan Z, et al. Impact of anemia on the outcomes of chronic phase chronic myeloid leukemia in TKI era. Hematology. 2020;25(1):181–185.
- Hehlmann R, Hochhous A, Baccarani M, et al. Chronic myeloid leukaemia. Lancet. 2007;370(9584):342–350.
- Xu L, Chen H, Chen J, et al. The consensus on indications, conditioning regimen, and donor selection of allogeneic hematopoietic cell transplantation for hematological diseases in China-recommendations from the Chinese Society of Hematology. J Hematol Oncol. 2018;11(1):33.
- Tumeh PC, Harview CL, Yearley JH, et al. PD-1 blockade induces responses by inhibiting adaptive immune resistance. Nature. 2014;515(7528):568–571.
- Brudno JN, Somerville RPT, Shi V, et al. Allogeneic T cells that express an anti-CD19 chimeric antigen receptor induce remissions of B-cell malignancies that progress after allogeneic hematopoietic stem-cell transplantation without causing graft-versus-host disease. J Clin Oncol. 2016;34(10):1112–1121.
- Wang H, Kaur G, Sankin AI, et al. Immune checkpoint blockade and CAR-T cell therapy in hematologic malignancies. J Hematol Oncol. 2019;12:59.
- Zhao JJ, Song YP, Liu DL. Clinical trials of dual-target CAR T cells, donor-derived CAR T cells, and universal CAR T cells for acute lymphoid leukemia. J Hematol Oncol. 2019;12:17.
- Zhao Q. Novel chimeric antigen receptor T cells based on T-cell receptor-like antibodies. Blood Sci. 2019;1(2):144–147.
- Zhao R, Cui Y, Li S, et al. Current status and hurdles for CAR-T cell immune therapy. Blood Sci. 2019;1(2):148–155.
- Taefehshokr N, Baradaran B, Baghbanzadeh A, et al. Promising approaches in cancer immunotherapy. Immunobiology. 2020;225(2):151875.
- Zhang H, Zhao P, Huang H. Engineering better chimeric antigen receptor T cells. Exp Hematol Oncol. 2020;9(1):34.
- Li YQ, Yang LJ, Chen SH, et al. T cell receptor V beta repertoire usage and clonal expansion of T cells in chronic myelogenous leukemia. Chin Med J. 2004;117(6):840–843.
- Rohon P, Porkka K, Mustjoki S. Immunoprofiling of patients with chronic myeloid leukemia at diagnosis and during tyrosine kinase inhibitor therapy. Eur J Haematol. 2010;85(5):387–398.
- Zha X, Chen S, Yang L, et al. Characterization of the CDR3 structure of the Vbeta21T cell clone in patients with P210(BCR-ABL)-positive chronic myeloid leukemia and B-cell acute lymphoblastic leukemia. Hum Immunol. 2011;72(10):798–804.
- Yao DL, Xu L, Tan JX, et al. Re-balance of memory T cell subsets in peripheral blood from patients with CML after TKI treatment. Oncotarget. 2017;8(47):81852–81859.
- Li YQ, Geng SX, Yin QS, et al. Decreased level of recent thymic emigrants in CD4+ and CD8+ T cells from CML patients. J Transl Med. 2010;8:47.
- Chen SH, Zha XF, Shi L, et al. Upregulated TCR zeta improves cytokine secretion in T cells from patients with AML. J Hematol Oncol. 2015;8:72.
- Xu L, Lu YH, Lai J, et al. Characteristics of the TCR V beta repertoire in imatinib-resistant chronic myeloid leukemia patients with ABL mutations. Sci China-Life Sci. 2015;58(12):1276–1281.
- Zha XF, Xu L, Chen SH, et al. Generation of V alpha 13/beta 21(+)T cell specific target CML cells by TCR gene transfer. Oncotarget. 2016;7(51):84246–84257.
- Gao R, Zhang Y, Zeng C, et al. The role of NFAT in the pathogenesis and targeted therapy of hematological malignancies. Eur J Pharmacol. 2022;921:174889.
- Hogan PG. Calcium-NFAT transcriptional signalling in T cell activation and T cell exhaustion. Cell Calcium. 2017;63:66–69.
- Schietinger A, Greenberg PD. Tolerance and exhaustion: defining mechanisms of T cell dysfunction. Trends Immunol. 2014;35(2):51–60.
- Martinez GJ, Pereira RM, Äijö T, et al. The transcription factor NFAT promotes exhaustion of activated CD8+ T cells. Immunity. 2015;42(2):265–278.
- Arber DA, Orazi A, Hasserjian R, et al. The 2016 revision to the World Health Organization classification of myeloid neoplasms and acute leukemia. Blood. 2016;127(20):2391–2405.
- Zhang Y, Xu L, Chen S, et al. Identification of TCR V11-2-D1-J1-1T cell clone specific for WT1 peptides using high-throughput TCR gene sequencing. Biomark Res. 2019;7:12.
- Zhang Y, Wu J, Zeng C, et al. The role of NFAT2/miR-20a-5p signaling pathway in the regulation of CD8 naïve T cells activation and differentiation. Immunobiology. 2021;226(4):152111.
- Wu Y, Hu Y, Yu X, et al. TAL1 mediates imatinib-induced CML cell apoptosis via the PTEN/PI3 K/AKT pathway. Biochem Biophys Res Commun. 2019;519(2):234–239.
- Tsukumo S-i, Unno M, Muto A, et al. Bach2 maintains T cells in a naive state by suppressing effector memory-related genes. Proc Natl Acad Sci U S A. 2013;110(26):10735–10740.
- Roychoudhuri R, Clever D, Li P, et al. BACH2 regulates CD8(+) T cell differentiation by controlling access of AP-1 factors to enhancers. Nat Immunol. 2016;17(7):851–860.
- Yao C, Lou G, Sun H-W, et al. BACH2 enforces the transcriptional and epigenetic programs of stem-like CD8T cells. Nat Immunol. 2021;22(3):370–380.
- Raczkowski F, Ritter J, Heesch K, et al. The transcription factor interferon regulatory factor 4 is required for the generation of protective effector CD8+ T cells. Proc Natl Acad Sci U S A. 2013;110(37):15019–15024.
- Harberts A, Schmidt C, Schmid J, et al. Interferon regulatory factor 4 controls effector functions of CD8 memory T cells. Proc Natl Acad Sci U S A. 2021;118(16):e2014553118.
- Peng SL, Gerth AJ, Ranger AM, et al. NFATc1 and NFATc2 together control both T and B cell activation and differentiation. Immunity. 2001;14(1):13–20.
- Macian F. NFAT proteins: key regulators of T-cell development and function. Nat Rev Immunol. 2005;5(6):472–484.
- Koch S, Reppert S, Finotto S. NFATc1 deletion in T lymphocytes inhibits the allergic trait in a murine model of asthma. Clin Exp Allergy. 2015;45(8):1356–1366.
- Klein-Hessling S, Rudolf R, Muhammad K, et al. A threshold level of NFATc1 activity facilitates thymocyte differentiation and opposes notch-driven leukaemia development. Nat Commun. 2016;7:11841.
- Li Y, Geng S, Du X, et al. Restricted TRBV repertoire in CD4 + and CD8+ T-cell subsets from CML patients. Hematology. 2011;16(1):43–49.
- Zha X, Chen S, Yang L, et al. Upregulated TCRζ enhances interleukin-2 production in T-cells from patients with CML. DNA Cell Biol. 2012;31(11):1628–1635.
- Zha X, Yan X, Shen Q, et al. Alternative expression of TCRζ related genes in patients with chronic myeloid leukemia. J Hematol Oncol. 2012;5:74.
- Martinez GJ, Pereira RM, Aijo T, et al. The transcription factor NFAT promotes exhaustion of activated CD8(+) T cells. Immunity. 2015;42(2):265–278.
- Klein-Hessling S, Muhammad K, Klein M, et al. NFATc1 controls the cytotoxicity of CD8(+) T cells. Nat Commun. 2017;8:511.
- Xu TH, Keller A, Martinez GJ. NFAT1 and NFAT2 differentially regulate CTL differentiation upon acute viral infection. Front Immunol. 2019;10:184.
- Kiani A, Viola JP, Lichtman AH, et al. Down-regulation of IL-4 gene transcription and control of Th2 cell differentiation by a mechanism involving NFAT1. Immunity. 1997;7(6):849–860.
- Porter CM, Clipstone NA. Sustained NFAT signaling promotes a Th1-like pattern of gene expression in primary murine CD4(+) T cells. J Immunol. 2002;168(10):4936–4945.
- Rengarajan J, Tang B, Glimcher LH. NFATc2 and NFATc3 regulate T(H)2 differentiation and modulate TCR-responsiveness of naive T-H cells. Nat Immunol. 2002;3(1):48–54.
- Huber M, Lohoff M. IRF4 at the crossroads of effector T-cell fate decision. Eur J Immunol. 2014;44(7):1886–1895.
- Nam S, Lim JS. Essential role of interferon regulatory factor 4 (IRF4) in immune cell development. Arch Pharm Res. 2016;39(11):1548–1555.
- Yao D, Xu L, Tan J, et al. Re-balance of memory T cell subsets in peripheral blood from patients with CML after TKI treatment. Oncotarget. 2017;8(47):81852–81859.