
ABSTRACT
Introduction
Myelodysplastic syndromes (MDS) predominantly present with varying degrees of cytopenia, while myelodysplastic syndromes/myeloproliferative neoplasms (MDS/MPN) exhibit proliferative features. Genetic defects underlying different complete blood count (CBC) alterations remain to be defined.
Objective
We aimed to evaluate mutations and impacts on abnormal blood counts in MDS and MDS/MPN.
Method
MDS and MDS/MPN patients were recruited and sequenced by targeted next-generation sequencing. Clinical parameters, especially CBC, were evaluated for the association with genetic abnormalities and clinical outcomes.
Results
A total of 168 patients with myeloid neoplasms were recruited (92 cases of low-risk MDS, 57 cases of high-risk MDS and 19 cases of MDS/MPN). Compared to low-risk MDS and MDS/MPN, patients with high-risk MDS were presented with more severe neutropenia with 17.5% showing absolute neutrophil counts (ANC) lower than 0.5 × 10⁹/L. Patients with MDS/MPN more commonly harboured mutations and had a higher number of mutations per case than low-risk MDS (94.7% vs. 56.5%; p < 0.001 and 3 vs. 1; p < 0.001, respectively). Patients with SF3B1 mutations showed lower haemoglobin levels than wild-type (7.9 vs. 8.4 g/dL, p = 0.02), but were associated with normal platelet counts (286 vs. 93 × 109/L; p < 0.001). Patients with U2AF1 mutations were associated with more severe leukopenia than wild-type (3 vs. 4.18 × 10⁹/L; p = 0.02). KRAS mutations were associated with monocytosis (p < 0.001). Multivariate analysis revealed high-risk MDS, MDS/MPN, severe neutropenia (ANC < 0.5 × 10⁹/L), and mutations in ASXL1 and SETBP1 were associated with inferior survival outcomes.
Conclusion
Certain mutations were related to more severe anaemia, lower white blood cell count or monocytosis in Asian MDS and MDS/MPN patients.
Introduction
Myelodysplastic syndromes (MDS) are clonal stem cell disorders characterized by dysplastic changes of haematopoietic cells resulting in peripheral blood cytopenia(s) and increased risk of leukemic transformation. Myelodysplastic syndromes/myeloproliferative neoplasms (MDS/MPN) are other closely related entities, of which proliferative features usually co-occur with dysplasia. Anaemia is the most common presentation that may be accompanied by varying degrees of neutropenia or thrombocytopenia. Isolated neutropenia or thrombocytopenia is rarely seen in MDS [Citation1]. Cytopenia especially anaemia and severe neutropenia (absolute neutrophil count < 0.5 × 10⁹/L) is the major abnormality significantly affecting survival and quality of life in patients with MDS and MDS/MPN [Citation2].
A great variety of genetic abnormalities underlying disease pathogenesis in MDS and MDS/MPN has been identified which sometimes are overlapped between these groups. Genetic pathways frequently mutated in myeloid neoplasms (MNs) include epigenetic regulation, RNA splicing machinery, transcriptional activation, and cell signalling [Citation3]. Genetic lesions in MNs shape the clinical phenotypes, disease evolution and survival outcomes [Citation4,Citation5]. Genotype-phenotypic correlations have been reported in MDS. Macrocytic anaemia, normal or high platelet counts and micromegakaryocyte in bone marrow predict the genetic alteration involving 5q deletion [Citation6]. Patients harbour isolated isochromosome 17q are likely to have anaemia, leukocytosis and thrombocytopenia, although not specific but these features are more frequent in this particular subgroup [Citation7].
Furthermore, genetic alterations in MDS also have a robust impact on disease prognostication. In a large cohort of 3,392 MDS patients, mutations in TP53, CBL, EZH2, RUNX1, ASXL1 and U2AF1 showed negative prognostic impacts when adjusted with revised international prognostic scoring system (R-IPSS) [Citation8], while ASXL1 mutations are well-known for worse survival in MDS/MPN [Citation9]. Gene mutations in different pathways cause diverse clinical manifestations. Correlations between cytopenia and gene mutations have been reported [Citation10]. However, most information has been examined from Western populations. We hypothesized that certain genetic alterations in MDS were related to variations in peripheral blood counts and different among ethnic groups. In this multicentre cohort study, we aimed to explore correlations between genetic abnormalities using targeted sequencing and the extent of cytopenia/cytosis in MDS and MDS/MPN among some groups of Asian population in Thailand.
Materials and methods
Patients and study design
We enrolled adult patients with MDS or MDS/MPN from January 2017 to June 2021. The four participating medical centres included King Chulalongkorn Memorial Hospital in Bangkok (central Thailand), Ramathibodi Hospital in Bangkok (central Thailand), Maharaj Nakorn Chiang Mai in Chiang Mai Province (northern Thailand), and Srinakarin Hospital in Khon Kaen Province (northeast Thailand). After review by both haematologists and haematopathologists at each participating centre, MDS and MDS/MPN were diagnosed by bone marrow aspiration and biopsy according to the WHO 2016 classification [Citation11]. Central pathology review was not performed.
All MDS patients were re-stratified according to the R-IPSS. Low-risk MDS was defined by a revised international prognostic scoring system (R-IPSS) score of 3.5 or lower, while patients with R-IPSS >3.5 were categorized as high-risk MDS [Citation12]. Therapy-related and secondary myeloid neoplasms were excluded for the difficulties to evaluate the effects of each mutation. We collected clinical information including baseline characteristics, R-IPSS score, MDS subtype, gene mutations, cytogenetic study, and survival outcomes. This study was approved by the Institutional Review Board, Faculty of Medicine, Chulalongkorn University, Bangkok, Thailand (IRB number 264/60).
Targeted next-generation sequencing
For targeted sequencing, DNA from bone marrow or peripheral blood was extracted using Gentra Puregene Blood Kits (Qiagen, Minneapolis, MN, USA). Sixty-four samples (38%) were processed and sequenced with an IONS5 sequencer using a customized 40-gene myeloid panel (Supplementary Table 1). Extracted DNA was prepared using the Ion Chef™ system. Variants were analysed using Ion Reporter™ software as previously described [Citation13]. One-hundred and four samples (62%) were processed and sequenced by QIAGEN GeneReader using a customized 141-gene myeloid panel (Supplementary Table 2). Variants were analysed using Ingenuity software as previously described [Citation14]. Selected variants were validated by conventional Sanger sequencing.
Statistical analysis
Continuous variables were described as medians and interquartile ranges. The Wilcoxon rank sum test was used for comparison of continuous data between two groups. Categorical parameters were reported as frequencies and percentages. The comparison of categorical data between groups was performed using the Chi-square or Fisher exact test as appropriate. Survival analysis was performed using a Kaplan-Meier estimate with log-rank comparison. Univariate and multivariate Cox regression analyses were performed to determine the risk factors for progression and mortality. Multivariate models were developed by adjusting for covariates with p < 0.1 in univariate models and stepwise backward logistic regression to select the final model. P-values lower than 0.05 were considered statistically significant. All statistical analyses were performed using STATA version 15.1.
Results
Patients’ characteristics and genetic abnormalities
One hundred sixty-eight patients with MDS and MDS/MPN were recruited. Of these 168 patients, 92 (55%) were categorized as low-risk MDS, 57 (34%) were high-risk MDS and 19 (11%) were MDS/MPN. Subtypes of MDS/MPN included 9 cases of CMML (chronic myelomonocytic leukaemia), 7 cases of MDS/MPN-U (MDS/MPN-unclassifiable), 2 cases of aCML (atypical chronic myeloid leukaemia) and 1 case of MDS/MPN with RARS-T (MDS/MPN with ring sideroblasts and thrombocytosis). The median age at the time of diagnosis and gender among pathologic subtypes were not statistically different.
At the time of diagnosis, the median white blood cell count (WBC) was higher in patients with MDS/MPN. High-risk MDS demonstrated more severe neutropenia (17.5% with ANC < 0.5 × 10⁹/L) (p = 0.002) and lower platelet counts (87 vs. 115.5 vs. 159 × 109/L; p = 0.03) than low-risk MDS and MDS/MPN. Haemoglobin levels were not statistically different among the 3 groups. Patients with MDS/MPN more commonly harboured mutations and had a higher number of mutations per case than low-risk MDS (94.7% vs. 56.5%; p < 0.001 and 3 vs. 1; p < 0.001, respectively) (). Low-risk MDS more commonly displayed normal karyotype than high-risk MDS and MDS/MPN (p = 0.02), while high-risk MDS frequently showed complex karyotypes ((A)).
Figure 1. Genetic abnormalities in myelodysplastic syndrome (MDS) and myelodysplastic syndrome/myeloproliferative neoplasms (MDS/MPN) in the study. (A) Cytogenetic study in low-risk MDS, high-risk MDS and MDS/MPN. (B) Frequency of somatic mutations in low-risk MDS, high-risk MDS and MDS/MPN. (C) Mutation landscape of patients with MDS and MDS/MPN.
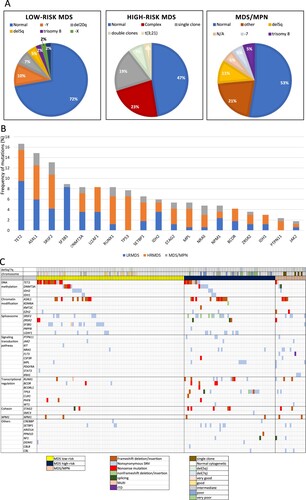
Table 1. Baseline characteristics of patients.
A total of 270 mutations from either or both of the 2 sequencers were detected in 119 cases (Supplementary Table 3). Overall, TET2 (16.7%) was the most frequent mutated gene followed by ASXL1 (14.9%) and SRSF2 (13.1%). In low-risk MDS, the most frequent mutations were TET2 mutations (17.4%), followed by SF3B1 (15.2%) and ASXL1 (10.9%) mutations. In high-risk MDS, ASXL1, SRSF2 and TP53 (19.3%) were most frequently mutated, followed by TET2 (17.5%) and RUNX1 (15.8%). In MDS/MPN, ASXL1 and SRSF2 (21%) were the most frequently mutated, followed by NRAS (15.8%) and RUNX1 (15.8%) ((B)). The mutational landscape of patients in our cohort is shown in (C).
Association between clinical characteristics, genetic abnormalities, and survival outcomes
Upon correlating mutations with complete blood count (CBC) abnormalities, SF3B1 mutations were associated with lower haemoglobin levels than wild-type SF3B1. In contrast, patients without SF3B1 mutations had lower median number of platelets than those with SF3B1 mutations. U2AF1 mutations were associated with lower WBC than wild-type U2AF1 (). Notably, patients with KRAS mutations were associated with monocytosis (absolute monocyte count ≥ 1 × 10⁹/L; p < 0.001 and p = 0.001).
Table 2. Association between SF3B1 and U2AF1 mutational status with haemoglobin, platelet, and white blood cell count levels.
In the univariate analysis, diagnosis of high-risk MDS, MDS/MPN, complex karyotypes, neutropenia (ANC < 1 × 10⁹/L), number of gene mutations (≥ 2 mutated genes) were associated with inferior overall survival (OS). In the multivariate analysis, patients with ANC lower than 0.5 × 10⁹/L showed a high mortality rate with an HR of 4.03 (95%CI 2.16-7.53; p < 0.001) (, Supplementary Figure 1). Patients with high-risk MDS and MDS/MPN exhibited worse OS than low-risk MDS (4-year OS of 18.5% in high-risk MDS, 21.1% in MDS/MPN and 53.7% in low-risk MDS, p < 0.001) ((A)). Overall, complex karyotype (≥ 3 abnormalities) was associated with worse OS than normal karyotype and other abnormalities (p = 0.005) ((B)). Patients with more than 2 mutations were associated with a higher mortality rate with a HR of 2.6 (95% CI 1.24–5.47, p = 0.01). More mutations resulted in a more negative impact on survival ((C)). When analysing effects of gene mutations, mutations in ASXL1, RUNX1, SRSF2, TP53, SETBP1 and STAG2 were significantly associated with higher mortality in the univariate analysis ((A–F)). Only ASXL1 and SETBP1 mutations remained significantly associated with worse OS in the multivariate analysis (HR 1.75, 95% CI 1.03–2.99; p = 0.04) and (HR 2.33, 95% CI 1.11–4.87; p = 0.03).
Figure 2. Factors associated with overall survival rates. (A) Survival rates in low-risk MDS, high-risk MDS and MDS/MPN. (B) Survival rates of patients with normal, abnormal, and complex karyotypes. (C) Survival rates of patients with increasing numbers of mutations.
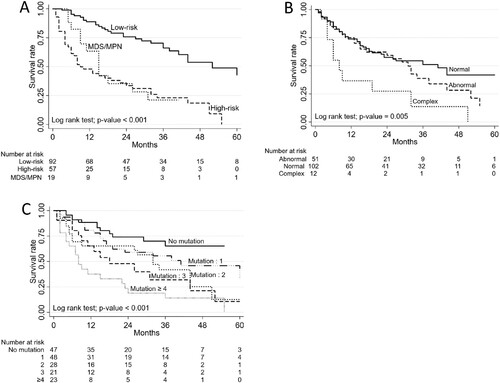
Figure 3. Association of somatic mutations and overall survival rates using univariate analysis. (A) ASXL1, (B) RUNX1, (C) SRSF2, (D) TP53, (E) SETBP1, (F) STAG2.
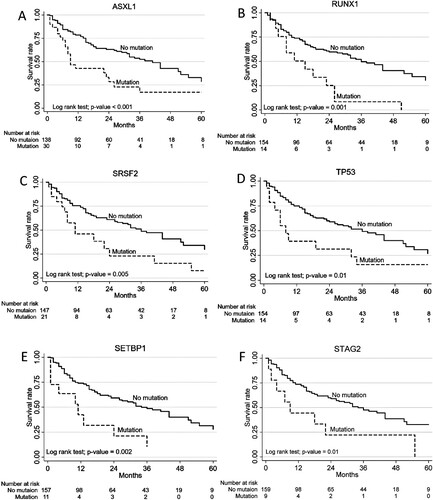
Table 3. Risk factors associated with mortality rates.
Discussion
In this study, we comprehensively described the clinical and mutational profiles including their association with MDS and MDS/MPN patients. Patients with MDS/MPN carried a similar prognosis to patients with high-risk MDS which was significantly worse than low-risk MDS. Compared to Western populations, there was a lower prevalence of SF3B1 mutations among Asian patients with MDS and MDS/MPN, including our cohort [Citation15]. Excluding SF3B1, the most frequent top three mutated genes were TET2, ASXL1 and SRSF2, which were similar to those of Western populations [Citation15]. Comparable to a previous report [Citation16], common mutations in MDS/MPN were ASXL1, SRSF2, NRAS, KRAS and RUNX1. In concordance with a previous study [Citation17], patients with SF3B1 mutations had lower haemoglobin levels than patients with wild-type. SF3B1 is typically mutated in MDS with ring sideroblast, causing disruption in iron metabolism and, consequently, resulting in anaemia. SF3B1-mutated patients showed mild effects on other lineages and did not lead to peripheral blood cytopenia, except anaemia as reported in previous studies [Citation10,Citation17]. Reinforced by our data, we demonstrated higher platelet counts in patients with SF3B1 mutations than wild-type. On the other hand, patients with U2AF1 mutations showed lower WBC despite being both splicing factor genes. This high-risk feature was comparable with the previous report [Citation18] which showed that patients with U2AF1 mutations are associated with increased risk of AML transformation. In fact, mutations in splicing factors result in different alterations in splicing and affecting different genes. U2AF1 mutations cause differential splicing of genes affecting biological pathways which lead to poor survival [Citation19,Citation20], while missplicing from SF3B1 mutations results in impaired erythroid cell growth and differentiation. Notably, no U2AF1 mutations were detected in the MDS/MPN patients in our cohort. Nagata et al. [Citation10 ]showed that IDH1 mutations were associated with neutropenia, but the mutation was uncommon in our cohort. Augmentation of proliferative signals typically results from CBL and oncogenic RAS pathway mutations [Citation9,Citation21], which explained monocytosis, a hallmark feature of MDS/MPN.
Multivariate analysis showed that Severe neutropenia (ANC < 0.5 × 10⁹/L) and mutations in ASXL1 or SETBP1 genes were independently related to inferior survival. These results highlight the clinical significance of cytopenia and certain somatic mutations. As molecular data have shown prognostic values in addition to the R-IPSS score [Citation22], patients with those features should be properly treated and carefully monitored. We could not demonstrate favourable prognosis of subjects with SF3B1 mutations. This might be due to a small number of patients and the differences in genetic background that had negative impact on these group of patients. Our study showed genetic abnormalities that were correlated with clinical data especially in cytopenia among Asian patients with MDS and MDS/MPN. To improve quality of life and possibly prolong survival of these patients, targeting these genetic abnormalities to improve cytopenia is an active area of investigation.
Conclusion
Variations in blood cell counts in MDS and MDS/MPN were correlated with mutations in splicing factor genes. SF3B1 mutations were associated with lower haemoglobin levels but higher platelet counts, while U2AF1 mutations were associated with lower WBC. Signalling molecules, KRAS mutations were associated with monocytosis. High-risk MDS, MDS/MPN, severe neutropenia, ASXL1 and SETBP1 mutations were independent factors which were associated with worse OS.
Supplemental Material
Download MS Power Point (131.6 KB)Supplemental Material
Download MS Excel (36.2 KB)Supplemental Material
Download MS Excel (16.7 KB)Supplemental Material
Download MS Excel (15.7 KB)Acknowledgements
Authors thank the research team of the Department of Medicine, Faculty of Medicine, Chulalongkorn University for editing the final manuscript. Authors thank Jiratchaya Sophonphan for the statistical analysis.
Disclosure statement
No potential conflict of interest was reported by the author(s).
Additional information
Funding
Related Research Data
References
- Kao JM, McMillan A, Greenberg PL. International MDS risk analysis workshop (IMRAW)/IPSS reanalyzed: impact of cytopenias on clinical outcomes in myelodysplastic syndromes. Am J Hematol. 2008;83:765–770.
- Cordoba I, Gonzalez-Porras JR, Such E, et al. The degree of neutropenia has a prognostic impact in low risk myelodysplastic syndrome. Leuk Res. 2012;36:287–292.
- Ogawa S. Genetics of MDS. Blood. 2019;133:1049–1059.
- Nagata Y, Makishima H, Kerr CM, et al. Invariant patterns of clonal succession determine specific clinical features of myelodysplastic syndromes. Nat Commun. 2019;10:5386.
- Menssen AJ, Walter MJ. Genetics of progression from MDS to secondary leukemia. Blood. 2020;136:50–60.
- Boultwood J, Pellagatti A, McKenzie AN, et al. Advances in the 5q- syndrome. Blood. 2010;116:5803–5811.
- Kanagal-Shamanna R, Bueso-Ramos CE, Barkoh B, et al. Myeloid neoplasms with isolated isochromosome 17q represent a clinicopathologic entity associated with myelodysplastic/myeloproliferative features, a high risk of leukemic transformation, and wild-type TP53. Cancer. 2012;118:2879–2888.
- Bejar R, Papaemmanuil E, Haferlach T, et al. Somatic mutations in MDS patients are associated with clinical features and predict prognosis independent of the IPSS-R: analysis of combined datasets from the International Working Group for Prognosis in MDS-Molecular Committee. Blood. 2015;126:907.
- Patnaik MM, Lasho TL. Genomics of myelodysplastic syndrome/myeloproliferative neoplasm overlap syndromes. Hematol Am Soc Hematol Educ Program. 2020;2020:450–459.
- Nagata Y, Zhao R, Awada H, et al. Machine learning demonstrates that somatic mutations imprint invariant morphologic features in myelodysplastic syndromes. Blood. 2020;136:2249–2262.
- Arber DA, Orazi A, Hasserjian R, et al. The 2016 revision to the world health organization classification of myeloid neoplasms and acute leukemia. Blood. 2016;127:2391–2405.
- Greenberg PL, Stone RM, Al-Kali A, et al. NCCN guidelines(R) insights: myelodysplastic syndromes, version 3.2022. J Natl Compr Canc Netw. 2022;20:106–117.
- Ferrone C, Wong H, Semenuk L, et al. Validation and clinical impact of the oncomine myeloid targeted DNA and RNA Ion semiconductor sequencing assay. Blood. 2018;132:5523.
- Atli EI, Gurkan H, Atli E, et al. The importance of targeted next-generation sequencing usage in cytogenetically normal myeloid malignancies. Mediterr J Hematol Infect Dis. 2021;13:e2021013.
- Papaemmanuil E, Gerstung M, Malcovati L, et al. Clinical and biological implications of driver mutations in myelodysplastic syndromes. Blood. 2013;122:3616–3627. quiz 99.
- Palomo L, Meggendorfer M, Hutter S, et al. Molecular landscape and clonal architecture of adult myelodysplastic/myeloproliferative neoplasms. Blood. 2020;136:1851–1862.
- Malcovati L, Stevenson K, Papaemmanuil E, et al. SF3B1-mutant MDS as a distinct disease subtype: a proposal from the International Working Group for the Prognosis of MDS. Blood. 2020;136:157–170.
- Graubert TA, Shen D, Ding L, et al. Recurrent mutations in the U2AF1 splicing factor in myelodysplastic syndromes. Nat Genet. 2011;44:53–57.
- Ilagan JO, Ramakrishnan A, Hayes B, et al. U2AF1 mutations alter splice site recognition in hematological malignancies. Genome Res. 2015;25:14–26.
- Pellagatti A, Armstrong RN, Steeples V, et al. Impact of spliceosome mutations on RNA splicing in myelodysplasia: dysregulated genes/pathways and clinical associations. Blood. 2018;132:1225–1240.
- Muramatsu H, Makishima H, Maciejewski JP. Chronic myelomonocytic leukemia and atypical chronic myeloid leukemia: novel pathogenetic lesions. Semin Oncol. 2012;39:67–73.
- Nazha A, Narkhede M, Radivoyevitch T, et al. Incorporation of molecular data into the Revised International Prognostic Scoring System in treated patients with myelodysplastic syndromes. Leukemia. 2016;30:2214–2220.