
ABSTRACT
Objective
Acute myeloid leukemia (AML) is a malignant clonal disease characterized by abnormal proliferation of immature myeloid cells and bone marrow failure. Regulatory T cells (Treg) play a suppressive role in the anti-tumor immune response in the tumor microenvironment. Screening biomarkers based on Treg immune-related genes may help to predict the prognosis and the efficacy of immunotherapy of AML.
Method
Gene expression profiles of AML (non-M3) were obtained from the TCGA and GEO databases. Gene module related to Treg was extracted using CIBERSORT and WGCNA algorithms. Univariate Cox regression and LASSO analyses were performed to identify hub genes and constructed the immune prognostic model. Molecular and immunological features associated with risk signature were explored, and TIDE was used to predict the efficacy of immunotherapy.
Result
A risk signature was constructed based on the five IRGs (IFI27L1, YIPF6, PARVB, TRIM32 and RHOBTB3). The risk signature could be served as an independent prognostic factor of AML. Patients in the high-risk group had a poorer OS than those in the low-risk group. In addition, patients in the high-risk group had higher TP53 mutation rate, higher infiltration of Treg, higher immune escape potential and less benefit from ICI therapy compared to low-risk group.
Conclusion
Our study constructed a prognostic index based on five Treg-related biomarkers, which help to facilitate the differentiation of immunological and molecular characteristics of AML, predict patient prognosis and provide a reference for predicting benefits from ICI therapy.
Introduction
Acute myeloid leukemia (AML) is a malignant clonal hematologic disorder characterized by abnormal proliferation of immature myeloid cells and bone marrow failure and is the most common of all acute leukemias with the highest mortality rate. The Global Burden of Disease Collaborators reports that there were approximately 141,000 new cases of AML and up to 147,000 deaths worldwide in 2015 [Citation1]. Although chemotherapy and hematopoietic stem cell transplantation can effectively improve the efficacy, induction therapy failure and relapse after remission remains a therapeutic challenge, and the long-term survival rate of adult AML patients is only 30–40% [Citation2]. Studies have shown that the pathogenesis of AML is closely related to the immune regulation of the body and the immune escape of tumor cells. Immunotherapy is expected to eradicate chemotherapy-resistant clones and provide long-term disease control, and chemotherapy combined with immunotherapy is considered a new approach that can effectively improve patient outcomes.
Regulatory T cells (Treg) are a subpopulation of CD4+ T cells with significant immunosuppressive effects. AML patients commonly have abnormally high expression of CTLA-4 and PD-1 immune checkpoints on the surface of activated T and B cells, which are inhibitors of T-cell proliferation and function and greatly diminish the anti-tumor immune effect of T cells. The binding of PD-1 to its ligand PD-L1 inhibits anti-tumor immune by blocking T-cell proliferation, inducing apoptosis and differentiating Treg cell subpopulations, which in turn inhibits the anti-tumor immune response, allowing AML tumor cells to evade the surveillance of immune cells and achieve immune escape [Citation3]. Studies have shown that the number of Treg cells in peripheral blood and bone marrow is increased in patients with newly diagnosed or refractory relapsed AML compared to normal controls [Citation4]. In addition, the frequency of Treg is significantly higher in bone marrow than in peripheral blood in the same patients. In a follow-up study of 58 patients with AML, patients who reached CR after conventional chemotherapy and transplantation had a lower Treg cell frequency at diagnosis compared to patients with unresponsive or persistent leukemia. In patients who reached CR after treatment, Treg cell frequency decreased and patients with high Treg frequency at CR had a tendency to relapse. It is suggested that Treg frequency can predict clinical outcome and monitor disease status and that elevated Treg frequency is associated with poor prognosis in AML [Citation5].
Treg plays an important role in anti-tumor immune response, and an in-depth understanding of the role of Treg in anti-tumor immunity can help identify new immunotherapeutic targets and potential prognostic markers, providing a valuable theoretical basis for tumor immunotherapy strategies and predicting immunotherapeutic response. In this study, we focused on immune-related genes (IRGs) in AML and screened Treg-related genes associated with patient prognosis by weighted gene co-expression network analysis (WGCNA) to construct a risk signature. The risk signature was associated with the prognosis of AML patients and could be potentially conducive to predict the efficacy of immunotherapy.
Materials and methods
Data acquisition
The AML (non-M3) RNA-seq data were obtained from The Cancer Genome Atlas (TCGA) database and the Gene Expression Omnibus (GEO) database microarray data sets GSE9476 and GSE12417, which include 122 AML samples, 5 AML bone marrow samples, 10 normal samples [Citation6] and 79 normal karyotype (CN-AML) bone marrow samples, respectively [Citation7].
Estimation of tumor-infiltrating immune cells in TCGA
The proportion of tumor-infiltrating immune cells (TIILs) in bone marrow samples was estimated using the CIBERSORT algorithm. P value less than 0.05 for immune cell infiltration estimation was retained for further analysis. Immune cells from AML and normal human bone marrow samples from the GSE9476 were analyzed differently using the ‘limma’ package in R. Clinical data from AML patients in the TCGA database were extracted and analyzed using the ‘survival’ package.
Co-expression network construction and module correlation analysis
Weighted gene co-expression network analysis (WGCNA) was used to construct co-expression network [Citation8]. The weighted adjacency matrix will be constructed using the power function amn = cmn absolute value * β (cmn = Pearson correlation between gene m and gene n; amn = adjacency between gene m and gene n). β is a soft threshold parameter that emphasizes the strong correlation between genes, and the goodness of fit is guaranteed to be above 0.8 by selecting the appropriate soft threshold parameter to obtain a scale-free co-expression network. In the gene module clustering analysis, the adjacency matrix is converted into a topological overlap matrix (TOM), and the network connectivity of a gene is the sum of all other network genes. Hierarchical clustering is performed based on the TOM to derive different gene modules, and we define the minimum number of genes per clustered module as 50 and the module shear height as 0.25. The WGCNA package was used to convert the immune cell characteristics data into colors to obtain the correlation heat map between gene modules and immune characteristics.
Construction and evaluation of risk signature based on hub module
The univariate and LASSO analyses were applied to identify the genes significantly related to overall survival (OS) in TCGA-AML and construct a risk signature [Citation9]. Based on the median value of risk score, the AML patients were classified into high-risk or low-risk groups, respectively. Kaplan–Meier (K-M) survival curves with log-rank tests were used to evaluate the prognostic power. The accuracy of the model was assessed by plotting the subject operating characteristic curve (ROC). GSE12417 was used as the external cohort to verify the risk signature. Univariate and multivariate Cox regression analyses were performed to assess the independent prognostic value of the risk signature. Clinical characteristics and risk signature were used for the construction of a nomogram to predict the prognosis of AML.
Correlation of risk signature with molecular and immunological characteristics
Correlation analysis of clinical characteristics was performed between high-risk and low-risk groups to investigate whether there were statistical differences in clinical parameters. Gene mutation analysis was performed using the R package ‘Maftools’ for the high-risk and low-risk groups. Results were visualized using waterfall plots. The Gene set enrichment analysis (GSEA) was used to analyze the biological functions and enrichment pathways.
The Tumor Immune Dysfunction and Exclusion (TIDE) tool is a computational framework for assessing the likelihood of tumor immune escape [Citation10]. Using the tool's predictive response module, the TIDE score calculated for each tumor sample can be used as a surrogate biomarker to predict response to immune checkpoint inhibitor (ICI). Higher TIDE prediction scores represent higher immune escape potential and patients are less likely to benefit from ICI therapy (anti-PD-1 and anti-CTLA-4).
Sensitivity analysis of therapy based on different risk groups
To investigate the potential value of the risk signature in the clinical treatment of AML, we tested the drug sensitivity based on group risking. R package ‘pRRophetic’ was used to calculate the concentration of 50% reduction growth (IC50). A Wilcoxon rank sum test was used to compare the IC50 differences between the high-risk and low-risk groups.
Statistical analysis
Comparison of continuous variables between two groups was performed using two independent samples t-test, non-parametric test was used for two groups of data that did not conform to normal distribution, and chi-square test was used for categorical data, where either predicted frequency was less than 5, using Fisher's exact test. TIDE scores were compared between groups using non-parametric tests, and correlation analyses were performed using Pearson's correlation. The Kaplan–Meier method and log-rank test were used to estimate patient survival and plot survival curves. Cox regression was used for univariate and multivariate survival analyses. P value less than 0.05 was considered statistically significant.
Results
Differential analysis of AML immune cell infiltration levels
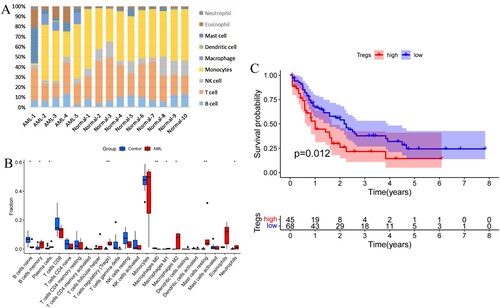
The immune cell proportions differed between AML and normal controls, with a relatively higher proportion of neutrophils, eosinophils, mast cells and macrophages and a relatively decreased proportion of lymphocytes in AML compared to normal subjects ((A)). Regulatory T cells, memory B cells, plasma cells, macrophages M1 type, M2 type and mast cell resting type were significantly upregulated in AML compared to normal subjects, while initial B cells were significantly down-regulated ((B)). Based on the immune cell content, immune cells were divided into two groups with high and low expression. High Treg levels were significantly associated with worse OS in AML ((C)).
Figure 1. (A) Histogram of the percentage of bone marrow immune cells in 10 cases of AML and 5 cases of normal subjects. (B) Analysis of immune cell differences in AML vs normal subjects. (C) Effect of Treg on overall survival (OS) of AML patients. (*P < 0.05, **P < 0.01).
Identification of hub module associated with Treg infiltration by WGCNA
The clustering analysis was performed by the dynamic shear tree method, and the shear height of 20,000 was used as the criterion for shearing. The immune cell data corresponding to 121 cases of AML were converted into colors and plotted in a tree diagram and a characteristic heat map ((A)). The filtered genes were used to construct the scale-free network by calculating the connection strength between genes, and the scale-free topology model was determined using a scale-free R2 from 0 to 1. (B) shows the relationship between the goodness of fit (R2) and different soft thresholds, the red line represents the goodness of fit R2 of 0.9, the fit is considered satisfactory when R2 is greater than 0.9. (C) shows the relationship between the average number of connections and different soft thresholds, when the soft threshold β is 7, R2 is above 0.9, at which time the corresponding network average connectivity is close to zero and the gene distribution is consistent with a scale-free network.
Figure 2. (A) Tree diagram and feature heat map. (B) Relationship between the goodness of fit and different soft thresholds. (C) Relationship between the average number of connections and different soft thresholds. (D) Module clustering diagram. (E) Association diagram between gene modules and immune cell characteristics. (F) Scatter plot of GS and MM in green module.
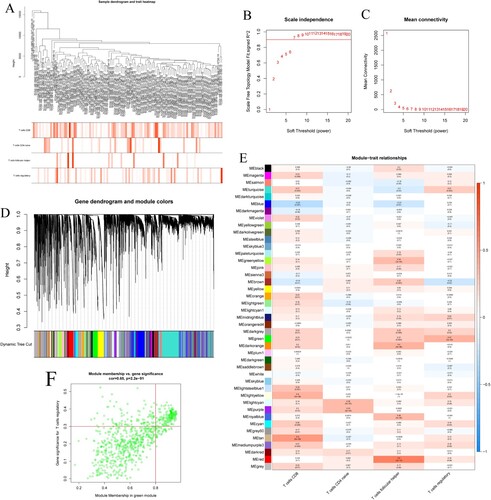
The genes with co-expression characteristics were clustered by color using 0.25 as the shear height to draw a module clustering map ((D)). Where each leaf represents an individual gene and each branch represents a co-expression module. The gray color represents modules that are not meaningful and are not included in the subsequent analysis of the results. The modules were correlated with the immune cell features and the module-feature association plot was drawn, and a total of 43 co-expression modules containing 18,857 genes were obtained ((E)). The result shows that Treg is significantly and positively correlated with the green module (MEgreen) which contains 751 genes. The scatter plot of green module GS versus MM was plotted, which showed that green module was highly correlated with Treg ((F), cor = 0.65, P = 2.2 × 10−91). We defined green module as the hub module and extracted genes from this module for subsequent analysis.
Construction of prognostic signature based on genes of green module
K-M method was used to identify the genes in the green module related to the OS of AML from TCGA. A total of 10 genes were identified and further analyzed by the univariate Cox regression analysis ((A)). To further screen the stable variables and avoid overfitting, five genes detected via the univariate Cox regression were evaluated by LASSO regression analysis ((B,C)). Finally, we got five prognosis genes which were used to build a risk signature. Based on the expression of these five genes and their corresponding regression coefficients, the risk score = 2.86 × 10−01*IFI27L1 gene expression + (−2.28 × 10−01)*YIPF6 gene expression + 5.69 × 10−02*PARVB gene expression + 6.14 × 10−02*TRIM32 gene expression + (−9.71 × 10−02)*RHOBTB3 gene expression.
Figure 3. (A) Forest plot for univariate Cox regression analysis. (B) Plot of LASSO coefficients for the five prognostic genes. (C) Tenfold cross-validation plot for adjusting the parameters in the LASSO model. (D) Risk score, risk status and risk heat map for the training sets. (E) Risk score, risk status and risk heat map for the training sets. (F,G) Training set and validation set survival analysis. (H,I) Training set and validation set ROC curves.
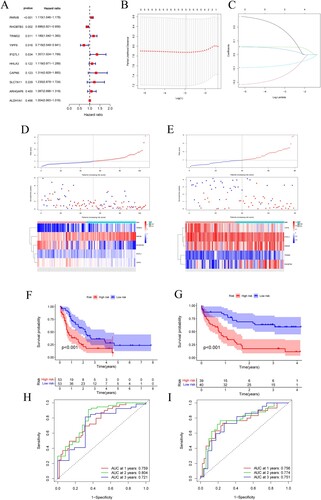
According to the cutoff value of the median risk score, AML patients were assigned to high-risk and low-risk groups. The prognosis of the high-risk group was worse than that of the low-risk group ((D,E)). K-M survival analysis showed that the OS of AML patients was significantly correlated with the risk score, and the OS of the high-risk group was significantly lower than that of the low-risk group, suggesting that the high-risk score is a poor prognostic factor for AML patients ((F)). The GEO dataset served as an external validation, yielding similar results ((G)). The ROC curve was used to assess the accuracy of the prediction model, with the training and validation sets. The area under the ROC curve for 1, 2, and 3 years was 0.759, 0.804, 0.721 and 0.756, 0.774, 0.751, respectively, suggesting the risk signature could be used to predict OS in AML patients reliably ((H,I)).
The potential role of risk score in the prognosis of AML in the TCGA cohort was assessed using univariate and multivariate Cox regression analysis. The results showed that risk score were significantly associated with AML prognosis (P < 0.001), indicating that risk score is a risk factor for AML and may be a potential independent prognostic factor for OS in AML patients ().
Table 1. Univariate and multivariate Cox regression analysis.
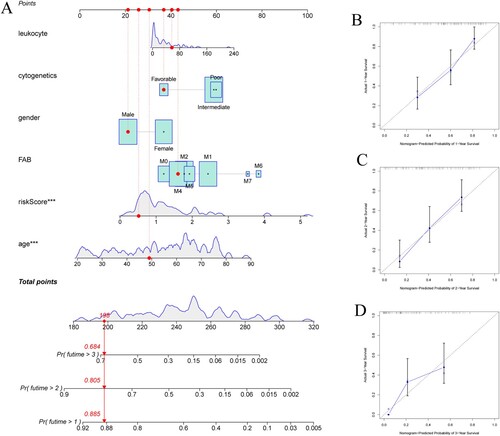
Based on the risk signature and several clinicopathologic characteristics in the TCGA cohort to create nomogram to predict patients’ OS. Excepting for baseline characteristics, differences in treatment regimens may affect prognosis, and considering the limited data on treatment factors, this study failed to include treatment factors to predict patients’ prognosis. A total of age, sex, WBC, FAB types, cytogenetic characteristics and risk signature were included for scoring ((A)). The C-index was 0.73 with moderate accuracy, indicating that the nomogram could estimate patient survival accurately. The calibration curves show that the predicted survival rates at 1, 2 and 3 years are consistent with the actual survival rates ((B,C,D)).
Figure 4. (A) Nomogram predicting OS in AML patients. (B–D) Calibration diagram for internal validation.
Correlation between risk signature and molecular and immunological characteristics
Correlation analysis of clinical parameters results showed that the risk score was correlated with patients’ age, hemoglobin and cytogenetics, no significant correlation was found between risk score and other clinical parameters ().
Table 2. Correlation of clinical characteristics of AML (non-M3) patients.
Gene mutations analysis was performed to gain further insights into the molecular characteristics of different subgroups. Missense variations were the most common mutation type, followed by frame shift ins and multi hit. TP53, RUNX1, DNMT3A and FLT3 genes had higher mutation frequencies in the high-risk group, while TP53, KNAS and CEBPA genes had zero mutation frequency in the low-risk group ((A,B)).
Figure 5. (A) Mutation waterfall in the high-risk group. (B) Mutation waterfall in the low-risk group. (C–F) Functional and pathway enrichment map of GSEA in high and low-risk groups. (C,D) GO analysis in the high-risk group and the low-risk group. (E,F) KEGG pathway enrichment analysis in the high-risk group and the low-risk group.
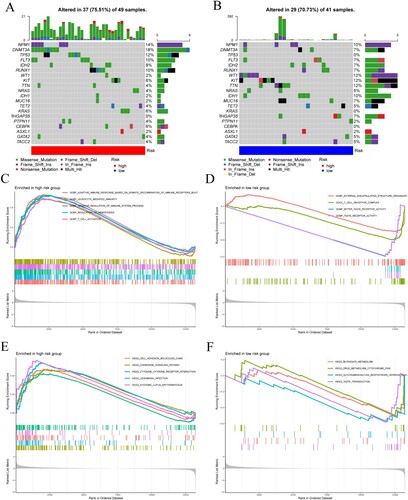
The biological functions and pathways enriched in the high-risk and low-risk groups were explored using GSEA. The biological functions in the high-risk group were mainly focused on adaptive immune response, regulation of hematopoiesis, negative regulation of the immune system, and were mainly enriched in chemokine signaling pathways, and cell adhesion molecule action pathways ((C,D)). While the low-risk group was mainly enriched in cell development, biosynthesis and drug metabolism-related pathways ((E,F)).
We further explored the differences in the expression of Treg and its surface molecular marker FOXP3 between the high-risk and low-risk groups (). Results showed that Treg and FOXP3 expression was significantly higher in the high-risk group compared with the low-risk group ((A), P = 0.0183) ((B), P = 0.0298).
Figure 6. (A) Difference in Treg infiltration level between high-risk and low-risk groups. (B) Different expression level of the Treg surface marker FOXP3. (C) Expression of immune checkpoint molecules in high-risk and low-risk groups. (D) TIDE prediction score for high-risk and low-risk groups. (E) T-cell exclusion prediction score. (F) T-cell dysfunction prediction score. (*P < 0.05; **P < 0.01; P < 0.001; ns, no significance).
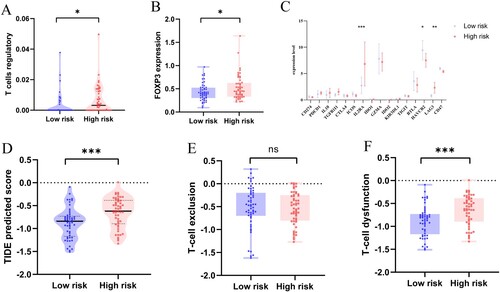
Further analysis of the expression differences of immune checkpoint-related genes between high-risk and low-risk groups showed that the expression levels of IL2RA, HAVCR2 and LAG3 were significantly correlated with risk signature, with IL2RA and LAG3 significantly highly expressed in the high-risk group, while HAVCR2 expression was down-regulated. PDCD1 and IL10 showed an upregulation trend in the high-risk group, while GZMA, BTLA and CD47 were down-regulated ((C)).
TIDE was used to predict the potential clinical efficacy of ICI in different risk groups. The results showed that TIDE scores were higher in the high-risk group than in the low-risk group ((D), P = 0.0004), suggesting that the high-risk group had a higher potential for immune escape and was less effective in receiving immunotherapy. High-risk group had a lower T-cell rejection score ((E)) and a higher T-cell dysfunction score ((F), P = 0.0004). Therefore, we speculate that the immune escape in the high-risk group may be associated with T-cell dysfunction.
Stratification analysis of clinical outcomes in AML based on risk signature
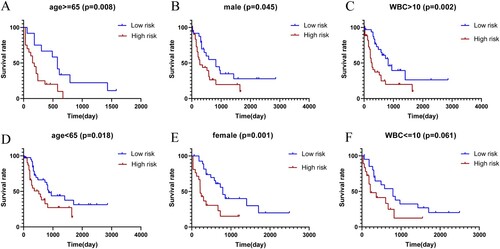
In this study, we also wonder whether risk signature was associated with the prognosis of the disease in different subgroups. Poor OS was found in high-risk group compared with low-risk group in the subgroups of age 65 and older, male group, WBC greater than 10 × 109/L, age less than 65, female group, and WBC less than or equal to 10 × 109/L, although the difference was not statistically significant in WBC less than or equal to 10 × 109/L group ((A–F)). In short, the results showed that patients in the high-risk group had a poorer prognosis compared with low-risk group.
Figure 7. Kaplan–Meier plot of OS for AML patients in high-risk group and low-risk group with age 65 and older (A), with male group (B), with WBC greater than 10 × 109/L(C), with age less than 65(D), with female group (E), with WBC less than or equal to 10 × 109/L(F).
Drug sensitivity analysis of risk signature for therapy
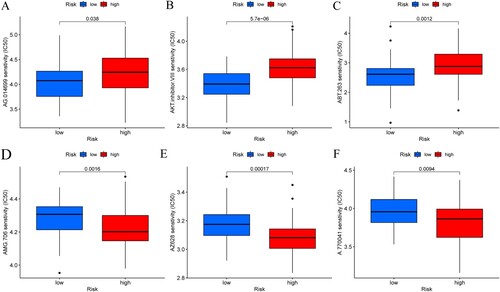
Chemotherapy drug sensitivity analysis was performed in different risk groups to screen out potential target drugs for the treatment of AML. Differences in sensitivity to chemotherapy drugs could be distinguished by risk grouping ((A–F)). In high-risk group, the IC50 values of target drugs AMG.706, AZ628, and A.770041 were significantly decreased compared with low-risk group. Patients in the low-risk group were more sensitive to the treatment with AG.014699, AKT inhibitor, and ABT.263. These results indicated that the risk signature was associated with therapeutic sensitivity and had potential significance for clinical treatment.
Figure 8. (A–F) The sensitivity of multiple potential anti-tumor drugs in different risk groups.
Discussion
AML is a malignant hematologic disease characterized by abnormal proliferation of immature myeloid cells in the bone marrow and peripheral blood. Treg is a subpopulation of T cells with immunosuppressive effect, which is involved in the immune escape of tumor cells. Immunotherapy may be a means to effectively improve the efficacy of AML. The aim of this study was to identify genes related to Treg infiltration and explore their role in predicting AML prognosis and immunotherapy efficacy. Based on the TCGA database, Treg-related gene modules were identified by WGCNA. Five prognosis genes were identified using univariable Cox and LASSO regression analysis. Based on these five genes (IFI27L1, YIPF6, PARVB, TRIM32 and RHOBTB3), a risk signature was constructed, which may serve as a potential independent prognostic factor for OS in AML.
The present study showed that TIILs such as macrophages, neutrophils and eosinophils were higher in AML bone marrow, while the proportion of lymphocytes, such as NK cells and T cells were decreased, suggesting that the AML microenvironment may be in a state of immunosuppression. Treg was significantly upregulated in AML compared to normal bone marrow, and upregulated Treg correlated with poor patient prognosis, which is consistent with the previous study [Citation5]. The increased proportion of Treg may leave the immune microenvironment in AML patients in a suppressed state, thus facilitating the immune escape of tumor cells. Targeted removal or reduction of Treg is expected to be a new immunotherapeutic tool that could help improve anti-leukemic efficacy [Citation11]. In view of this, identification of Treg-related biomarkers may help to predict prognosis and immunotherapeutic response in AML.
The immune prognostic model constructed in this study was composed of five genes related to Treg infiltration. PARVB is a member of the Parvin family of proteins, which play a key role in cell adhesion, proliferation and migration. PARVB overexpression is associated with shorter survival and PARVB-induced upregulation of EMT in patients with glioma, which can be induced through the JAK2/STAT3 pathway induces epithelial–mesenchymal transition (EMT) to promote malignant behavior in glioma cells [Citation12]. TRIM32 is thought to be an E3 ubiquitin ligase involved in a variety of different biological pathways. TRIM32 is overexpressed in lung cancer tissues and cell lines and is associated with poor prognosis, possibly through activation of the JAK2/STAT3 signaling pathway regulates proliferation, migration and invasion of lung cancer cells [Citation13]. TRIM32 promotes proliferation and invasion of gastric cancer cells by activating the β-catenin signaling pathway [Citation14]. The Rho family plays an important role in cell proliferation, tumorigenesis and progression. RHOBTB3 is highly expressed in AML, and the high expression of RHOBTB3 is a good prognostic factor for AML (non-M3), which is consistent with the results of this study. In AML patients receiving chemotherapy, the RHOBTB3 high expression group exhibited better EFS and OS relative to the RHOBTB3 low expression group [Citation15]. YIPF6 has a granule in the intestinal cell that has specific functions in secretion and plays an important role in maintaining intestinal homeostasis in mice, and YIPF6 mutations are closely associated with spontaneous intestinal inflammation in mice [Citation16]. IFI27L1 is a protein-encoding gene with pro-apoptotic activity. Few studies have been reported on IFI27L1, and its function and mechanisms in the tumor microenvironment are not fully understood. In our study, the results of multivariate Cox regression analysis showed that risk signature may serve as an independent prognostic factor for AML, with poorer OS in high-risk patients compared with low-risk patients.
Missense variants were the most common type of mutations, followed by shift insertions and multiple strikes. TP53, RUNX1, DNMT3A and FLT3 genes were mutated at a higher frequency in the high-risk group. The oncogene TP53, which is involved in apoptosis, proliferation and differentiation of hematopoietic stem cells and remains silent in a stable hematopoietic state, is the most commonly mutated gene in cancer, and its mutation gives hematopoietic stem cells an unlimited propensity for self-renewal and the ability to transform into leukemic cells. Moreover, TP53 mutation is associated with clonal hematopoiesis (CH) and can promote leukemogenesis and transformation [Citation17]. The 2017 European Leukemia Network (ELN) guidelines classify leukemia patients with TP53 mutation as a poor prognosis group. Patients with TP53 mutation combined with complex karyotypes have a worse OS time than patients with TP53 wild-type combined with complex or non-complex karyotypes with TP53 mutation [Citation18]. Patients in the high-risk group with TP53 mutation had a worse prognosis than the low-risk group, which is consistent with the results of our survival analysis.
The high-risk group was mainly involved in adaptive immune response, regulation of hematopoietic function, negative regulation of the immune system, T-cell activation and other biological functions, mainly enriched in chemokine signaling pathways, cytokine–cytokine receptor interaction pathways and cell adhesion molecule action pathways, while the low-risk group was mainly enriched in biosynthesis and drug metabolism-related pathways. The high-risk group had higher levels of Treg infiltration and tended to have a higher proportion of immunosuppressive cells and suppressive cytokine signaling, suggesting that the high-risk group was in a more immunosuppressive level and active state of tumor progression and that their prognosis was worse, whereas the low-risk group had a lower immunosuppressive effect and their prognosis was relatively better.
Certain characteristics of immune cells may serve as biomarkers to predict the efficacy of checkpoint immunotherapy. In the present study, we found that FOXP3 was significantly highly expressed in the high-risk group, which is consistent with the literature [Citation19]. CD25 is considered a prognostic biomarker in AML, and high CD25 expression is associated with poorer OS [Citation20]. LAG3 was significantly highly expressed in the high-risk group. It is reported that inhibition of LAG3 allows T cells to acquire cytotoxicity and thus enhance tumor killing and also reduce the function of Treg in suppressing immune responses. Peripheral blood cell LAG3 expression identifies patients with poor prognosis with immune checkpoint blockade therapy, and the LAG+ immunophenotype is considered a potential independent marker compared to known clinical prognostic markers such as PD-L1 expression ratio and tumor mutational load (TMB) [Citation21].
TIDE predictive score correlates with T-cell dysfunction at high levels of CTL cell infiltration in tumors and T-cell rejection at low levels of CTL cell infiltration in tumors, thus representing two distinct mechanisms of immune escape. Higher TIDE prediction scores suggest a higher immune escape potential and patients are less likely to benefit from ICI therapy [Citation10]. The high-risk group was found to have a higher TIDE score, which indicated a higher potential for immune escape and less benefit from ICI treatment compared to the low-risk group. The lower ICI response of patients in the high-risk group with higher T-cell dysfunction prediction scores may be associated with immune escape due to T-cell dysfunction. Treg secretes suppressors such as TGF-β in the immune microenvironment and is able to suppress the activation, proliferation and differentiation of a variety of immune cells, including CD8+ and CD4+ T cells, NK cells, dendritic cells, macrophages and neutrophils. In metastatic melanoma, higher CTL levels indicate better patient prognosis only when TGFB1 (encoding TGF-β) expression levels are low [Citation22]. TGF-β has a significant antagonistic effect with CTL expression levels, and higher TGF-β levels in tumors reduce the beneficial association between CTL and OS. Therefore, we speculate that the poorer response to ICI therapy and poorer prognosis of patients in the high-risk group may be related to the dysfunction of T cells in the tumor microenvironment and suppressed anti-tumor immune response in the high-risk group, leading to immune escape of tumor cells. However, our predicted results were based on a public database of AML population, and there are individual differences in AML patients and different treatment regimens. Conventional chemotherapy in combination with anti-PD-1 or anti-CTLA4 antibody for relapsed/refractory AML showed 10–36% CR rates with 7–24 month-long median survival [Citation23]. We hope that our results can help to bring about a theoretical reference basis on improving AML treatment efficacy and reducing disease recurrence.
In addition, we investigated the anti-tumor drug sensitivity based on the risk signature. Patients in high-risk group were more sensitive to the treatment with drugs AMG.706, AZ628 and A.770041 compared with low-risk group. LCK inhibitor A.770041 could inhibit the proliferation of AML cell lines, which providing a potential therapeutic strategy for treating AML patients [Citation24]. Thus, the analysis of sensitivity to molecular therapy could help select potential drugs with clinical benefits and provide a basis for the precise treatment of AML. The risk signature consisting of key immune genes had the potential to identify target drugs that could be affected by immune factors. However, these results still require further clinical confirmation.
There were several limitations in our research. First, our study was based on the public database of AML transcriptome data, the sample size was limited and the potential mechanisms of prognostic markers need further validation. Second, the AML microenvironment is relatively complex, and immune cells are only a small part of it. This study failed to interpret the distribution pattern and interaction of immune cells at the single-cell level.
In conclusion, our study constructed an immune prognostic model based on five genes associated with Treg infiltration, which helps to distinguish molecular and immunological features of AML patients, predict prognosis and provide a reference for predicting response to immunotherapy. Risk signature may be a potential independent prognostic factor for AML patients. High-risk patients have a poor prognosis and benefit less from ICI therapy.
Disclosure statement
No potential conflict of interest was reported by the author(s).
Additional information
Funding
References
- Fitzmaurice C, Abate D, Abbasi N, et al. Global, regional, and national cancer incidence, mortality, years of life lost, years lived with disability, and disability-adjusted life-years for 29 cancer groups, 1990 to 2017: a systematic analysis for the global burden of disease study. JAMA Oncol. 2019;5(12):1749–1768.
- Döhner H, Weisdorf DJ, Bloomfield CD. Acute myeloid leukemia. N Engl J Med. 2015;373(12):1136–1152.
- Yan Y, Zhang L, Zuo Y, et al. Immune checkpoint blockade in cancer immunotherapy: mechanisms, clinical outcomes, and safety profiles of PD-1/PD-L1 inhibitors. Arch Immunol Ther Exp. 2020;68(6):1–15.
- Williams P, Basu S, Garcia-Manero G, et al. The distribution of T-cell subsets and the expression of immune checkpoint receptors and ligands in patients with newly diagnosed and relapsed acute myeloid leukemia. Cancer. 2019;125(9):1470–1481.
- Shenghui Z, Yixiang H, Jianbo W, et al. Elevated frequencies of CD4+ CD25+ CD127lo regulatory T cells is associated to poor prognosis in patients with acute myeloid leukemia. Int J Cancer. 2011;129(6):1373–1381.
- Stirewalt DL, Meshinchi S, Kopecky KJ, et al. Identification of genes with abnormal expression changes in acute myeloid leukemia. Genes Chromosom Cancer. 2008;47(1):8–20.
- Metzeler KH, Hummel M, Bloomfield CD, et al. An 86-probe-set gene-expression signature predicts survival in cytogenetically normal acute myeloid leukemia. Blood, J Am Soc Hematol. 2008;112(10):4193–4201.
- Langfelder P, Horvath S. WGCNA: an R package for weighted correlation network analysis. BMC Bioinform. 2008;9(1):1–13.
- Friedman J, Hastie T, Tibshirani R. Regularization paths for generalized linear models via coordinate descent. J Stat Softw. 2010;33(1):1.
- Jiang P, Gu S, Pan D, et al. Signatures of T cell dysfunction and exclusion predict cancer immunotherapy response. Nat Med. 2018;24(10):1550–1558.
- Sander FE, Nilsson M, Rydström A, et al. Role of regulatory T cells in acute myeloid leukemia patients undergoing relapse-preventive immunotherapy. Cancer Immunol Immunother. 2017;66(11):1473–1484.
- Zhao J, Wang L, Kong D, et al. Construction of novel DNA methylation-based prognostic model to predict survival in glioblastoma. J Comput Biol. 2020;27(5):718–728.
- Yin H, Li Z, Chen J, et al. Expression and the potential functions of TRIM32 in lung cancer tumorigenesis. J Cell Biochem. 2019;120(4):5232–5243.
- Wang C, Xu J, Fu H, et al. TRIM 32 promotes cell proliferation and invasion by activating β-catenin signalling in gastric cancer. J Cell Mol Med. 2018;22(10):5020–5028.
- Yang SH, Liu W, Peng J, et al. High expression of RhoBTB3 predicts favorable chemotherapy outcomes in non-M3 acute myeloid leukemia. J Cancer. 2021;12(14):4229.
- Brandl K, Tomisato W, Li X, et al. Yip1 domain family, member 6 (Yipf6) mutation induces spontaneous intestinal inflammation in mice. Proc Natl Acad Sci USA. 2012;109(31):12650–12655.
- Bowman RL, Busque L, Levine RL. Clonal hematopoiesis and evolution to hematopoietic malignancies. Cell Stem Cell. 2018;22(2):157–170.
- Bullinger L, Döhner K, Döhner H. Genomics of acute myeloid leukemia diagnosis and pathways. J Clin Oncol. 2017;35(9):934–946.
- Corthay A. How do regulatory T cells work?. Scand J Immunol. 2009;70(4):326–336.
- Du W, He J, Zhou W, et al. High IL2RA mRNA expression is an independent adverse prognostic biomarker in core binding factor and intermediate-risk acute myeloid leukemia. J Transl Med. 2019;17(1):1–14.
- Shen R, Postow MA, Adamow M, et al. LAG-3 expression on peripheral blood cells identifies patients with poorer outcomes after immune checkpoint blockade. Sci Transl Med. 2021;13(608):eabf5107.
- Knaus HA, Berglund S, Hackl H, et al. Signatures of CD8+ T cell dysfunction in AML patients and their reversibility with response to chemotherapy. JCI Insight. 2018;3(21).
- Tabata R, Chi SG, Yuda J, et al. Emerging immunotherapy for acute myeloid leukemia. Int J Mol Sci. 2021;22(4):1944.
- Li L, Cui Y, Shen J, et al. Evidence for activated Lck protein tyrosine kinase as the driver of proliferation in acute myeloid leukemia cell, CTV-1. Leuk Res. 2019;78:12–20.