
ABSTRACT
Background
The association between the serum free light chain (sFLC) ratio and the prognosis of multiple myeloma (MM) patients is controversial.
Aim
The purpose of this study is to explore the relationship between the sFLC ratio and the prognosis of MM patients through meta-analysis.
Methods
Online public databases were searched to find relevant studies. The retrieval time is limited from the establishment of the database to July 2021. The overall survival (OS) and progression-free survival (PFS) rates were compared. The results were described using hazard ratio (HR) and a 95% confidence interval (CI). Qualitative studies were also included.
Results
A total of 9 studies involving 2864 participants were included. A pooled analysis based on four studies including newly-diagnosed MM patients, demonstrated that an abnormal sFLC ratio was associated with poor outcomes of OS (HR = 1.82, 95% CI: 1.15–2.90) and PFS (HR = 1.87, 95% CI: 1.20–2.90). Three qualitative studies showed that an abnormal sFLC ratio was related with poor outcomes of OS (studies all included newly diagnosed MM patients) and PFS (two studies included newly-diagnosed MM patients and one study included non-newly-diagnosed MM patients). Two studies stated that the sFLC ratio is not associated with OS (both studies included non-newly-diagnosed MM patients) and one study reported that the sFLC ratio is not associated with PFS (study included non-newly-diagnosed MM patients).
Conclusion
sFLC ratio could be used to predict adverse outcomes in newly-diagnosed MM patients, but is not suitable for non-newly-diagnosed MM patients.
Introduction
Multiple myeloma (MM) is an incurable plasma cell malignant tumor with significant inter-patient and intra-patient heterogeneity [Citation1, Citation2]. Multiple myeloma accounts for 1% of all cancers and about 10% of all hematological malignancies [Citation3]. There are approximately 20,000 newly-diagnosed MM cases in the United States annually [Citation4]. Additionally, studies have revealed that the incidence of MM in males is slightly higher than in females, the incidence in African Americans is twice that of Caucasians, and the average age of patients at the time of diagnosis is around 65 years [Citation4, Citation5]. Approximately 1–2% of patients have extramedullary disease (EMD) at MM initial diagnosis, and 8% of MM patients develop EMD during the progression of MM, which seriously threatens patient survival.
Currently, although high-dose chemotherapy and autologous stem cell transplantation have significantly improved the outcomes of MM patients [Citation6–8], MM remains incurable. Consequently, researchers are continuing to seek alternative treatment options, or new effective markers, in the hope of further improving MM patient prognosis. Therefore, the establishment of a prognostic system to predict MM patient prognosis and provide a theoretical basis for clinical treatment strategies is essential. Previous studies have shown that the extensive molecular and genomic characteristics of MM cells in bone marrow affect the growth and survival of myeloma cells [Citation9–11], which provides new drug targets and clinical treatment approaches, as well as prognostic analysis.
The kappa/lambda serum free light chain (sFLC) ratio has developed into a useful serological marker for MM. It can not only be used to determine the risk of related diseases at the baseline level, but also provides relevant references for the appropriate clinical response post MM treatment. Dejoie showed that an abnormal sFLC ratio is associated with poorer overall survival (OS) and progression-free survival (PFS) in MM patients [Citation9], suggesting that the sFLC ratio can be used as an effective parameter for predicting adverse events in MM patients. Similarly, other studies have found that the sFLC ratio is related to the prognosis of MM patients [Citation12–14]. However, there is some debate with some studies reporting opposite results and conclusions [Citation15, Citation16]. For example, in a study of 595 participants, Wu et al. concluded that the sFLC ratio was not related to the OS and PFS in MM patients [Citation15]. In view of the current controversy surrounding the sFLC ratio and MM patient prognosis, this study used a meta-analytical approach to systematically evaluate the relationship between sFLC ratio and prognosis in MM patients.
Materials and method
The meta-analysis was completed in line with the Preferred Reporting Items for Systematic Reviews and Meta-Analyses (PRISMA) guidelines [Citation17].
Search strategy
Public databases (including PubMed, Embase, Google scholar, Cochrane library, Web of Science, Medline, OVID, and ScienceDirect) were systematically searched to collate relevant research regarding sFLC ratio and MM patients. As the database was only established in July 2021 the available data was limited. The detailed searching terms and strategies are shown in Supplementary Table. The retrieval process was conducted by two independent researchers and then cross-checked. Additionally, the references included in the literature were manually searched to expand the search scope and verify the recall rate.
Inclusion and exclusion criteria
Inclusion criteria: (1) Patient was diagnosed as MM according to the definition in the included literature; (2) Research containing kappa/lambda sFLC ratio data; (3) Research reports on the prognosis of MM patients (OS and/or PFS); (4) Full literature text is available. Exclusion criteria: (1) Smoldering (asymptomatic) MM; (2) Letter, comment, correspondence, editorial, abstract, or case report; (3) Animal study; (4) Different studies from the same group; studies that do not contain data for pooled analysis and/or description.
Data extraction and quality evaluation
The two researchers independently extracted baseline information from the included literature, including the first author, publication time, location, participant type, sample size, recruitment period, participant age, follow-up time, and outcome. If any disagreements occurred during the extraction process, a third researcher was consulted to settle any inconsistencies. The Newcastle-Ottawa Scale (NOS) score was used to evaluate the quality of the included studies [Citation18], and the specific score elements included study population selection, comparability, exposure, evaluation, or result evaluation. NOS adopts a semi-quantitative star system principle in study quality evaluation, with a maximum possible score of 9 points.
Statistical analysis
Stata 12.0 software was used to summarize and analyze the mergeable data. The differences between groups were described by hazard ratio (HR) with a 95% confidence interval (CI), the heterogeneity between included studies was evaluated using I2 and a funnel plot, and the heterogeneity of the source was further evaluated via Galbraith plot. If I2 > 50% or p < 0.05, the random effect model was used for summary analysis, otherwise, a fixed effect model was used. In view of the small number of studies included in the pooled analysis, publication bias (Begg’s or Egger’s) analysis was not conducted. In addition, for studies that could not extract relevant prognostic information, only qualitative descriptions were performed. p < 0.05 was considered as significantly different.
Results
Literature search
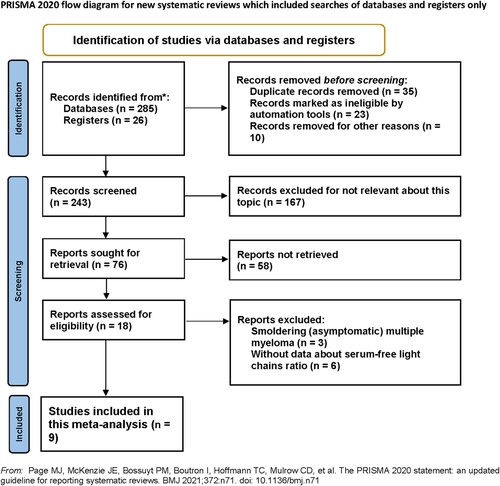
According to the established retrieval strategy, 311 articles were initially found. After reviewing the title, abstract and keywords, 293 studies were excluded. Subsequently, after reading the full text of the remaining studies, nine further studies were excluded. Finally, nine studies involving 2864 participants were included in the meta-analysis, as shown in .
Figure 1. Literature screening flow chart.
Baseline characteristics of included studies
The nine studies included were all published between 2008 and 2020, with sample sizes ranging from 70 to 790, and involved patients from six countries. The NOS scores were between 7 and 8. Additional studies/patients characteristics are presented in .
Table 1. Baseline characteristics of included studies.
Definition of abnormal sFLC ratio in different studies
describes the abnormal sFLC ratio in different studies. Notably, the vast majority of studies defined an sFLC ratio between 0.26 and 1.65 as normal, and values outside this range as abnormal.
Table 2. Abnormal sFLC ratio in the included studies.
sFLC ratio and OS
In quantitative research, four studies [Citation12, Citation14, Citation15, Citation19] proposed an association between sFLC ratio and OS, but it should be emphasized that all the participants included in the studies were newly-diagnosed MM patients. The results of summary analysis showed that an abnormal sFLC ratio was associated with poor OS in MM patients (HR = 1.82, 95% CI: 1.15–2.90, I2 = 88.0%, p = 0.011, ). A funnel plot () demonstrated that one of the studies was a source of increased heterogeneity. Therefore, sensitivity analysis, and Galbraith analysis, were performed to explore the source of the heterogeneity. Sensitivity analysis showed that the heterogeneity mainly came from Snozek’s study [Citation19] (). Similarly, the Galbraith plot also confirmed that the heterogeneity mainly came from the same study () [Citation19]. The reason for this could be that Snozek’s study [Citation19] was conducted more than ten years ago, whereas the other studies [Citation12, Citation14, Citation15] are all fairly recent.
Figure 2. Forest plot of the association between sFLC ratio and OS.
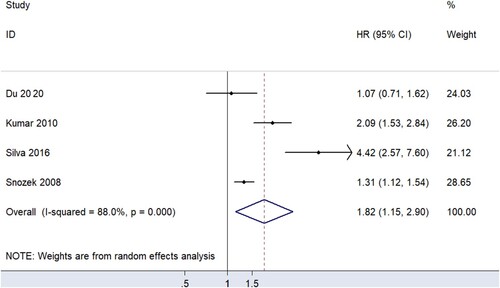
Figure 3. Funnel plot of the association between sFLC ratio and OS.
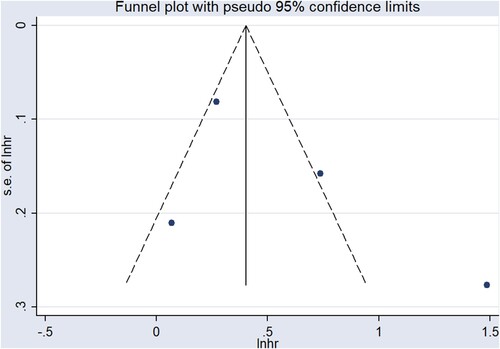
Figure 4. Sensitivity analysis of the association between sFLC ratio and OS.
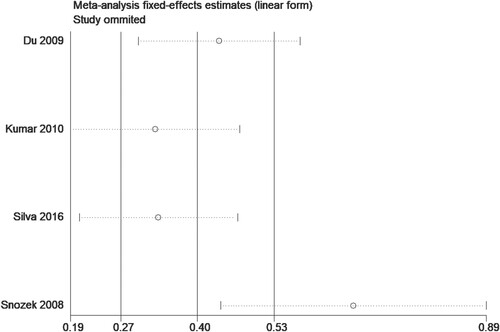
Figure 5. Galbraith plot of the association between sFLC ratio and OS.
The data provided in five studies [Citation9, Citation13, Citation16, Citation20, Citation21] could not be quantitatively analyzed. Among them, the results of three studies (studies wholly conducted on newly-diagnosed MM patients) showed that abnormal sFLC ratio was related to OS in MM patients [Citation9, Citation13, Citation21], while the other two studies [Citation16, Citation20] concluded that the sFLC ratio was not (studies both involved non-newly-diagnosed MM patients). Dejoie et al. [Citation9] found that an abnormal sFLC ratio was associated with poor OS after cycle 3 treatment in MM patients (HR = 7.8, 95% CI: 1.0–58.5, p = 0.047). This study also involved newly-diagnosed MM patients. In Moustafa’s study [Citation13], which again incorporated newly-diagnosed MM patients, multivariate regression analysis was used to adjust for potential confounding factors, and it was found that sFLC ratio abnormality was a risk factor of OS. Similarly, Tacchetti’s study [Citation21], including newly-diagnosed MM patients, also found that abnormal sFLC ratio is a prognostic factor of OS (HR = 4.69, 95% CI: 2.14–10.30, p < 0.001). However, the results of two other studies [Citation20, Citation21] showed that sFLC ratio was not associated with OS in long-term MM-diagnosed patients.
sFLC ratio and PFS
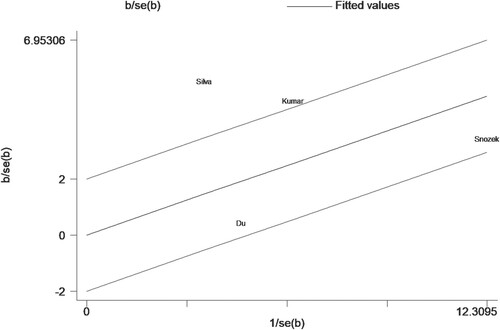
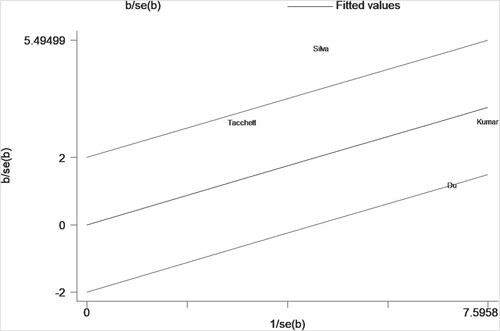
For data that can be quantitatively analyzed, four studies [Citation12, Citation14, Citation15, Citation21] involving newly-diagnosed MM patients described a relationship between sFLC ratio and PFS in MM patients. Pooled analysis demonstrated that an abnormal sFLC ratio was associated with poorer PFS in MM patients (HR = 1.87, 95% CI: 1.20–2.90, I2 = 82.2%, p = 0.005, ). Funnel plots suggested that one of the four studies was responsible for the heterogeneity (). Considering the considerable overall heterogeneity, sensitivity and Galbraith analyses were performed to determine the heterogeneity source. Sensitivity analysis suggested that it was mainly caused by the studies of Du [Citation15] and/or Silva [Citation14] (). Furthermore, the Galbraith plot indicated that Silva’s study [Citation14] was outside the regression line and could be judged as the main source of heterogeneity ().
Figure 6. Forest plot of the association between sFLC ratio and PFS.
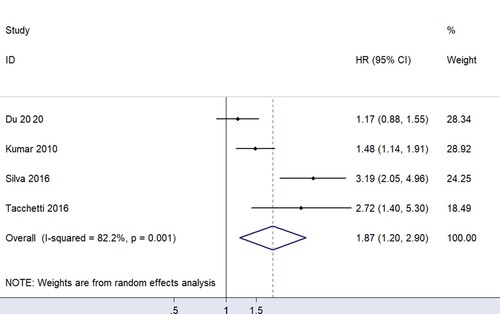
Figure 7. Funnel plot of the association between sFLC ratio and PFS.
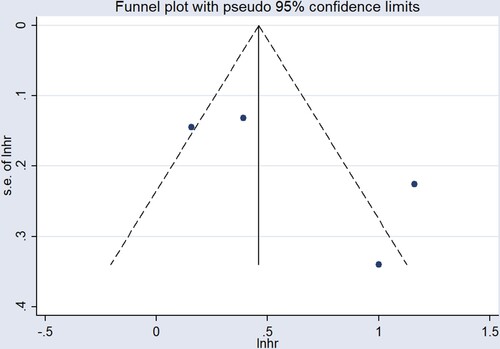
Figure 8. Sensitivity analysis of the association between sFLC ratio and PFS.
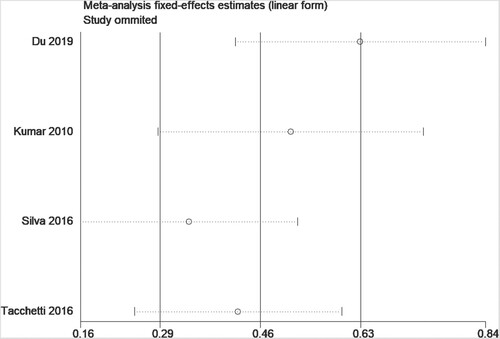
Figure 9. Galbraith plot of the association between sFLC ratio and PFS.
The data provided in four studies [Citation9, Citation13, Citation16, Citation20] cannot be quantitatively analyzed. Three of those studies [Citation9, Citation13, Citation16] (two studies included newly-diagnosed MM patients, and the other included non-newly-diagnosed MM patients) concluded that the sFLC ratio was associated with PFS in MM patients, while only one study [Citation20] (including non-newly-diagnosed MM patients) concluded that sFLC ratio was not related to PFS. Dejoie's study, involving newly-diagnosed MM patients, revealed that an abnormal sFLC ratio was associated with poor FPS in MM patients after one (HR = 7.5, 95% CI: 1.0–54.7, p = 0.048) and three, treatment cycles (HR = 6.8, 95% CI: 2.5–19.0, p < 0.001). In Moustafa’s study [Citation13], involving newly-diagnosed MM patients, the conclusion that abnormal sFLC ratio is associated with poorer FPS was still confirmed. Interestingly, in Özkurt’s study included non-newly-diagnosed MM patients, the authors found that abnormal sFLC ratio is associated with poorer PFS, but not with OS [Citation16]. In contrast, Giarin’s study [Citation20] found no significant relationship between abnormal sFLC ratio and FPS in newly-diagnosed MM patients after stem cell transplantation. Given the limited number of studies, it was not possible to perform subgroup analysis based on stem cell transplantation.
Discussion
This study, involving 2,864 participants, is the first large comprehensive study to evaluate sFLC ratio and MM patient prognosis. The main finding of this study is that abnormal sFLC ratio is associated with the poor prognosis of newly-diagnosed MM patients, mainly in OS (HR = 1.82, 95% CI: 1.15–2.90) and FPS (HR = 1.87, 95% CI: 1.20–2.90). This provides essential evidence for the treatment and prognosis prediction of newly-diagnosed MM patients. Conversely, no significant relationship was found between sFLC ratio and prognosis in non-newly-diagnosed MM patients.
With the commercialization of polyclonal turbidimetry, measuring serum immunoglobulin free light chain concentration has become an important part of clinical practice, which significantly improves the diagnosis and treatment of MM patients. Additionally, the International Myeloma Working Group [Citation22] proposed serum FLC concentration as an crucial biomarker to assess the prognosis of MM patients. Correspondingly, previous studies [Citation23, Citation24] have shown that analysis based on serum FLC provides essential information about the stage of diseases such as MM and plasma cell myeloma, and may become a promising hematologic marker for disease progression in the future. Furthermore, with continuous new drug development, treatment strategies for MM patients have improved significantly, with an increasing proportion of patients achieving a complete response rate. To facilitate the maximal detection of residual lesions, the International Myeloma Working Group has also added a more rigorous response category for MM assessment; stringent complete response (sCR) [Citation25, Citation26]. In addition to meeting traditional CR criteria, sCR also considers the sFLC ratio and clonal bone marrow plasma cells (BMPCs), indicating that the sFLC ratio plays an essential role in assessing the disease progression and prognosis of MM patients.
Abnormal sFLC ratios indicate an excess of one light chain type over another, and are valuable in assessing the prognosis of several important diseases [Citation27, Citation28]. In a retrospective study, the authors assessed the relationship between sFLC ratio and prognosis in MM patients [Citation21]. Patients were divided into three groups based on their baseline sFLC ratio levels: normal, slightly abnormal (<100), and highly abnormal (≥100). The results showed that 3-year PFS was lowest in the highly abnormal group (44%), followed by the slightly abnormal group (61%), and was highest in the normal group (72%). This suggests that abnormal sFLC ratio has a role in evaluating the prognosis and follow-up of MM patients. In another study [Citation14] in Spain, MM patients were divided into low and high groups based on sFLC ratio thresholds (cutoff value = 47) determined by receiver operating characteristic (ROC) curves. After an average follow-up of 35 (18–61) months, OS was 23% in the high group and 73% in the low group, respectively. Subsequent multivariate analysis indicated that abnormal sFLC ratio was an independent risk factor for adverse outcomes in MM patients. Corresponding to previous literature, the results of this meta-analysis also suggest that abnormal sFLC ratio is associated with poor prognosis in MM patients.
Some studies [Citation12, Citation29] have found that cytogenetic abnormalities are associated with an abnormal sFLC levels and/or sFLC ratios. Kumar's study [Citation12] confirmed that abnormal sFLC levels and abnormal ratios are frequently found in MM patients with IgH translocation, and are associated with poor prognosis. Interestingly, t (14;16) was particularly associated with higher sFLC levels and abnormal sFLC ratios. Jekarl et al. [Citation29] discovered that abnormal karyotypes and complex karyotypes were associated with MM progression. Furthermore, abnormal sFLC ratio was found to be associated with abnormal karyotypes, complex karyotypes, and higher plasma cell burden. The correlation between cytogenetic abnormalities and abnormal sFLC ratio further supports the suggestion that sFLC ratio could be used as a principal biomarker in MM patient prognosis evaluation. Cytogenetic tests are often difficult to routinely use in clinical practice and sFLC ratio is confirmed to be associated with cytogenetic abnormalities, therefore, the detection of sFLC ratio provides indirect evidence for the detection and evaluation of cytogenetic abnormalities, which is conducive to further refining the risk stratification of MM patients.
Interestingly, all studies available for a pooled analysis involved newly-diagnosed MM patients, and the pooled analysis results suggest that abnormal sFLC ratio is associated with poorer outcomes in newly-diagnosed MM patients. Conversely, in non-newly-diagnosed MM patients, the research suggests that sFLC ratio is not associated with OS and PFS. The above phenomena suggests that sFLC ratio could be used to judge the prognosis of newly-diagnosed MM patients, but not the prognosis of non-newly-diagnosed MM patients. This may partly explain why significant disagreements exist in previous literature regarding the association of sFLC ratio and the prognosis of MM patients. Therefore, the most important clinical implication of this study is that sFLC ratio could be used to predict the prognosis of newly-diagnosed MM patients but cannot be used to predict the prognosis of non-newly-diagnosed MM patients.
This study has the following limitations. Firstly, the differences in baseline characteristics of the included papers, such as age, project implementation time, and follow-up duration, may be contributing factors to the increase in confounding bias. Secondly, the sample studies did not provide detailed information about the cytogenetics of MM patients, thus it was impossible to assess whether cytogenetic differences had an impact on the final outcomes. Thirdly, differences in drug treatment strategies in the sample studies may also contribute to the increase in confounding bias. Fourthly, individual differences in MM patients are also significant factors that cannot be ignored. For instance, in Dejoie’s [Citation9] and Moustafa’s studies [Citation13], participants were newly-diagnosed MM patients, while in Giarin’s study [Citation14], the participants were recently diagnosed with MM after stem cell transplantation. We speculate that individual differences may explain the negative results in the Giarin study. However, due to the limited amount of relevant research, further analysis is not possible. Fifthly, due to insufficient quantitative data, we could not comprehensively analyze the selected sample studies. Sixthly, renal function might potentially correlate with prognosis in MM patients. However, as described in , some of the included studies provided information on renal function, while subgroup analyses by renal function were not performed to explore the relationship between sFLC ratio and prognosis in MM patients. Therefore, our study was unable to perform subgroup analysis based on renal function. Seventh, different subtypes of multiple myeloma may potentially influence the conclusions. However, there is currently insufficient evidence to support this hypothesis. Finally, based on the included studies, we cannot uniformly define the ‘abnormal’ cutoff value of sFLC ratio. Consistent with previous studies, however, we do recommend to define an sFLC ratio outside the normal range (0.26–1.65) as abnormal, the so-called sFLC cut-off point.
Conclusion
Our study shows that sFLC ratio could be an important serological parameter in predicting adverse prognosis in newly-diagnosed MM patients. In addition, considering that sFLC ratio is associated with cytogenetic abnormalities in MM patients, this presents wider prospects in evaluating and predicting the prognosis of newly-diagnosed MM patients. This will ultimately help to further improve the short and long-term prognosis of newly-diagnosed MM patients. However, more evidence is needed to further validate the relationship between sFLC ratio and prognosis in non-newly-diagnosed MM patients.
Disclosure statement
No potential conflict of interest was reported by the author(s).
Data availability statement
The original contributions presented in the study are included in the article/supplementary material. Further inquiries can be directed to the corresponding author.
Additional information
Funding
References
- Bustoros M, Mouhieddine TH, Detappe A, et al. Established and novel prognostic biomarkers in multiple myeloma. Am Soc Clin Oncol Educ Book. 2017;37:548–560.
- Corre J, Cleynen A, Du Pont SR, et al. Multiple myeloma clonal evolution in homogeneously treated patients. Leukemia. 2018;32(12):2636–2647.
- Rajkumar SV. Multiple myeloma: every year a new standard? Hematol Oncol. 2019;37:62–65.
- Rajkumar SV. Multiple myeloma: 2016 update on diagnosis, risk-stratification, and management. Am J Hematol. 2016;91(7):719–734.
- Kyle RA, Gertz MA, Witzig TE, et al. Review of 1027 patients with newly diagnosed multiple myeloma. Mayo Clin Proc. 2003 Jan;78(1):21–33.
- Cook G, Williams C, Brown JM, et al. High-dose chemotherapy plus autologous stem-cell transplantation as consolidation therapy in patients with relapsed multiple myeloma after previous autologous stem-cell transplantation (NCRI Myeloma X Relapse [Intensive trial]): a randomised, open-label, phase 3 trial. Lancet Oncol. 2014;15(8):874–885.
- Jain T, Sonbol MB, Firwana B, et al. High-dose chemotherapy with early autologous stem cell transplantation compared to standard dose chemotherapy or delayed transplantation in patients with newly diagnosed multiple myeloma: a systematic review and meta-analysis. Biol Blood Marrow Transplant. 2019;25(2):239–247.
- Avilés A, Neri N, Huerta-Guzmán J, et al. Randomized clinical trial of zoledronic acid in multiple myeloma patients undergoing high-dose chemotherapy and stem-cell transplantation. Current Oncol. 2013;20(1):13–20.
- Dejoie T, Corre J, Caillon H, et al. Serum free light chains, not urine specimens, should be used to evaluate response in light-chain multiple myeloma. Blood. 2016;128(25):2941–2948.
- Baker A, Braggio E, Jacobus S, et al. Uncovering the biology of multiple myeloma among African Americans: a comprehensive genomics approach. Blood. 2013;121(16):3147–3152.
- Kriegova E, Fillerova R, Minarik J, et al. Whole-genome optical mapping of bone-marrow myeloma cells reveals association of extramedullary multiple myeloma with chromosome 1 abnormalities. Sci Rep. 2021;11(1):1–14.
- Kumar S, Zhang L, Dispenzieri A, et al. Relationship between elevated immunoglobulin free light chain and the presence of IgH translocations in multiple myeloma. Leukemia. 2010;24(8):1498–1505.
- Moustafa MA, Rajkumar SV, Dispenzieri A, et al. Utility of serum free light chain measurements in multiple myeloma patients not achieving complete response to therapy. Leukemia. 2015;29(10):2033–2038.
- García de Veas Silva JL, Bermudo Guitarte C, Menéndez Valladares P, et al. Prognostic value of serum free light chains measurements in multiple myeloma patients. PLoS One. 2016;11(11):e0166841.
- Du J, Lu J, Gao W, et al. Serum-free light chains combined with the Revised International Staging System could further distinguish the superior and inferior clinical outcome of multiple myeloma patients. Ann Hematol. 2020;99(8):1779–1791.
- Özkurt ZN, Sucak GT, Akı ŞZ, et al. Early prognostic value of monitoring serum free light chain in patients with multiple myeloma undergoing autologous stem cell transplantation. Cancer Investig. 2017;35(3):195–201.
- Page MJ, McKenzie JE, Bossuyt PM, et al. The PRISMA 2020 statement: an updated guideline for reporting systematic reviews. BMJ. 2021 Mar 29;372:n71.
- Lo CK-L, Mertz D, Loeb M. Newcastle-Ottawa scale: comparing reviewers’ to authors’ assessments. BMC Med Res Methodol. 2014;14(1):1–5.
- Snozek CLH, Katzmann JA, Kyle RA, et al. Prognostic value of the serum free light chain ratio in newly diagnosed myeloma: proposed incorporation into the international staging system. Leukemia. 2008;22(10):1933–1937.
- Giarin MM, Giaccone L, Sorasio R, et al. Serum free light chain ratio, total κ/λ ratio, and immunofixation results are not prognostic factors after stem cell transplantation for newly diagnosed multiple myeloma. Clin Chem. 2009;55(8):1510–1516.
- Tacchetti P, Cavo M, Rocchi S, et al. Prognostic impact of serial measurements of serum-free light chain assay throughout the course of newly diagnosed multiple myeloma treated with bortezomib-based regimens. Leuk Lymphoma. 2016;57(9):2058–2064.
- Rajkumar SV, Dimopoulos MA, Palumbo A, et al. International myeloma working group updated criteria for the diagnosis of multiple myeloma. Lancet Oncol. 2014;15(12):e538–ee48.
- Larsen JT, Kumar SK, Dispenzieri A, et al. Serum free light chain ratio as a biomarker for high-risk smoldering multiple myeloma. Leukemia. 2013;27(4):941–946.
- Singh G. Oligoclonal pattern/abnormal protein bands in post-treatment plasma cell myeloma patients: implications for protein electrophoresis and serum free light chain assay results. J Clin Med Res. 2017;9(8):671.
- Abdallah N, Kapoor P, Murray DL, et al. Utility of serum free light chain ratio in response definition in patients with multiple myeloma. Blood Adv. 2020;4(2):322–326.
- Rajkumar SV, Harousseau J-L, Durie B, et al. Consensus recommendations for the uniform reporting of clinical trials: report of the International Myeloma Workshop Consensus Panel 1. Blood. 2011;117(18):4691–4695.
- Iwama K, Chihara D, Tsuda K, et al. Normalization of free light chain kappa/lambda ratio is a robust prognostic indicator of favorable outcome in patients with multiple myeloma. Eur J Haematol. 2013;90(2):134–141.
- Muchtar E, Dispenzieri A, Leung N, et al. Optimizing deep response assessment for AL amyloidosis using involved free light chain level at end of therapy: failure of the serum free light chain ratio. Leukemia. 2019;33(2):527–531.
- Jekarl DW, Min C-K, Kwon A, et al. Impact of genetic abnormalities on the prognoses and clinical parameters of patients with multiple myeloma. Ann Lab Med. 2013;33(4):248–254.