
ABSTRACT
Background
Mucosa-associated lymphoid tissue lymphoma translocation protein 1 (MALT1) regulates T helper/regulatory T cell balance, autoimmunity development, and leukemia pathogenesis. As a result, this study aimed to investigate the clinical role of MALT1 in patients with acute myeloid leukemia (AML).
Methods
MALT1 expressions were measured in peripheral blood mononuclear cell (PBMC) from 90 newly diagnosed AML patients before and after induction treatment using RT-qPCR. Moreover, MALT1 expressions were also determined in 50 disease controls (DCs) and 50 healthy controls (HCs).
Results
MALT1 expression was reduced in AML patients compared to HCs and DCs (both adjusted P < .001). Lower MALT1 expression was related to white blood cells >10×109/L (P = .037) and poor risk stratification (P = .020) in AML patients. MALT1 expression was elevated during induction treatment not only in total AML patients (P < .001), but also in subgroups of patients achieving complete remission (CR) (P < .001) and in those not achieving CR (P = .001). Furthermore, MALT1 expressions before induction treatment (P = .042) and after induction treatment (P < .001) were both increased in AML patients with CR compared to those with non-CR. Interestingly, both pre- and post-treatment MALT1 low (vs. high) were related to shorter accumulating event-free survival (EFS), which was also associated with a reduced accumulating overall survival (OS) (all P < .05). Furthermore, MALT1 increment during induction treatment < 50% was related to unsatisfied accumulating EFS (P = .001) and OS (P = .007).
Conclusion
PBMC MALT1 deficiency is common and relates to unfavorable induction therapy response and survival profile in AML patients.
1. Introduction
Acute myeloid leukemia (AML) is a devastating hematological malignancy characterized by the overproduction of progenitor cells of the myeloid lineage [Citation1]. The annual age-standard incidence rate of AML is estimated to be 4.3 per 100,000 population [Citation2,Citation3]. Following the diagnosis of AML, most patients receive one or two cycles of intensive chemotherapy as induction therapy, with the goal of achieving complete remission (CR) without any residues of leukemia cells [Citation4]. Unfortunately, parts of AML patients were unable to achieve CR, also recurrence is frequently reported in AML patients who achieved CR during induction therapy, resulting in an unfavorable prognosis [Citation5–7]. Therefore, it is necessary to identify some novel biomarkers to predict the therapeutic response, which further help to improve the overall management of AML patients.
Mucosa-associated lymphoid tissue lymphoma translocation protein 1 (MALT1) has been reported to be involved in immune response regulation via the formation of signalosomes [Citation8]. Interestingly, recent studies disclose that the MALT1 may play a role in maintaining T helper (Th)/regulatory T (Treg) cell balance, development of autoimmunity, and the pathogenesis of leukemia [Citation9–11]. For instance, suppressing MALT1 causes the imbalance of Th1/Treg cells, which leads to the development of autoimmunity [Citation9,Citation10,Citation12]. Furthermore, inhibiting MALT1 protease activity with MI-2 mediates T-cell leukemia cells proliferation via the nuclear factor (NF)-κB pathway-dependent manner [Citation11,Citation13,Citation14]. In clinical hematology, MALT1 has been identified as a potential biomarker for acute lymphoblastic leukemia (ALL) and lymphomas, while its clinical application in AML patients is poorly understood [Citation15–17].
Hence, this study detected the MALT1 expression in peripheral blood mononuclear cell (PBMC) before and after induction treatment, with the goal of exploring its correlation with disease features, response to induction treatment, and survival profile in AML patients.
2. Methods
2.1. Participants
Between February 2017 and June 2021, a total of 90 patients with newly diagnosed AML were recruited. The inclusion criteria for AML patients were: (1) newly diagnosed as AML by morphology, immunology, cytogenetics, and molecular biology of bone marrow (MCIM); (2) age ≥ 18 years old; (3) willing to provide peripheral blood (PB) samples. The exclusion criteria for AML patients were: (1) acute promyelocytic leukemia; (2) secondary or relapsed AML; (3) other hematological malignancies; (4) solid tumor; (5) positive pregnancy test or lactation. Besides, 50 patients with non-malignant proliferative hematological disorders and 50 healthy individuals were recruited as disease controls (DCs) and healthy controls (HCs), respectively. In detail, the inclusion criteria for DCs were as follows: (1) diagnosed as non-malignant proliferative hematological disorders such as thrombocytopenic purpura, aplastic anemia, or Fanconi anemia; (2) age ≥ 18 years old; (3) willing to provide PB samples. The inclusion criteria for HCs were as follows: (1) no abnormal biochemical indexes during routine health examination; (2) age ≥ 18 years old; (3) willing to provide PB samples. The exclusion criteria for DCs and HCs were similar to that of AML patients. The study received the approval from Ethics Committee of Fujian Medical University Union Hospital. All participants signed written informed consent.
2.2. Data and sample collection
Following diagnostic examinations, the demographics and disease characteristics of AML patients were recorded. The PB samples of AML patients were obtained pre- and post-induction treatment. The PB samples of DCs and HCs were collected after recruitment. After PB sample collection, the PBMC was isolated and kept at −80 °C until the laboratory test. The risk stratification of AML patients was referred to the National Comprehensive Cancer Network (NCCN) guideline (access date: January 2017, available at www.nccn.org) [Citation18].
2.3. RT-qPCR assay
The Trizol reagent (Beyotime, China) was used to extract the total RNA. The reverse transcription was then carried out using BeyoRT™ III M-MuLV Reverse Transcriptase (Beyotime, China). After that, the qPCR reaction was performed using Terra™ qPCR Direct SYBR® Premix (Takara Bio, USA). The primers were designed in accordance with a previous study [Citation17]. The relative expression of MALT1 was calculated by the 2-ΔΔCt method, where GAPDH served as an internal reference for MALT1 [Citation19].
2.4. Outcomes and follow-up
The CR of AML patients was evaluated between day 21 and day 28 following the beginning of induction treatment [Citation20]. The AML patients were followed up every 1–3 months, and the last follow-up date for AML patients was May 31, 2022. Then the event-free survival (EFS) and overall survival (OS) were calculated for analyses [Citation20].
2.5. Statistical analysis
In survival analysis, MALT1 expression in AML patients was divided as low expression (≤50th percentile), high expression (>50th percentile), quartile 1 (≤25th percentile), quartile 2 (25th-50th percentile), quartile 3 (50th-75th percentile), and quartile 4 (>75th percentile), respectively. MALT1 at post-treatment minus MALT1 at pre-treatment was used to define the MALT1 increment. The comparisons were assessed via the Kruskal–Wallis test by ranks (multiple comparisons using Dunn post hoc test), Wilcoxon signed-rank test, and Wilcoxon rank-sum test, as appropriate. The correlation was analyzed through Spearman's rank correlation test.
The Kaplan-Meier curves were used to visualize EFS and OS, and the log-rank test was used to analyze differences. The statistical analyses were calculated via SPSS v27.1 (IBM Corp., USA). The graphs were plotted via GraphPad Prism v7.01 (GraphPad Software Inc., USA). P value < 0.05 was considered significant.
3. Results
3.1. AML patients’ features
The mean age of the 90 recruited AML patients was 57.5 ± 13.1, and there were 32 (35.6%) females and 58 (64.4%) males (). The median white blood cell (WBC) and bone marrow (BM) blasts were 14.4×10⁹/L [interquartile range (IQR): 8.1×10⁹/L-29.3×109/L] and 76.0% (IQR: 64.0%−86.0%), separately. Additionally, 10 (11.1%), 24 (26.7%), 26 (28.9%), 25 (27.8%), and 5 (5.5%) patients received a French-American-Britain (FAB) categorization of M1, M2, M4, M5, and M6. In terms of risk stratification, 18 (20.0%), 45 (50.0%), and 27 (30.0%) patients were classified as favorable, intermediate, and poor risk. The detailed features of AML patients are listed in .
Table 1. Characteristics of AML patients.
3.2. MALT1 expression among AML patients, DCs, and HCs
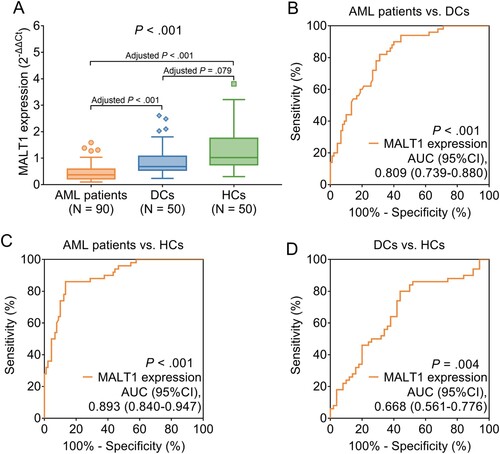
MALT1 expression differed among AML patients, HCs, and DCs (0.370 vs. 1.019 vs. 0.683, P < .001) (A). Further comparisons displayed that MALT1 expression was reduced in AML patients compared to HCs (0.370 vs. 1.019, adjusted P < .001) and DCs (0.370 vs. 0.683, adjusted P < .001), while MALT1 expression did not differ between HCs and DCs (1.019 vs. 0.683, adjusted P = .079). In addition, ROC curve analyses, MALT1 expression was found to be able to distinguish AML patients from DCs with an area under curve (AUC) of 0.809 (95% confidence interval (CI): 0.739-0.880) (P < .001) (B), AML patients from HCs with an AUC of 0.893 (95%CI: 0.840-0.947) (P < .001) (C), DCs from HCs with an AUC of 0.668 (95%CI: 0561-0.776) (P = .004) (D). These data indicated that MALT1 expression could preferably distinguish AML patients from HCs and DCs.
Figure 1. MALT1 was reduced in AML patients compared to HCs and DCs. Comparison of MALT1 expression among AML patients, DCs, and HCs (A). ROC curve analyses of MALT1 expression in distinguishing AML patients from DCs (B); AML patients from HCs (C); DCs from HCs (D).
3.3. Correlation of MALT1 expression with disease features in AML patients
Lower MALT1 expression was associated with WBC >10×109/L (>10×109/L vs. ≤10×109/L, 0.537 vs. 0.314, P = .037), elevated BM blasts quartile (quartile 1 vs. quartile 2 vs. quartile 3 vs. quartile 4, 0.544 vs. 0.416 vs. 0.293 vs. 0.269, P = .047), and poor risk stratification (favorable vs. intermediate vs. poor, 0.526 vs. 0.393 vs. 0.247, P = .020) in AML patients. However, MALT1 did not appear to be associated with age, gender, FAB classification, cytogenetics, MK mutation, FLT3-ITD mutation, isolated biallelic CEBPA mutation, NPM1 mutation, or WT1 mutation (all P > .05) ().
Table 2. Correlation of MALT1 expression with clinical characteristics in AML patients.
Further analyses displayed that both MALT1 pre-treatment (r = −0.254, P = .016) and MALT1 post-treatment (r = −0.237, P = .025) were negatively related to BM blasts in AML patients (Supplementary Figure 1 A-B). Moreover, both MALT1 pre-treatment (r = −0.222, P = .035) and MALT1 post-treatment (r = −0.207, P = .050) were negatively related to blood blasts in AML patients (Supplementary Figure 2A-B).
3.4. Longitudinal change of MALT1 expression and its correlation with induction treatment response in AML patients
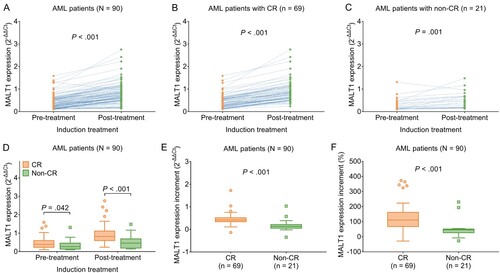
MALT1 expression was elevated during induction treatment not only in total AML patients (0.733 vs. 0.370, P < .001) (A), but also in subgroups of patients achieving CR (0.820 vs. 0.393, P < .001) (B) and those not achieving CR (0.459 vs. 0.269, P = .001) (C). Moreover, MALT1 expression before induction treatment (0.393 vs. 0.269, P = .042) as well as after induction treatment (0.820 vs. 0.459, P < .001) was both increased in AML patients with CR compared to those with non-CR (D). Furthermore, MALT1 increment (0.416 vs. 0.132, P < .001) and MALT1 increment percentage (110.6 vs. 45.6, P < .001) during induction treatment were both higher in AML patients with CR compared to those with non-CR (E-F).
Figure 2. MALT1 was elevated during induction treatment in AML patients. Comparison of pre-treatment and post-treatment MALT1 expression in total AML patients (A); in AML patients with CR (B); in AML patients with non-CR (C). Comparison of MALT1 expressions between AML patients with CR and AML patients with non-CR (D). Comparison of MALT1 expression increment (E) and MALT1 expression increment % (F) between AML patients with CR and AML patients with non-CR.
ROC curve analyses were conducted to explore the value of MALT1 expression in distinguishing AML patients with CR from those without CR. Then it was observed that both pre-treatment MALT1 expression (AUC: 0.647 (95%CI: 0.508- 0.787), P = .041) and post-treatment MALT1 expression (AUC: 0.771 (95%CI: 0.644-0.898), P < .001) could differentiate AML patients with CR from AML patients without CR (Supplementary Figure 3A-B).
3.5. Correlation of MALT1 expression with accumulating EFS and OS in AML patients
Pre-treatment MALT1 low (vs. high) (median 27.0 months vs. 43.0 months, P = .012) and pre-treatment lower MALT1 quartile (median 22.0 months vs. 42.0 months vs. 34.0 months vs. 43.0 months, P = .002) was related to a less prolonged accumulating EFS (A-B). Moreover, pre-treatment MALT1 low (vs. high) (median 50.0 months vs. not reached, P = .021) and pre-treatment decreased MALT1 quartile (median 37.0 months, vs. not reached vs. not reached vs. not reached, P = .003) were linked with a shorter accumulating OS (C-D).
Figure 3. Pre-treatment and post-treatment MALT1 low expression were linked with unfavorable survival profile in AML patients. Correlation of pre-treatment MALT1 low (vs. high) (A) and pre-treatment MALT1 quartile (B) with accumulating EFS. Association of pre-treatment MALT1 low (vs. high) (C) and pre-treatment MALT1 quartile (D) with accumulating OS. Correlation of post-treatment MALT1 low (vs. high) (E) and post-treatment MALT1 quartile (F) with accumulating EFS. Association of post-treatment MALT1 low (vs. high) (G) and post-treatment MALT1 quartile with accumulating OS (H).
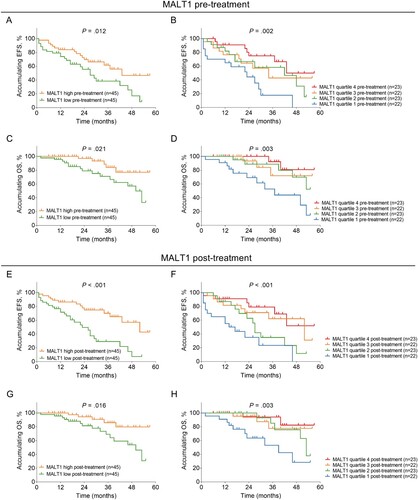
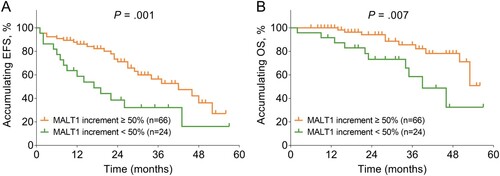
In terms of the relationship between post-treatment MALT1 expression and survival profile, post-treatment MALT1 low (vs. high) (median 23.0 months vs. 52.0 months, P < .001) and post-treatment lower MALT1 quartile (median 12.0 months vs. 27.0 months vs. 57.0 months vs. not reached, P < .001) were associated with unsatisfied accumulating EFS (E-F). Also, post-treatment MALT1 low (vs. high) (median 50.0 months vs. not reached, P = .016) and post-treatment decreased MALT1 quartile (median 39.0 months vs. 53.0 months vs. not reached vs. not reached, P = .003) were correlated with deteriorative accumulating OS (G-H). Furthermore, MALT1 increment < 50% was related to reduced accumulating EFS (median 14.0 months vs. 42.0 months, P = .001) and OS (median 39.0 months vs. not reached, P = .007) in AML patients (A-B).
Figure 4. MATL1 increment < 50% was related to shorter accumulating EFS and OS in AML patients. Relationship between MALT1 increment < 50% (vs. increment ≥ 50%) and accumulating EFS (A) as well as accumulating OS (B).
4. Discussion
Although MALT1 is overexpressed in ALL patients and non-Hodgkin lymphoma patients, its expression and correlation with disease features in AML patients have been reported infrequently [Citation15–17]. One previous study reports that MALT1 wild-type expression in CD3+ T cells is downregulated, while its variant 1 expression is increased in AML patients compared to HC [Citation21]. As a result, the present study was carried out to address this issue. Then, it was observed that PBMC MALT1 expression was reduced in AML patients compared to DCs and HCs. Moreover, PBMC MALT1 expression could preferably differentiate AML patients from HCs and DCs, which could be explained as that: (a) MALT1 downregulation might promote the proliferation of leukemia cells while inhibiting apoptosis via activation of the NF-κB pathway; thus, lower MALT1 expression has been linked to AML risk [Citation11,Citation13,Citation14]. (b) reduced MALT1 expression caused an imbalance of Th1/Treg, further leading to the aberrant T-cell response, which further impaired the anti-leukemia activity; thus, reduced MALT1 expression was more susceptible to AML [Citation22–24].
In the current study, it was also discovered that lower PBMC MALT1 expression was related to WBC >10×109/L and poor risk stratification in AML patients. The possible explanations for these findings included: (a) lower MALT1 expression caused the aberrant Th cell function and further impaired the T cell response, potentially increasing the risk of pathogens infection, which further resulted in WBCs overproduction and elevated WBC counts in AML patients [Citation25]. (b) as mentioned earlier, downregulated MALT1 might promote leukemia cell proliferation, thus leading to enhanced BM blasts in AML patients [Citation11,Citation13,Citation14]. (c) reduced MALT1 was linked with elevated WBC count and absence of CR after induction therapy, where the latter two features were both categorized as factors relating to poor risk stratification in AML patients; thus, MALT1 was related to poor risk stratification in AML patients. These data suggested that MALT1 measurement in blood samples could certainly implicate AML features.
Unfortunately, limited study investigates the relationship between MALT1 expression and treatment response in hematological disease patients, particularly in AML patients. Therefore, it was discovered in the current study that PBMC MALT1 expression was elevated during induction therapy, and its increment was related to CR in AML patients, which could be explained as follow: (a) the increase of MALT1 expression during induction therapy was related to a reduction of BM blasts, further correlating with better response in AML patients [Citation26,Citation27]. (b) MALT1 formed the CBM signalosome complex and further impaired the DNA damage in leukemia cells via the NF-κB pathway while receiving doxorubicin (one common chemotherapy agent used in induction therapy); thus, its increment during induction therapy was related to CR in AML patients [Citation28,Citation29].
Furthermore, the relationship between MALT1 and survival profile in AML patients is of great interest. In order to comprehensively evaluate the prognostic value of PBMC MALT1 expression, the association of pre-treatment MALT1, post-treatment MALT1, and MALT1 increment with accumulating EFS as well as accumulating OS in AML patients were analyzed. Then, it was discovered that both pre-treatment and post-treatment MALT1 low were related to shorter accumulating EFS as well as OS in AML patients, while the post-treatment one seemed to correlate with survival profile more obviously. Furthermore, MALT1 increment < 50% during induction therapy was also linked with a declined accumulating EFS and OS. The possible explanation for these findings was that downregulated MALT1 expression caused an impaired T cell response through multiple mechanisms and further reduced the anti-leukemia activity of T cells, leading to an unfavorable survival profile in AML patients [Citation22,Citation23,Citation28,Citation29]. These findings suggested that PBMC MALT1 deficiency at any time point, particularly after induction therapy treatment could preferably estimate the survival profile in AML patients.
The current study detected the MALT1 expression in PBMC instead of BM samples in AML patients despite the accuracy of BM samples, and the reasons were as follows: (i) previous studies reported the dysregulation of MALT1 from BM samples in leukemia patients, also the TCGA database uploaded many RNA sequencing data from BM samples in leukemia patients including MALT1; therefore detection of MALT1 expression in BM samples was not novel; (ii) MALT1 was involved in the development and differentiation of T cells through multiple signaling pathways (such as the NF-κB pathway, TCR pathway, etc.) to further participates in leukemia pathogenesis [Citation12–14]; thus MALT1 dysregulation might exhibit its effect on leukocytes in the peripheral blood, and we detected PBMC MALT1 aiming to reveal this in AML patients; (iii) the PBMC samples were more convenient and feasible to obtain, which might also provide evidence for monitoring disease progression in AML patients; (iv) the current study also enrolled DCs and HCs, and BM samples from DCs and HCs might be not appropriate to obtain.
The small sample size served as one limitation in the current study; thus, some conclusions might be insufficient to be drawn and should be interpreted with caution. Besides, this was a single-center study and might cause regional bias, and further multi-center studies were warranted. Furthermore, MALT1 expression in ALL patients should be detected in future studies to determine its difference between AML patients and ALL patients.
In conclusion, PBMC MALT1 deficiency is common and relates to unfavorable induction therapy response and survival profile in AML patients.
Disclosure statement
No potential conflict of interest was reported by the author(s).
Additional information
Funding
References
- Pelcovits A, Niroula R. Acute myeloid leukemia: a review. R I Med J. 2020 Apr 1;103(3):38–40.
- Siegel RL, Miller KD, Fuchs HE, et al. Cancer statistics, 2021. CA Cancer J Clin. 2021 Jan;71(1):7–33.
- Shallis RM, Wang R, Davidoff A, et al. Epidemiology of acute myeloid leukemia: recent progress and enduring challenges. Blood Rev. 2019 Jul;36:70–87.
- Kantarjian H, Kadia T, DiNardo C, et al. Acute myeloid leukemia: current progress and future directions. Blood Cancer J. 2021 Feb 22;11(2):41.
- Ciftciler R, Demiroglu H, Haznedaroglu IC, et al. Impact of time between induction chemotherapy and complete remission on survival outcomes in patients with acute myeloid leukemia. Clin Lymphoma Myeloma Leuk. 2019 Nov;19(11):729–734.
- Yoo KH, Kim HJ, Min YH, et al. Age and remission induction therapy for acute myeloid leukemia: an analysis of data from the Korean acute myeloid leukemia registry. PLoS One. 2021;16(5):e0251011.
- Thol F, Ganser A. Treatment of relapsed acute myeloid leukemia. Curr Treat Options Oncol. 2020 Jun 29;21(8):66.
- Lork M, Staal J, Beyaert R. Ubiquitination and phosphorylation of the CARD11-BCL10-MALT1 signalosome in T cells. Cell Immunol. 2019 Jun;340:103877.
- Rosenbaum M, Gewies A, Pechloff K, et al. Bcl10-controlled Malt1 paracaspase activity is key for the immune suppressive function of regulatory T cells. Nat Commun. 2019 May 28;10(1):2352.
- Martin K, Touil R, Kolb Y, et al. Malt1 protease deficiency in mice disrupts immune homeostasis at environmental barriers and drives systemic T cell-mediated autoimmunity. J Immunol. 2019 Dec 1;203(11):2791–2806.
- Ishikawa C, Mori N. MALT-1 as a novel therapeutic target for adult T-cell leukemia. Eur J Haematol 2020 Oct;105(4):460–467.
- Dumont C, Sivars U, Andreasson T, et al. A MALT1 inhibitor suppresses human myeloid DC, effector T-cell and B-cell responses and retains Th1/regulatory T-cell homeostasis. PLoS One. 2020;15(9):e0222548.
- Wang R, Zhang H, Xu J, et al. Malt1 inhibition as a therapeutic strategy in T-cell acute lymphoblastic leukemia by blocking Notch1-induced NF-κB activation. Front Oncol. 2020;10:558339.
- Saba NS, Wong DH, Tanios G, et al. Malt1 inhibition is efficacious in both naïve and ibrutinib-resistant chronic lymphocytic leukemia. Cancer Res 2017 Dec 15;77(24):7038–7048.
- Ma Y, Liao Z, Xu Y, et al. Characteristics of CARMA1-BCL10-MALT1-A20-NF-κB expression in T cell-acute lymphocytic leukemia. Eur J Med Res 2014 Nov 11;19:62.
- Xu Y, Hu J, Wang X, et al. Overexpression of MALT1-A20-NF-κB in adult B-cell acute lymphoblastic leukemia. Cancer Cell Int. 2015;15:73.
- Wang X, Xu Y, Liang L, et al. Abnormal expression of A20 and its regulated genes in peripheral blood from patients with lymphomas. Cancer Cell Int. 2014;14:36.
- NCCN clinical practice guidelines in oncology on acute myeloid leukemia version 1. (2017). (available at www.nccn.org).
- Livak KJ, Schmittgen TD. Analysis of relative gene expression data using real-time quantitative PCR and the 2−ΔΔCT method. Methods. 2001 Dec;25(4):402–408.
- Dohner H, Estey EH, Amadori S, et al. Diagnosis and management of acute myeloid leukemia in adults: recommendations from an international expert panel, on behalf of the European LeukemiaNet. Blood. 2010 Jan 21;115(3):453–474.
- Shi L, Chen S, Lu Y, et al. Changes in the MALT1-A20-NF-κB expression pattern may be related to T cell dysfunction in AML. Cancer Cell Int. 2013 Apr 30;13(1):37.
- Gehring T, Erdmann T, Rahm M, et al. Malt1 phosphorylation controls activation of T lymphocytes and survival of ABC-DLBCL tumor cells. Cell Rep. 2019 Oct 22;29(4):873–888 e10.
- Cheng J, Klei LR, Hubel NE, et al. GRK2 suppresses lymphomagenesis by inhibiting the MALT1 proto-oncoprotein. J Clin Invest. 2020 Feb 3;130(2):1036–1051.
- Dai B, Grau M, Juilland M, et al. B-cell receptor-driven MALT1 activity regulates MYC signaling in mantle cell lymphoma. Blood. 2017 Jan 19;129(3):333–346.
- Lu HY, Turvey SE. Human MALT1 deficiency and predisposition to infections. Curr Opin Immunol. 2021 Oct;72:1–12.
- Shafat MS, Gnaneswaran B, Bowles KM, et al. The bone marrow microenvironment - home of the leukemic blasts. Blood Rev. 2017 Sep;31(5):277–286.
- Percival ME, Lai C, Estey E, et al. Bone marrow evaluation for diagnosis and monitoring of acute myeloid leukemia. Blood Rev. 2017 Jul;31(4):185–192.
- Zhang S, Pan D, Jia XM, et al. The CARMA3-BCL10-MALT1 (CBM) complex contributes to DNA damage-induced NF-κB activation and cell survival. Protein Cell. 2017 Nov;8(11):856–860.
- Upadhyay VA, Fathi AT. Induction chemotherapy in acute myeloid leukaemia. Curr Opin Hematol. 2018 Mar;25(2):67–74.