
 ?Mathematical formulae have been encoded as MathML and are displayed in this HTML version using MathJax in order to improve their display. Uncheck the box to turn MathJax off. This feature requires Javascript. Click on a formula to zoom.
ABSTRACT
Air pollution is globally rising, especially in low- and middle-income countries, due to rapid urbanization. In hot arid environments like Egypt, adequate outdoor ventilation is required to aid in the removal of heat and pollutants and provide healthy living environments. In this context, the current research analyses the urban ventilation of typical Egyptian housing layouts using a simulated multi-directional approach. It is significant because few studies on evaluating urban ventilation of housing prototypes were undertaken in Egypt, and the approaches used were employed in nearly no relevant research in the region. Linear parallel, clustered, dot, and clustered-shifted patterns were investigated. Eight wind directions were analyzed to assess five parameters: 1) wind velocity, 2) age of air (aoa), 3) airflow, 4) pressure coefficient (cp) and 5) comfort index. An automated toolkit that enables the simultaneous simulation of several wind directions was employed. It consists of Eddy3D, a validated Grasshopper tool that uses OpenFOAM’s RANS models. The results showed that best velocities were found in the linear-parallel-unaligned and clustered layouts, directions NNE and N. The latter exhibited favorable airflow within its courtyards. In addition, wind directions had little influence on aoa, as did the layout pattern. Uncomfortable wind was greater in the clustered layout and lowest in the clustered-shifted layout. Except for ENE direction, cp was in opposition with ventilation, since W and WNW directions witnessed the greatest cross-ventilation potential. While linear-parallel-unaligned and clustered layouts created optimum ventilation and allowed outdoor activities, they require more research to increase cp and reduce uncomfortable winds.
Introduction
Cities presently house more than 50% of the world’s population, with that percentage expected to increase to 70% by 2050 [Citation1]. At the same time, global air pollution is rising, especially in low- and middle-income countries, due to rapid urbanization and economic growth that depend on the combustion of fossil fuels [Citation2]. In hot arid countries like Egypt, adequate airflow is required to remove heat and pollutants from the air, limiting the formation of urban heat islands and improving thermal comfort and human health [Citation3–5]. Research on the influence of urban morphology on ventilation revealed that layout patterns and orientations relative to wind direction influence wind behavior and performance [Citation4–12]. From the 1950s to present, Greater Cairo witnessed four distinct eras of public housing projects, each adopting unique and drastically varied layout patterns (discussed in detail in Areas of study). These projects are known as Abdel Nasser’s popular housing (1950s-1960s), El Sadat’s satellite cities Housing (1970s-1990s), Mubarak’s National Housing Project (1990s-2010s) and El Sisi’s housing projects (2014s – Present). The first era featured linear parallel layouts (aligned and unaligned, defined after Jiang, Wu [Citation10]); the second, clustered (courtyarded) layouts (defined after Golany [Citation9] and Fahmy and Sharples [Citation13]); the third, dot or disperse layout (defined after Golany [Citation9] and Fahmy and Sharples [Citation13]); and the present era features clustered-shifted layouts (with large courtyards). The current study compares the performance of urban ventilation in four layout patterns typical of Cairo’s housing projects, utilizing prevailing winds to determine which performs better in which orientation. A computational fluid dynamics (CFD) toolkit that features a cylindrical meshing domain and allows a multi-directional wind simulation was employed. Eight wind directions were simulated in order to assess five ventilation parameters: 1) wind velocity, 2) age of air (aoa), 3) airflow pattern, 4) wind pressure coefficient and 5) annual wind comfort.
Literature review
The relationship between urban layout patterns and its impact on outdoor ventilation performance was explored in a number of studies. Asfour [Citation6] used CFD to study the effect of grouping patterns on outdoor wind. The research was conducted in Gaza, a semi-humid Mediterranean region with long hot summers. He tested six patterns in three wind directions. The first layout had two parallel rows of blocks. The second and third layouts were U-shaped with center space (courtyard) with open upstream and downstream sides. The fourth design represented a staggered pattern with a central space. The fifth design had a square central space, divided in the sixth design into four zones. The U-shaped central space with upstream opening side (2nd pattern) had the best natural ventilation potential, while the square central space divided into four zones (6th pattern) had the lowest. In general, buildings organized around a central area with a windward opening side facing the wind provide improved ventilation. Recent research by Jiang, Wu [Citation10] in Wuhan, a city known for its high temperatures and humidity, examined the interaction between residential building layouts and external wind and thermal environments. The ENVI-met model was used to determine air velocity and temperature at pedestrian level. The prevailing wind is from the south. The layout patterns were classified as aligned parallel, east – west staggered, north – south staggered, parallel with central open space, enclosed, and enclosed with central open space layouts. The parallel layout with a center open space performed best in ventilation followed by the aligned parallel arrangement. The buildings didn’t obstruct airflow, and the central space allowed for smooth wind circulation. The first layout had no central space but the side-by-side buildings formed a ventilation corridor, enhancing east-west wind circulation and speeds. Worst wind environment was the enclosed layout with central open space, because the longitudinal windward buildings obstructed airflow to the middle space. A research by Ying, Wang [Citation5] investigated the relationship between four common office building layouts in Hangzhou and outdoor wind environment, using CFD. The layouts (enclosed courtyard(s) with cavities) were divided into two types: multi-yard (M) and overall courtyard (O). On the basis of this, they classified them into parallel opening and returning shape opening (M-p, M-r, O-p, O-r). The results showed that the multi-yard type had better natural ventilation than the overall courtyard type. The natural ventilation of the multi-yard with parallel opening (lateral cavities, M-p) was best, while the overall courtyard with returning shape opening (perpendicular cavities, O-r) was worst.
In Egypt, limited research has been done on airflow surrounding prototype housing neighborhoods in the last decade [Citation8]. Three urban patterns were explored by Fahmy and Sharples [Citation13] in Cairo utilizing thermal analysis and CFD: high-density compact, medium-density clustered-dot and low-density dot (disperse). Their findings show that the first layout is better thermally, but lacks wind access, preventing heat dissipation from the streets at night and causing poor environmental conditions. The second design provides adequate wind and sun access for passive cooling and wellbeing. Its excessive sun radiation exposure can be mitigated by greenery and urban trees. While the third plan allows for easy wind movement, it is particularly exposed to direct sunlight and requires more trees and shade components. They found the clustered-dot pattern to have the best environmental performance. DeKay and Brown [Citation14] also suggested that smaller open spaces distributed uniformly throughout a neighborhood will be more efficient at cooling than large parks, which was further confirmed by the study of Ying, Wang [Citation5]. Elgamal [Citation7] used numerical simulations (ENVI-met) to measure and model the relationship between urban wind speed and urban geometry in four districts in Cairo, Egypt: Garden City (curvilinear), Downtown (radial), Nasr City (grid) and Old Cairo (compact organic). Except for Garden City, which was studied in detail, results were based on one virtual receptor point per area. AbdelRahman, Moustafa [Citation3] addressed indoor ventilation performance in low-income housing prototypes in Egypt using CFD. He found out that facades should be carefully designed because they affect pressure values on the windward and leeward elevations and consequently potential cross ventilation.
Methods
Areas of study
Linear housing pattern (Nasser’s era)
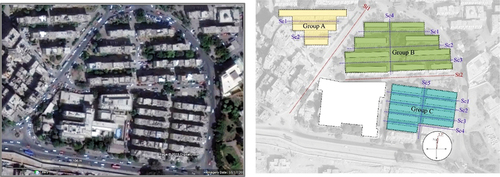
The Gamal Abdel Nasser-led revolution of 1952 changed Egyptian society and housing architecture. The combination of rising population, public sector employment, new rural migrant settlements, deteriorating conditions of existing ones and a shrinking rental market resulted in a serious housing shortage [Citation15,Citation16]. In response, the Egyptian government built subsidized public housing developments for low- and middle-income Egyptians [Citation17]. During this period, apartment buildings of five or six stories were built to replace slum areas [Citation17,Citation18]. A typical block of the time consisted of 4–6 floors apartment buildings placed in compact linear parallel rows [Citation19]. In this study, Zeinhom Housing in east of Cairo was observed (). The area is composed of rectangular blocks organized in linear-parallel-unaligned and linear-parallel-aligned rows as follows: Group A, with parallel blocks of various lengths, from longer (northern) to shorter (southern); Group B, with parallel blocks but varying in length from shorter (northern) to longer (southern) and Group C, which consists of shorter parallel blocks (slightly oblique to north).
Figure 1. Linear-parallel layouts of Nasser’s popular housing (1956–1970). Left, Zeinhom area of study (google earth pro 7.3, coord. 30.021519569282766, 31.24426831474131); right, streets and block types.
Clustered housing pattern (Sadat’s era)
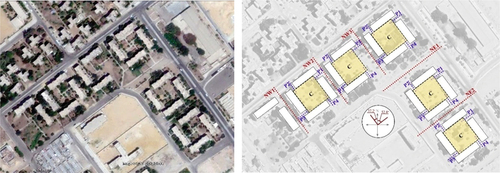
Reduced public housing construction has resulted in significant housing shortages. For the conflict with Israel, the Egyptian military acquired the majority of the country’s resources [Citation20]. Rent controls, private sector constraints and persistent rural migration into Cairo resulted in reduced housing production and the construction of informal settlements on agricultural lands on Cairo’s outskirts [Citation21,Citation22]. Sadat’s open-door policy (Infitah), which welcomed private investment, increased this phenomenon [Citation23]. Sadat expanded Nasser’s plan for new satellite cities to include at least 14 more cities in Cairo’s outskirts [Citation15]. This era had seen the introduction of medium-density housing, clustered around a courtyard [Citation13,Citation19]. District 6 (El-Sades) in October City, west of Cairo, was examined (). It features central courtyards surrounded by four 5-storey linear blocks, with four narrow pathways leading to them. Buildings are oblique to North.
Figure 2. Clustered layouts of Sadat’s satellite cities housing (1970–1981). Left, El-El-Sades area of study (google earth pro 7.3, coord. 946540078096923, 30.911987752655293); right, streets and clusters.
Dot housing pattern (Mubarak’s era)
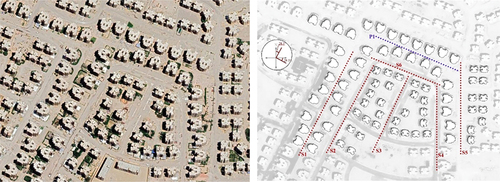
Mubarak had a similar housing program to Sadat in the 1980s: public housing, private investment and development of new cities. For a 5-year period from 2005 to 2011, the government launched the ‘National Housing Project’ and during this time period, the dot layout was adopted, featuring walk-up, free-standing apartment buildings with no more than six stories [Citation19,Citation24]. In this study, the National Housing Project’s 63 m2 prototype located in 6th of October City, west of Cairo, is examined (). It consists of 5-story walk-ups arranged in a dot pattern aligned with the streets and oblique to the north, with few rows oriented to the north. The dot pattern created a variety of street widths as well as passages between the buildings.
Figure 3. Dot layout in Mubarak’s National housing Project (1981–2011). Left, 63 m2 prototype’s area of study (google earth pro 7.3, coord. 29.910693358604988, 30.940886257338473); right, streets and buildings.
Clustered-shifted housing pattern (El Sisi’s era)
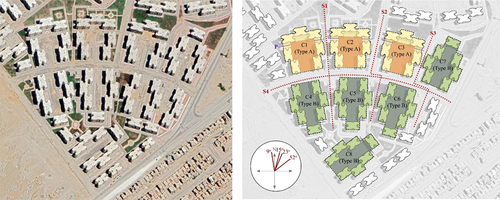
Since Mubarak’s stepping down in 2011, the government has continued to build and deliver previously designated housing units. Simultaneously, a new generation of cities is being implemented next to Egyptian cities and older satellite ones. For low-, middle- and upper-income families, President El Sisi (since 2014) created four housing tracks: Social Housing, targeting low-income people; ‘Sakan Masr’ or Shelter of Egypt, a gated community (tree fence) targeting all layers of society; the more expensive gated communities ‘Dar Masr’ or House of Egypt (upper middle and luxurious) and ‘Janna’ or Heaven (luxurious) [Citation25]. Sakan Masr is regarded as a prototypical housing project of the era. The clustered layout is adopted, featuring 6-storey housing blocks organized around a large central courtyard. The cluster is created by connecting two to three buildings in a shifted pattern. The present research examines Sakan Masr located in 6th of October City, west of Cairo (). Every seven 6-story walk-ups are clustered around a central courtyard opened from one side and shaped by shifted attached blocks. The entire area is organized radially and features two basic cluster types: Type (A) of clusters C1–3, and Type (B) of clusters C4–8. Type A contains attached blocks on three sides of the courtyard and opens to the south. Type B has attached blocks on each side of the courtyard and one block on the north or south. Two side pathways lead to the courtyard.
Figure 4. Clustered-shifted layout in El Sisi’s housing projects (2014s – present). Left, Sakan Masr area of study (google earth pro 7.3, coord. 29.946346784682788, 30.97166395318072); right, streets and cluster types.
Climatic data
According to the Koppen-Geiger classification system, Egypt has a hot desert climate (BWh) typified by hot, dry summers from May to September, temperate winters, and little precipitation, mostly around the coasts. Summer temperatures range from 35–38° (mean daily maximum) to 16–21° (mean daily minimum). The prevailing wind directions all over Egypt are north, north east and north west and winds are particularly strong near the Red Sea (8.0–10.0 m/s) and Northern shores (6.0–6.5 m/s) [Citation26,Citation27]. The historic EnergyPlus weather data file (epw format) of the city of Cairo from 2007 to 2021 was used in the simulation and eight wind directions with the highest yearly frequencies were considered () [Citation28,Citation29].
Figure 5. Wind data of Cairo based on the climate from 2007 to 2021. Left, wind rose showing the prevailing wind directions and average speeds [Citation28]; right, wind frequencies per direction (adapted from the weather file data).
![Figure 5. Wind data of Cairo based on the climate from 2007 to 2021. Left, wind rose showing the prevailing wind directions and average speeds [Citation28]; right, wind frequencies per direction (adapted from the weather file data).](/cms/asset/e40f9225-25d2-4bee-bfe1-e3537aaf5e73/thbr_a_2285093_f0005_oc.jpg)
Simulation workflow for outdoor ventilation analysis
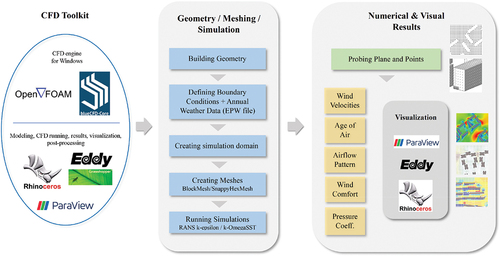
The open-source program OpenFOAM was used to conduct a constant airflow through a three-dimensional CFD study. The impacts of thermal-driven ventilation were not examined because the study focuses on wind-driven ventilation; hence, the simulations ran under isothermal circumstances. OpenFOAM includes a wide range of capabilities for solving complicated flows, and it has been validated using real-world observations as well as wind tunnel tests [Citation30]. An automated workflow that enables the carrying out of a multi-directional CFD study and its post-processing was conducted. (). It consists of the following toolkit: 1) The simulation engine OpenFOAM v.5.x; 2) BlueCFD – Core v.2017, which is a source code that makes OpenFOAM run natively in Microsoft Windows; 3) Rhinoceros 3D modeling software v.6, which was used for modeling as well as visualizing airflow patterns and annual comfort results; 4) its plugin Grasshopper (GH) v.2020, 4) Eddy3D v.0.3.8, which is the main tool that runs the whole simulation and allows for post-processing of results through GH interface and 5) Paraview software, for visualizing meshes and velocities. Building geometry was created in Rhinoceros; and Eddy3D was used to create the simulation domain including its mesh, specify boundary conditions, process the weather data, run the simulation, handle the data, and link to visual results in Paraview and Rhinoceros. Based on the annual prevailing wind, eight directions were considered and simulated: 0°, 22.5°, 45°, 67.5°, 270°, 292.5°, 315° and 337.5° (N, NNE, NE, ENE, W, WNW, NW and NNW).
Figure 6. Multi-directional CFD analysis toolkit and workflow.
Boundary conditions
Setting up and conducting a simulation for each of the eight wind directions is time consuming due to the costly nature of CFD simulations. In light of this, Kastner and Dogan [Citation31] presented and verified a cylindrical meshing approach that was used in recent research utilizing the Eddy3D user interface [Citation32–35]. The tool automates the creation of boundary conditions, following Tominaga, Mochida [Citation36] best practice, and saves substantial time for multi-directional wind analysis. According to Kastner and Dogan [Citation31] and [Citation33], lateral patches are allocated to an inlet or outlet according to the studied wind direction; the inlets are mapped to a half circle, with the outlet on the opposite part. For inlet boundary conditions (velocity u, turbulent kinetic energy k, and dissipation rate ɛ) and a roughness length z0 = 1 that refers to suburban environments, the half circular inlet was defined to a uniform profile. At the domain’s outlet, constant pressure is considered, while all remaining variables are set to zero-gradient (see ) [Citation37].
Table 1. Settings of the CFD simulation domain and boundary conditions.
Simulation domain
The simulation domain was constructed in accordance with best standards, which advise that it should not exceed a 3% blocking ratio limitation and should be six times taller than the tallest building () [Citation35]. The suggested minimum distance from the buildings to the boundaries was set to 15 times the height [Citation34]. The meshing tools snappyHexMesh and blockMesh from OpenFOAM were employed (see ). The background mesh is first created by the former and is then snapped to the building geometry by the latter. The cylindrical mesh was further enhanced using three levels of refinement inside a refinement box that surrounds the analyzed buildings [Citation31,Citation33,Citation35]. The wind directions were set to 0°, 22.5°, 45°, 67.5°, 270°, 292.5°, 315° and 337.5°; the number of iterations was set to 2000, and the weather data file (epw) of the city of Cairo from 2007 to 2021 was incorporated.
Mesh sensitivity analysis
To explore mesh sensitivity and set cell sizes, one area of study (Zeinhom Linear Housing) was simulated for one wind direction (0°). All of the CFD parameters remained the same except for the cell sizes, which were set to coarse, medium and fine meshes; the Eddy3D tool automatically selects the refinement level based on the desired cell size. shows the refinement level for mesh sizes 4 m, 3 m, 2 m, 1 m, and 0.5 m, as well as the number of iterations at the time the simulation converged and the duration it took. The results of the analysis in indicated that the profiles of wind velocities per probing point for fine meshes 0.5 m and 1 m were similar, the 2 m mesh had a comparable profile but with significantly lower velocities, and the 3 m and 4 m meshes diverged substantially from the results of fine and medium meshes. Because the convergence of the 0.5 m mesh took more than 2.6 times longer than the convergence of the 1 m mesh, with no significant difference in the number of iterations (1492 and 1311, respectively) and velocities, the latter was selected for the analysis.
Figure 7. Simulation domain of the four layout patterns.
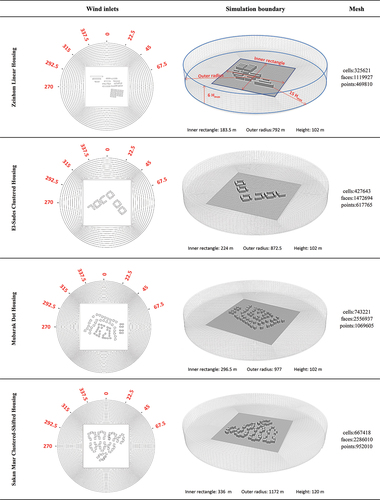
Table 2. Settings and results of the mesh sensitivity analysis.
Simulation models
Reynolds-averaged Navier Stokes (RANS) turbulence models were used to determine wind velocities, the age of the air, and pressure coefficients since the flow was assumed to be turbulent [Citation30]. Two models, k-epsilon and k-omegaSST, were used to solve these ventilation parameters.
K-epsilon model
One of the most popular turbulence models in CFD for resolving issues with natural ventilation is the standard k-epsilon. Since it was first suggested by Launder and Spalding [Citation38], it has evolved into real-world engineering flow computations [Citation39]. It has been examined in multiple studies and predicts urban mean flows under both isothermal and non-isothermal situations, generating results that are fairly precise and reasonable [Citation34]. However, it may not be suitable for thermal-driven ventilation (buoyancy) and significant heat fluctuations, which are not the focus of this study [Citation30,Citation34,Citation39]. The model uses Equations (1–3) and is based on two transport variables: the turbulence kinetic energy (k), and its dissipation rate (ϵ) [Citation39–41].
I = turbulence intensity (%), U = mean flow speed (ms−1), Cμ = model coefficient for the turbulent viscosity equal to 0.09, L = a reference length scale [m], vt = Turbulent viscosity (m2s−1)
K-omega SST model
The two-equation ‘k-omega shear stress transport’ model enhances flow prediction close to the wall. It is more suitable for calculating pressure coefficients on facades because it considers the transfer of the main shear stress in ‘adverse pressure gradient boundary layers’. Based on the transport Equations (4–5), the model employs two variables: the turbulence-specific dissipation rate (ω) and the turbulence kinetic energy (k, Equation 1) [Citation39–41].
k = turbulence kinetic energy (m2s−2) (EquationEquation 1(1)
(1) ), Cμ = model coefficient for the turbulent viscosity equal to 0.09, L = a reference length scale (m), vt = Turbulent viscosity (m2s−1)
Ventilation parameters
The RANS CFD simulation, which works as a spatial wind velocity matrix, ran for each wind direction automatically. After the analysis is finalized, Eddy3D enables post-processing by allowing the review of several parameter results through probing. A horizontal probing plane with a pedestrian height of 1.5 m was set up for post-processing data of wind velocities, age of air and annual wind comfort, while probing points were set up on the building façades to collect pressure coefficients.
Wind velocity
In conjunction with the weather data, the ‘simulations serve as a nearest neighbor lookup table of wind velocities’, and the velocity of each wind direction was calculated based on the model equations and determined for each probing point [Citation42].
Age of air
Aoa is the average time it takes for a particle to travel from an input location to a measuring location; it may be used to determine the air change and distribution efficacy in urban settings or inside the buildings [Citation43,Citation44].
Pressure coefficient
The difference of wind pressure coefficient with regard to the input condition as provided in EquationEquation (6)(6)
(6) is known as wind pressure coefficient (cp*). The pressures cp and cp,i are derived from the results of the CFD simulation, where i denotes the inlet condition. The maximum freestream velocity at the highest point of the domain is selected as the reference velocity (uref), which is primarily used to normalize the nodal pressure [Citation33].
cp = wind pressure coefficient, irefers to the inlet condition, ρ = density of air (kgm −3), uref = reference velocity (ms−1)
Wind comfort
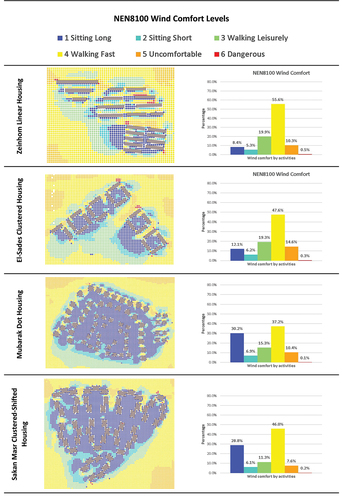
The most commonly used wind comfort indexes are Lawson, Davenport and NEN8100. They all categorize places with comfortable activities based on their linked acknowledged average wind velocities and frequency of occurrence (see Mohammadi, Tien [Citation45] and Janssen, Blocken [Citation46] for comprehensive comparisons). Significant advancement has been made in recent years in terms of wind comfort and safety standards. These advancements have been included into the Dutch Wind Nuisance Standard NEN8100, which is the world’s first wind nuisance standard and has shown to generate realistic and fairly reliable results. As shown in , it defines six comfort levels with a threshold wind velocity of 5 m/s [Citation47].
Table 3. NEN8100 wind comfort levels by activity [Citation47].
Results
Ventilation parameters: wind velocity, age of air and airflow
Zeinhom linear housing
The visual and post-processed numerical results of wind velocities, airflow patterns and aoa of the linear parallel (aligned/unaligned) layout are shown in , and . Wind velocities were highest in dir. 22.5°, followed by dir. 0° and 67.5°, and lowest in dir. 315°. Differences in aoa were relatively small, with 6 seconds separating the greatest and lowest aoa averages; the worst aoa was for dir. 22.5°, followed by dir. 0° and 337.5° while the best aoa was for dir. 292.5° and 315°. Wind velocities and airflow pattern results were comparable for the directions from 0° to 67.5°° on one hand, and 270° to 337.5°° on the other. Streets St1, Sc1–3 (B), and St2 had higher velocities for wind directions 0° to 67.5°, despite the fact that the last two street types were perpendicular to the wind. This is explained by St2’s triangular shape, the arrangement of short (north) to long (south) blocks in Group B, and the existence of a central space with cavities (in Gr. B), which redirected airflow into the arrays (see ). Arranging them in Group A from long to short reduced velocities in Sc1–2 (A). Airflow behavior in Group C deep arrays exhibited a typical skimming flow effect in directions 0 ° to 67.5° and improved in directions 270° to 337.5°.
Figure 8. Wind velocity profile per mesh size.
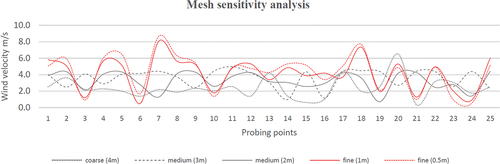
Figure 9. Wind velocities visual results.
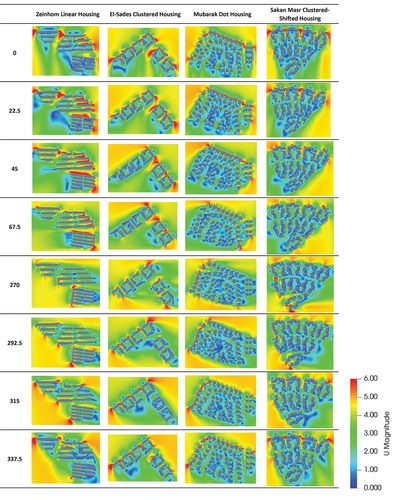
Table 4. Post-processing of wind velocities and age of air numerical results.
Table 5. Post-processing of pressure coefficient results.
It could be concluded that the unaligned linear parallel layout with a central space and two cavities (Group B’s layout) improved air circulation in this area of study. Regarding the ventilation parameters, dir. 0° to 67.5° performed better for wind velocities and airflow patterns, where dir. 22.5° and 0° performed best for velocities but worst for aoa. A balance between velocities, aoa and airflow was found in dir. 45° and 67.5°.
El-Sades clustered housing
The highest wind velocities were found in dir. 22.5°, followed by dir. 0° and 67.5°, while dir. 315° witnessed the lowest velocities. The differences between aoa for all wind directions were very small, with only 3.3 seconds between the highest and lowest average; the best performance was for dir. 0° and 22.5°, while the worst was for dir. 315°, followed by 292.5° and 67.5°. Wind velocities and airflows yielded comparable results for the four directions from 0° to 67.5°. The courtyard configuration with four cavities (P1–4) played a critical role in improving airflow, especially for the two directions 0 and 22.5°. Because the cavities served as inlets and outlets, they created a recirculating vortex within the courtyards, with merely no stagnation zones except near the buildings. This happened in all five courtyards when they were oblique to the wind, especially in directions 0°, 22.5°, and 270°. For the remaining directions, the recirculating vortex happened in certain clusters but not in others that were parallel to the wind. To summarize, clusters with all courtyards and four cavities oblique to the wind had the optimum air circulation, and dir. 0° and 22.5° performed best for all ventilation parameters (velocities, airflow, and aoa). The first showed better airflow and the latter had more favorable velocities.
Mubarak dot housing
The highest average wind velocities were recorded in dir. 22.5°, 0, 67.5°, and 45°, in that order, while the lowest averages were found in dir. 315° and 270°. Similar to El-Sades clustered pattern results, dir. 0 and 22.5° had the best aoa performances, while dir. 45° to 292.5° had the poorest aoa. However, the changes in aoa across all wind directions were minor, with 4.5 seconds separating the highest and lowest averages. Despite the fact that the dot layout is known to increase wind exposure and may be used where ventilation takes precedence over sun screening [Citation9,Citation13], this area had low wind velocities except at the inlets (start of streets and walkways) due to a Venturi effect [Citation48]. For all wind directions, insufficient air circulation was caused by the opposite two building rows that surrounded the area, which created a blocking wall effect for the inner areas and streets. It was observed that air reached the facades in streets oblique to wind direction, such as S1–2 dir. 0°, but not in streets parallel to wind direction, such as S4–5 dir. 0°. The dot layout allowed air to flow in practically any direction, with turbulent behavior around windward blocks, penetrating upwind in-between spaces and major streets (particularly S1 and S5) and guided by buildings, which altered wind directions. In summary, dir. 22.5° and 0° performed best for wind velocities and aoa, with the first having more favorable velocities; all wind directions had comparable airflow patterns; and the dot arrangement hindered adequate ventilation because the building rows were not alternately organized.
Sakan masr clustered-shifted housing
The highest wind velocities were noticed in dir. 22.5°, followed by dir. 0°, 67.5°, and 45°; the lowest velocities were found in dir. 315° and 270°, in that order. The differences in aoa were very small in all directions, with only 1.5 seconds separating the highest and lowest values. Dir. 67.5° performed the best in terms of aoa, followed by dir. 45°, 22, and 0; whereas dir. 270° and 315° had the worst aoa performance. Streets S1–3 acted as air inlets in dir. 0 to 67.5°. Street S4 witnessed good air velocities despite being perpendicular to the wind, most likely due to its intersection with major upwind streets and the clustered-shifted arrangement that guided air circulation around the blocks. In the other four wind directions, the same street, S4, served as an air inlet. Despite featuring lateral cavities (pathways), most of the clusters (Types A and B) had poor ventilation, with low velocities and multiple stagnation zones. Except in clusters C7 and C8 (Type B), a recirculating vortex inside the large courtyards did not develop as frequently as in El-Sades clustered layout. Air penetrated successfully via the lateral cavities in these two clusters, particularly C7, aided by the oblique orientation, short windward block and shifting pattern (see ). The two lateral cavities seen in C4–6 aided airflow by acting as air exits. Because of the opening of the U-shaped courtyards and streets (S1–3) onto the transversal street S4, wind flowed into the clusters. In summary, dir. 22.5° had better wind velocities, dir. 67.5° had better aoa, and oblique clusters with U-shaped upwind courtyards and lateral inlets had enhanced air circulation in the majority of wind directions.
Annual wind comfort
As shown in , the number of probing points with yearly dangerous wind was fairly low, 0.5% in Zeinhom linear layout, 0.3% in El-Sades clustered layout, 0.2% in Sakan Masr shifted-clustered layout, and 0.1% in Mubarak dot layout. El-Sades had the highest percentage of uncomfortable wind, 14.6% of its area, Mubarak and Zeinhom were nearly equal, 10.4% and 10.3%, respectively, while Sakan Masr had the lowest, 7.6%. While dangerous and uncomfortable winds were detected in the arrays of Zeinhom’s linear layout, in the remaining three aeras, they primarily occur in the main streets, building corners and wind inlets rather than the courtyards and inner areas (see layouts in ). For other comfort levels, Zeinhom and El-Sades areas were more suitable for walking leisurely (19–20%), while Mubarak and Sakan Masr areas were better suited for sitting long in most parts (30%). When the layouts in were examined, it was discovered that Zeinhom linear arrays allowed for several activities and the courtyards of El-Sades layout were ideal for sitting long, with additional spaces suitable for sitting short. The ‘walking fast’ appropriateness happened primarily outside of the layouts analyzed.
Figure 10. Airflow results.
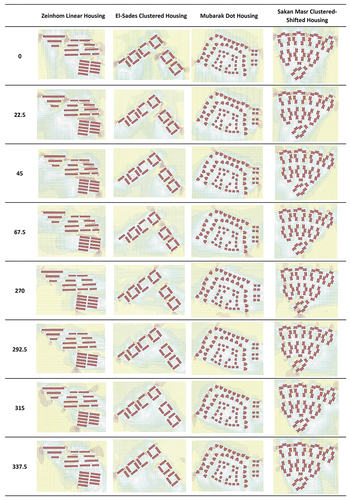
Figure 11. Annual wind comfort visual and numerical results.
Pressure coefficient
The pressure coefficient data, which indicate the potential for cross ventilation inside buildings, are depicted in . The results of cp for Zeinhom linear pattern showed variances between the average cp per wind direction. Dir. 292.5° and 270° performed the best in terms of cross-ventilation potential; the number of probing points with yearly positive coefficients nearly equaling the number of probing points with yearly negative coefficients, with an average of −0.01 and −0.02, respectively. It was discovered that these directions are perpendicular to the buildings’ shorter sides, implying that only units in the corners would benefit from cross-ventilation if windows were present in these facades. In the majority of units in this housing type, however, openings are only found on the long facades. Dir. 67.5° and 315° showed good cp results (−0.05). In dir. 337.5° (−0.10), 45° (−0.12), 0° (−0.14), and 22.5° (−0.14), negative coefficients outnumbered positive coefficients, where only windward facades would experience good cross-ventilation. In El-Sades area, the best performance was in wind directions 67.5°, 270° and 45° (−0.05 to −0.065); followed by 292.5°, 22.5°, 315° and 337.5°, which had similar values (between −0.08 and −0.09). The worst coefficients were for dir. 0° (−0.1). This means that the favorable circulating vortex did not fully succeed to reach the facades oblique to wind, inside and outside the courtyards. Mubarak area’s cp showed a profile similar to El-Sades area as the best performance was in dir. 67.5°, 270° and 292.5° (−0.3 to −0.04). The worst coefficients were for dir. 0° and 337.5° (−0.08), and slightly better figures were found in dir. 22.5°, 45° and 315° (−0.06 to −0.07). Similar to Zeinhom area, Sakan Masr had the best pressures in dir. 270°, 292.5° and 67.5° (−0.04 to −0.05). Cp averages in dir. 45°, 315° and 337.5° ranged between −0.06 and −0.07 and the worst pressures were in dir. 0 (−0.09) and 22.5° (−0.08).
Table 6. Comparison between ventilation parameters across all analyzed layout patterns.
The cp values for all areas were found to be in contrast with the ventilation parameter data, implying that directions with the best velocities and airflow patterns had low cp and cross-ventilation potential, and vice versa. The wind direction 67.5° demonstrated a balance between ventilation and pressure coefficients in all studied areas. However, it is believed that with some design alterations, the pressure coefficient results and cross-ventilation potential of dir. 0° and 22.5°, which showed the best velocities and airflow patterns, could be improved.
Discussion
All patterns had the same profile of wind velocities, which shows consistency in the ventilation performance per wind direction (see comparative results in ). Dir. 22.5° had higher averages across all layout patterns, followed by 0° and 67.5°, while 315° had the lowest averages. The best performance was found in Zeinhom’s linear and El-Sades’s clustered patterns for wind direction 22.5° with the highest averages of 2.3 m/s and 2.2 m/s, respectively. Although known to boost ventilation [Citation9,Citation13], the dot pattern of Mubarak Housing had the worst performance for this wind direction (1.86 m/s). As previously stated, the two building rows enclosing this area produced a blocking wall effect for the inner parts, which, if organized alternately, may most likely have enhanced ventilation. Sakan Masr’s clustered-shifted pattern came third (1.91 m/s) despite its large courtyards. The findings of DeKay and Brown [Citation14] and Ying, Wang [Citation5] suggest that layouts with small courtyards (e.g. El-Sades area) perform better that layouts with large courtyarded layouts, which is confirmed by the present study.
When comparing the aoa, Zeinhom and El-Sades areas showed best performance, ranging between 53s-58s, and 60s-63s, with a yearly average of 55.5s and 61s, respectively. Mubarak area ranged between 75s and 79.5s, while Sakan Masr between 76s and 78s, with the latter showing the worst results. Their yearly averages were 77.5s and 77.3s, respectively. Wind directions did not have a significant effect on the aoa results as did the layout configuration because for each studied area, the difference between the highest and lowest aoa was relatively small across all wind directions.
Airflow patterns () improved when Zeinhom linear parallel layouts were unaligned (staggered) and incorporated a central space with two cavities (see Group B). Jiang, Wu [Citation10] investigated a similar configuration and also discovered that it enhanced ventilation. El-Sades courtyard configuration with four unaligned cavities boosted airflow significantly especially when oblique to the wind in the two directions 0° and 22.5°. This is due to the cavities acting as inlets and outlets. DeKay and Brown [Citation14], Ok, Yasa [Citation49], and Ying, Wang [Citation5] all emphasized the role of oblique orientation and lateral cavities in courtyards. As explained earlier, Mubarak dot arrangement did not provide the best ventilation performance as suggested by Fahmy and Sharples [Citation13] and Golany [Citation9]. Because the building rows were not organized in an alternating manner, they hindered airflow. Despite the low wind velocities of Sakan Masr’s clustered-shifted layout, it was observed that oblique clusters with U-shaped upwind courtyards and lateral inlets had better airflow patterns in the majority of wind directions, which confirms the findings of Asfour [Citation6] and Javanroodi, Mahdavinejad [Citation50].
In all analyzed layouts, areas with annual dangerous wind ranged from 0.1% to 0.5% when according to NE8100 index ( and ). Uncomfortable wind varied from 7% to 14%, with Sakan Masr having the lowest and El-Sades having the highest, particularly in large areas between blocks or clusters and around some corners, which may be avoided in future designs. The linear arrangement of Zeinhom created a variety of results within its arrays, ranging from their suitability for long and short sitting to walking leisurely and fast. The clustered pattern of El-Sades allows for leisurely walking around clusters, as well as sitting long and sitting short inside the courtyards, whereas the wind blockage effect of Mubarak’s dot pattern and Sakan Masr’s large shifted courtyards made them comfortable for sitting long in most of their parts.
Regarding wind pressure coefficients, shown in , the linear pattern of Zeinhom housing had the best cross-ventilation potential for directions 292.5° and 270°, followed by Mubarak for directions 270°, 292.5° and 67.5°. Sakan Masr came in third place for directions 292.5° and 270°, followed by El-Sades for directions 67.5°. However, annual averages revealed that Mubarak and Sakan Masr had slightly higher façade pressures (−0.06) than Zeinhom and El-Sades (−0.08), with no great difference. This is explained by the wall blocking effects that occur in the first two areas for most wind directions, as well as the lack of recirculating vortexes inside Sakan Masr’s courtyards due to hindered airflow.
As previously indicated, when observing Zeinhom results of the pressure coefficient on facades and airflow patterns in the aforementioned directions, a great potential for cross-ventilation occurred in the short sides of buildings, causing the majority of buildings to miss out on this benefit. Dir. 22.5°, which had the best ventilation performance, did not have the best cross-ventilation potential since strong wind pressures were only experienced by front raws and the wind moved parallel to many facades in most arrays. Using staggered linear arrays for the entire area, as in Group B, and adjusting the angles between them, as in Group C’s first row, could improve rear façade pressures for dir. 22.5°. Furthermore, it appears that El-Sades clustered pattern, despite showing favorable airflow with a recirculating vortex clearly reaching the facades inside the courtyard, requires modification to have more positive pressures.
In summary, the best wind velocities, lowest aoa and boosted airflow patterns were seen in Zeinhom linear housing and El-Sades clustered housing. They need more investigation and modeling for wind directions 0° and 22.5° to see if changes in urban design aspects can help improve their low cp and cross-ventilation potential. Simultaneously, while they established their suitability for a variety of activities, lowering dangerous and uncomfortable winds on major streets and arrays should be taken into account. A full performance analysis also necessitates a thermal assessment.
Conclusion
From the 1950s to present, Greater Cairo, Egypt, witnessed four distinct eras of public housing projects, known as: Abdel Nasser’s popular housing, El Sadat’s satellite cities Housing, Mubarak’s National Housing Project, and El Sisi’s housing projects. The first era featured linear parallel layouts (aligned and unaligned); the second, clustered layouts (courtyarded); the third, dot (disperse) layouts; and the present era features clustered-shifted layouts (large courtyards). Using a fully automated CFD toolkit that allows a multi-directional analysis with a cylindrical domain, the current study compared the performance of urban ventilation in four layout patterns typical of these eras. And based on the annual prevailing wind, eight directions were considered and simulated: 0°, 22.5°, 45°, 67.5°, 270°, 292.5°, 315°, and 337.5°. Five ventilation parameters were assessed: 1) wind velocity, 2) age of air (aoa), 3) airflow pattern, 4) wind pressure coefficient and 5) yearly wind comfort index.
The CFD toolkit consists of the simulation engine OpenFOAM; its source code BlueCFD; Rhinoceros 3D modeling software; its plugin Grasshopper; Eddy3D, which is the main tool that runs the simulation and allows for post-processing of results through GH interface; and Paraview visualization software. Ventilation parameters were solved based on the two RANS models, k-epsilon and k-omegaSST and wind comfort levels were evaluated following the Dutch Wind Nuisance Standard NEN8100. When observing the results of each studied area and compare them in respect to the eight wind directions, the following could be concluded:
Summary of results
In the unaligned (staggered) linear parallel layout, dir. 22.5° and 0° performed best for velocities but worst for aoa. A balance between velocities, aoa and airflow performances was found in dir. 45° and 67.5°. The results of cp (pressure coefficient on facades) for Zeinhom showed variances between the average cp per wind direction. Dir. 292.5° and 270° performed the best in terms of cross ventilation potential.
Within the clustered layout with courtyards, dir. 0° and 22.5° performed best for all ventilation parameters (velocities, airflow, and aoa). cp best performance was in wind directions 67.5°, 270° and 45°.
In the dot layout, dir. 22.5° and 0° performed best for wind velocities and aoa, with the first having more favorable velocities; all wind directions had similar airflow patterns. cp showed a profile similar to El-Sades area with the best performance was in dir. 67.5°, 270° and 292.5°
In the clustered-shifted layouts (large courtyards), dir. 22.5° had better wind velocities, dir. 67.5° had better aoa, and, similar to Zeinhom area, Sakan Masr had the best pressures in dir. 270°, 292.5° and 67.5°.
The best wind velocities performance was found in Zeinhom’s linear and El-Sades’s clustered patterns for wind direction 22.5°. Although known to boost ventilation, the dot pattern of Mubarak Housing had the worst performance, followed by Sakan Masr’s clustered-shifted pattern, despite its large courtyards. When comparing the aoa, Zeinhom and El-Sades areas showed best performance, followed by Mubarak area, while Sakan Masr showed the worst results. Wind directions did not have a significant effect on the aoa results as did the patterns themselves.
The yearly dangerous wind was fairly low in all areas. El-Sades had the highest percentage of incidence of uncomfortable wind, Mubarak and Zeinhom were nearly equal, while Sakan Masr had the lowest. For other comfort levels, the linear arrangement of Zeinhom created a variety of results within its arrays, ranging from their suitability for long and short sitting to walking leisurely and fast. The clustered pattern of El-Sades allows for leisurely walking around clusters, as well as sitting long and sitting short inside the courtyards, whereas the wind blockage effect of Mubarak’s dot pattern and Sakan Masr’s large shifted courtyards made them comfortable for sitting long in most of their parts.
Zeinhom had the best cross-ventilation potential for directions 292.5° and 270°, followed by Mubarak for directions 270°, 292.5° and 67.5°. Sakan Masr came in third place for directions 292.5° and 270°, followed by El-Sades for direction 67.5°. cp values for all areas were found to be in contrast with the ventilation parameter data. Moreover, higher cp results did not necessary occur on the façades that need ventilation most.
General guidelines and future research
The unaligned (staggered) linear parallel layout with a central space and two cavities (upwind and downwind) improves airflow.
The clustered layout with courtyards and four cavities (one in each side) oblique to the wind has the optimum airflow.
The dot layout, if not designed carefully and alternately arranged, considerably blocks airflow, on the contrary of what is believed.
Oblique clusters with U-shaped courtyards, lateral inlets, and short windward façades have enhanced airflow in the majority of wind directions.
The yearly dangerous wind primarily occurs in the main streets, building corners, and wind inlets, which may be avoided during early design stages.
The oblique direction 67.5° to wind could balance between ventilation and pressure coefficients. However, it is believed that with some design alterations of other orientations that witness optimum velocities and airflow patterns, the pressure coefficient results (hence, cross-ventilation potential) could be improved.
The shifted staggered linear and clustered courtyarded housing patterns, oriented 0 ° and 22.5° to the prevailing wing, enhance wind velocities, shorten age of air, and boost airflow. They also allow for a variety of activities based on the wind comfort levels, ranging from their suitability for long and short sitting to walking leisurely and fast. More research is needed to improve their wind pressure coefficient of facades and thus their cross-ventilation potential.
Annual wind comfort should be considered in order to reduce uncomfortable winds on major streets, arrays and inlets.
A simulated thermal study is required for a more comprehensive investigation.
Further simulated research is needed to optimize the patterns of the studied housing layouts in order to enhance the results and improve their ventilation performance.
Disclosure statement
No potential conflict of interest was reported by the author.
References
- World Bank. Inclusive Cities. Available from: https://www.worldbank.org/en/topic/inclusive-cities#1.
- World Health Organization Ambient (outdoor) air pollution. Sept 2021. Available from: https://www.who.int/news-room/fact-sheets/detail/ambient-(outdoor)-air-quality-and-health
- AbdelRahman MM, Moustafa WS, Farag OM. Modelling of Egyptian low-cost-housing natural ventilation: integration of geometry, orientation and street width optimization. Urban Clim. 2017;21:318–331. doi: 10.1016/j.uclim.2017.08.002
- He B-J, Ding L, Prasad DK. Enhancing urban ventilation performance through the development of precinct ventilation zones: a case study based on the greater Sydney, Australia. Sustainable Cities Soc. 2019;47:101472. doi: 10.1016/j.scs.2019.101472
- Ying X, Wang Y, Li W, et al. Group layout pattern and outdoor wind environment of enclosed Office buildings in Hangzhou. Energies. 2020;13(2):406. doi: 10.3390/en13020406
- Asfour OS. Prediction of wind environment in different grouping patterns of housing blocks. Energy Build. 2010;42(11):2061–2069. doi: 10.1016/j.enbuild.2010.06.015
- Elgamal NF, Impact of street design on urban ventilation in hot dry climate using envi-met, case of greater cairo region. 1st International Conference on Towards a Better Quality of Life. 2017. doi: 10.2139/ssrn.3163449
- Fahmy M, Mahmoud S, Elwy I, et al. A review and insights for eleven years of urban Microclimate research Towards a New Egyptian ERA of low carbon, comfortable and energy-efficient housing typologies. Atmosphere. 2020;11(3):236. doi: 10.3390/atmos11030236
- Golany GS. Ethics and urban design: culture, form, and environment. New York: John Wiley & Sons; 1995.
- Jiang Y, Wu C, Teng M. Impact of residential building layouts on microclimate in a high temperature and high humidity region. Sustainability. 2020;12(3):1046. doi: 10.3390/su12031046
- Kubota T, Miura M, Tominaga Y, et al. Wind tunnel tests on the relationship between building density and pedestrian-level wind velocity: development of guidelines for realizing acceptable wind environment in residential neighborhoods. Build Environ. 2008;43(10):1699–1708. doi: 10.1016/j.buildenv.2007.10.015
- Peng Y, Gao Z, Buccolieri R, et al. Urban ventilation of typical residential streets and impact of building form variation. Sustainable Cities Soc. 2021;67:102735. doi: 10.1016/j.scs.2021.102735
- Fahmy M, Sharples S, Passive design for urban thermal comfort: a comparison between different urban forms in Cairo, Egypt. Plea 2008: The 25th Conference on Passive & Low Energy Architecture; 22-24 October 2008; Dublin, Ireland. 2008.
- DeKay M, Brown GZ. Sun, wind, and light: architectural design strategies. 3rd ed. Hoboken: John Wiley & Sons; 2014.
- Aga Khan Program for Islamic Architecture. Cairo: 1800-2000 planning for the Capital city in the context of Egypt’s history and Development. In: Evin A, editor. The expanding metropolis: coping with the urban growth of Cairo. Singapore: Concept Media/The Aga Khan Award for Architecture; 1985. pp. 91–120.
- Stewart DJ. Changing Cairo: the political economy of urban form. Int J Urban Reg Res. 1999;23(1):128–146. doi: 10.1111/1468-2427.00182
- Elshahed M. Workers’ and popular housing in Mid-Twentieth-Century Egypt. In: Kılınç K Gharipour M editors. Social Housing in the Middle East: architecture, Urban Development, and transnational modernity. Bloomington: Indiana University Press; 2019pp. 64–87. doi:10.2307/j.ctvd58s1c.5
- Abu-Lughod J. Cairo: 1001 years of the city victorious. Princeton: Princeton University Press; 1971. doi: 10.2307/j.ctv7n0cmg.
- Ahmed KG. Residents’ socio-cultural dissatisfaction in the two stages of public housing in Cairo, Egypt: what has changed in the third ‘current’ one? Urban Des Int. 2012;17(3):159–177. doi: 10.1057/udi.2012.9
- El-Batran M, Arandel C. A shelter of their own: informal settlement expansion in Greater Cairo and government responses. Environ Urban. 1998;10(1):217–232. doi: 10.1177/095624789801000109
- Ghannam F. Remaking the Modern: space, relocation and the Politics of Identity in a Global Cairo. Berkeley: University of California Press; 2002.
- Ibrahim SE. Cairo: a sociological profile. In: Evin A, editor The expanding metropolis: coping with the urban growth of Cairo. Singapore: CRoncept Media/The Aga Khan Award for Architecture; 1985. pp. 25–33.
- Sims D, Urban Slums Reports: The case of Cairo, Egypt. UNDERSTANDING SLUMS: Case Studies for the Global Report on Human Settlements 2003. 2003, London: Development Planning Unit (DPU), University College London.
- Ahmed KG, Design for the urban poor in Egypt: satisfying user needs or achieving the aspirations of professionals? The case of the Mubarak National housing Project for Youth, in Common Ground - Proceedings of the Design Research Society International Conference, Durling D Shackleton J, editors 2002, Staffordshire University Press: London, United Kingdom. p. 50–63.
- New urban communities authority. Achievements. Available from: http://www.newcities.gov.eg/english/aboutUs/achievments/default.aspx.
- CCKP. Egypt - Climatology. Climate Change Knowledge Portal; Available from: https://climateknowledgeportal.worldbank.org/country/egypt/climate-data-historical.
- Agrawala S, Moehner A, El Raey M, et al. Development and climate change in Egypt. Paris: Organisation for Economic Cooperation and Development; 2004.
- Iowa Environmental Mesonet.Weather/Climate information. Iowa State University. [cited 2023 Jun 1]. Available from:https://mesonet.agron.iastate.edu/agweather/
- Lawrie LK, Crawley DB, Development Of Global Typical Meteorological Years (TMYx). 2022: http://climate.onebuilding.org.
- Rodrigues Marques Sakiyama N, Frick J, Bejat T, et al. Using CFD to evaluate natural ventilation through a 3D parametric modeling approach. Energies. 2021;14(8):2197. doi: 10.3390/en14082197
- Kastner P, Dogan T. A cylindrical meshing methodology for annual urban computational fluid dynamics simulations. J Build Perform Simu L. 2020;13(1):59–68. doi: 10.1080/19401493.2019.1692906
- Hågbo T-O, Giljarhus KET, Hjertager BH. Influence of geometry acquisition method on pedestrian wind simulations. J Wind Eng Ind Aerodyn. 2021;215:104665. doi: 10.1016/j.jweia.2021.104665
- Dogan T, Kastner P. Streamlined CFD simulation framework to generate wind-pressure coefficients on building facades for airflow network simulations. Building Simul. 2021;14(4):1189–1200. doi: 10.1007/s12273-020-0727-x
- Chen G, Rong L, Zhang G. Unsteady-state CFD simulations on the impacts of urban geometry on outdoor thermal comfort within idealized building arrays. Sustainable Cities Soc. 2021;74:103187. doi: 10.1016/j.scs.2021.103187
- Natanian J, Kastner P, Dogan T, et al. From energy performative to livable Mediterranean cities: an annual outdoor thermal comfort and energy balance cross-climatic typological study. Energy Build. 2020;224:110283. doi: 10.1016/j.enbuild.2020.110283
- Tominaga Y, Mochida A, Yoshie R, et al. AIJ guidelines for practical applications of CFD to pedestrian wind environment around buildings. J Wind Eng Ind Aerodyn. 2008;96(10–11):1749–1761. doi: 10.1016/j.jweia.2008.02.058
- Kastner P, Dogan T. Towards high-Resolution annual outdoor thermal comfort Mapping in urban design. in the 16th IBPSA Conference. 2019. Rome, Italy: IBPSA. 10.26868/25222708.2019.210458
- Launder BE, Spalding DB. The numerical computation of turbulent flows. Comput Methods Appl Mech Eng. 1974;3(2):269–289. doi: 10.1016/0045-7825(74)90029-2
- Adanta D, Fattah IMR, Muhammad NM. Comparison of standard k-epsilon and SST k-omega turbulence model for breastshot waterwheel simulation. J Mech Sci Eng. 2020;7(2):039–044. doi: 10.36706/jmse.v7i2.44
- Kumar N, Upadhaya S, Rohilla A. Evaluation of the turbulence models for the simulation of the flow over a tsentralniy aerogidrodinamicheskey institut (TsAGI)-12% airfoil. ssrgInt J Mech Eng. 2017;4(1):18–28. doi: 10.14445/23488360/IJME-V4I1P104
- Spalart P, Allmaras S. A one-equation turbulence model for aerodynamic flows. In 30th aerospace sciences meeting and exhibit. American Institute of Aeronautics and Astronautics; 1992. doi: 10.2514/6.1992-439
- Kastner P, Dogan T. Eddy3D: a toolkit for decoupled outdoor thermal comfort simulations in urban areas. Build Environ. 2022;212:108639. doi: 10.1016/j.buildenv.2021.108639
- Buratti C, Palladino D. Mean age of air in natural ventilated buildings: experimental evaluation and CO2 prediction by artificial neural networks. Appl Sci. 2020;10(5):1730. DOI. doi: 10.3390/app10051730
- Hang J, Sandberg M, Li Y. Age of air and air exchange efficiency in idealized city models. Build Environ. 2009;44(8):1714–1723. doi: 10.1016/j.buildenv.2008.11.013
- Mohammadi M, Tien PW, Calautit JK. Numerical evaluation of the use of vegetation as a shelterbelt for enhancing the wind and thermal comfort in peripheral and lateral-type skygardens in highrise buildings. Building Simul. 2023;16(2):243–261. doi: 10.1007/s12273-022-0943-7
- Janssen WD, Blocken B, van Hooff T. Pedestrian wind comfort around buildings: comparison of wind comfort criteria based on whole-flow field data for a complex case study. Build Environ. 2013;59:547–562. doi: 10.1016/j.buildenv.2012.10.012
- Blocken B, Stathopoulos T, van Beeck JPAJ. Pedestrian-level wind conditions around buildings: review of wind-tunnel and CFD techniques and their accuracy for wind comfort assessment. Build Environ. 2016;100:50–81. doi: 10.1016/j.buildenv.2016.02.004
- Li B, Luo Z, Sandberg M, et al. Revisiting the ‘venturi effect’ in passage ventilation between two non-parallel buildings. Build Environ. 2015;94:714–722. doi: 10.1016/j.buildenv.2015.10.023
- Ok V, Yasa E, Özgunler M. An experimental study of the effects of surface openings on air flow caused by wind in courtyard buildings. Archit Sci Rev. 2008;51(3):263–268. doi: 10.3763/asre.2008.5131
- Javanroodi K, Mahdavinejad M, Nik VM. Impacts of urban morphology on reducing cooling load and increasing ventilation potential in hot-arid climate. Appl Energy. 2018;231:714–746. doi: 10.1016/j.apenergy.2018.09.116