
 ?Mathematical formulae have been encoded as MathML and are displayed in this HTML version using MathJax in order to improve their display. Uncheck the box to turn MathJax off. This feature requires Javascript. Click on a formula to zoom.
ABSTRACT
The main aim and objective of the present research is to forecast the strength of steel fiber reinforced concrete (SFRC) using four mathematical models developed with five independent variables viz. control strength, aspect ratio, percentage of steel fiber, water to cement ratio and aggregate to cement ratio. These models provide the best model with the best performance to be determined by error analysis. For obtaining the experimental data, concrete cubes of size 150 mm x 150 mm x 150 mm are tested under compression. For flexure strength, beam specimens of size 150 mm × 150 mm x 700 mm are casted with steel fiber reinforced concrete. Thus error analysis is performed for exponential mathematical models, log-linear models, analytical models and Artificial Neural Network (ANN) models to compute response variables considered in the study. The calibrated model was analyzed, compared, and ranked using the Global Performance Indicator (GPI). Difference between standard deviation of predicted and experimental data is found to be -0.082 for exponential model and for ANN model it is computed as 2.771. The exponential mathematical model shows a higher GPI value as 0.67, whereas ANN model exhibits lower GPI value as -6.94. The novelty of the work is that, this research compares the models based on the mean value, mean error, % error, mean square error (MSE) and root means square error (RMSE) of the model when compared with field data. Experimental results are also provided for steel fiber reinforced concrete (SFRC). The effectiveness of GPI approach to predict the fiber reinforced concrete (FRC) strength is discussed.
Introduction
It is incredibly challenging to classify steel fiber-reinforced concrete because of its diverse applications for it in various fields. manholes, pipes, covers, sleepers, etc. in tunnels are SFRC construction’s most typical use. In addition, it can be used in other types of structures, such as the paving of roads and airports, hydraulic systems, and fiber shotcrete which directly requires research to be done in the direction of bettering the techniques for predicting the strength of the materials in order to cut down on errors and boost productivity. Numerous researchers have conducted comparative analyses of the various methods used to estimate the strength of the SFRC. Manufacturing processes and techniques greatly influences the bending/flexural performance of SFRC concrete [Citation1]. Shear strength of high-strength FRC beam without use of stirrups is required to evaluate with the addition of various fibers [Citation2]. Sometimes a new design methods and test procedures are to be proposed for SFRC subjected to uniaxial tension [Citation3]. Again for this, optical grid and electrical gauges shall be employed to measure crack width and flexural strain of SFRC concrete [Citation4]. Experimental work shows the improvement in shear strength of steel fiber reinforced beams even without the provision of stirrups [Citation5].
It is found observed that compressive strength of the FRC improved by 15.3 % with the addition of 1.5% volume fraction of steel fibers [Citation6]. Also, with the mixing of steel fibers, brittle failure is considerably reduced in concrete, thus increasing the ductility [Citation7].
Improved guidelines for FRC concrete to improve its strength characteristics are also available [Citation8]. Provision of steel stirrups can be avoided in steel fiber reinforced concrete beams as due to presence of steel fibers for improving shear resistance behavior [Citation9]. Some inverse technique considering the ordinary arrangement of the reinforcements are discussed regarding the deformational analysis of SFRC beams [Citation10]. Even though stress-strain relationships for SF (steel fiber) concrete in tension has been derived from test of beam with normal reinforcement [Citation11]. It is concluded that the efficiency of SF (steel fibers) to be the alternative to the shear reinforcement [Citation12]. Such fib Model Code 2010 includes models and validation of test procedure for FRC [Citation13]. New technique for constitutive modeling of SFRC provides a tool for better understanding of mechanism of steel fiber in high strength concrete [Citation14]. Strength characteristics of the SFRC beam with finite element (FE) analytical method have been validated for experimental shear capacities of beams [Citation15]. Statistical analysis and the obtained results are required to be validated for the development of reliable model [Citation16]. It is also found that light weighted high strength concrete can be developed with mixing of steel fibers of different aspect ratio [Citation17].
Steel fibers in concrete mixed with styrene-butadiene rubber (SBR) polymer sufficiently improved the flexural capacity of beam specimens [Citation18]. Further optimal capacity of beams can be achieved by proper arrangement of stirrups in combination with steel fibers in concrete [Citation19,Citation20]. Ultra-high performance fiber reinforced concrete (UHPFRC) members are mostly studied for the impact and blast loading for examining the structural behavior [Citation21]. Design of multiphase CF (carbon fiber) reinforcement of cracked RC structure is carried out by the virtue of topology optimization [Citation22]. Compressive strength of fiber reinforced concrete was evaluated to measure the performance with durability indicator depending upon the results of experimental investigation on twenty-four various HPC mixtures [Citation23].
Konečný et al. [Citation24] evaluated the performance and durability indicator depending upon the results of experimental investigation on 24 various HPC mixtures for its compressive strength. Ziyue et al. [Citation25] proposed a deep convolutional neural network trained using a data set consisting of 380 groups of concrete mixes. For this, result of three models – SVM, Artificial Neural Network (ANN) and AdaBoost – are compared to check the accuracy and reliability of the models. High coefficients of determination as 0.973 for the training set and 0.967 for the test set are recorded from the results of different models. YiFei et al. [Citation26] employed Data-Driven Kriging Model to predict compressive strength of concrete. Hence, ANN and Support Vector Regression (SVR) techniques are used for comparisons and validate the predictive ability of Kriging model.
According to the Global Performance Indicator (GPI), the system’s accuracy is evaluated. The system is more precise the higher the GPI value. Therefore, the comparison of coefficient of determination (R2-value) from regression analysis and GPI is given more emphasis in this study. The fact that a system can have a high R2-value, but a low GPI cannot be regarded as being more appropriate must always be noted, but the opposite is always true. In this study, four distinct mathematical models are taken into account to forecast the strength characteristics of SFRC using the strength of the controlled concrete without fibers, also known as Controlled Strength, % fibers and AR (Aspect ratio). Hence, this prepared mathematical models can also predict the strengths viz. compressive strength, split tensile strength and flexural strength considering the optimal W/C (water-cement) and aggregate cement ratios.
Formulation of the model using experimental data is done using five Independent π terms and one dependent π viz. Independent π terms (π1, π2, π3, π4, π5) and Dependent π terms =(π01)
Where,
π1= water-cement ratio, π2= Aggregate cement ratio, π3= percentage of fibers, π4 = Aspect ratio and π5 = Control Strength,
π01 =Prediction of SFRC (steel fiber reinforced concrete) strength
Therefore, we tried to determine which model is perfectly suited for the prediction of SFRC strength for the Error Analysis and Calculations for GPI using experimental data. This research paper has presented a method to establish the dependability and coefficient of the determinant for mathematical models, analytical models, log-linear models and ANN models computed for all response variables. All of the models were compared for dependability and determinant co-efficient. The reliability of all response models is found to be excellent by the reliability comparison (Ri) of all the models. As a result, we can conclude that mathematical and log-linear models perfectly describe the reliability of all response variables. Additionally, all models’ coefficients of determinants were calculated. The GPI value increases with model accuracy. It is obvious from the GPI value which model is the best fit for predicting SFRC strength.
Error analysis and calculation of GPI
For considering the service life and durability prediction the concrete compressive strength and flexural strength are the key parameters in as per construction practices. Traditional regression method of analysis fails to compute the correlation between different parameters to evaluate the performance index of concrete structures. Data driven techniques such as ANN and GPI evaluation methods help effectively to compute the global performance of concrete structures. Hence, error analysis and GPI calculation serve as to predict the strength parameters which involves mathematical formulation of various statistical test.
Error is defined as the variance between the calculated and the measured values. Less error means that experiments were conducted correctly and accurately, which led to accurate mathematical correlations between the input and output terms. Ten statistical tests must be run in statistical analysis to assess error. In the research paper, comparisons between the models are made based on the mean value (MV), mean error (ME), percentage error (PE), mean square error (MSE) and root mean square error (RMSE) of the model when compared with experimental data. When a statistical indicator for a model falls below the median, the further away from the median values of the other models the indicator is, the more accurate the model is when compared to the other model. When a statistical indicator’s value is higher than the median, the further it deviates from the median, i.e. the fewer accurate the model when compared to the other models. shows a RC beam composed of fibers under two-point loading. Whereas, consist of mathematical formulae for various statistical tests.
Figure 1. Experimental set up for two point loading flexure test on beam.
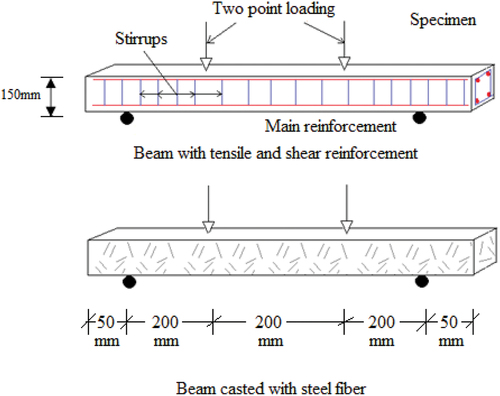
Table 1. Mathematical formulae for various statistical tests.
The calculation for the GPI is done by first reducing the statistical error values 285 in the range of 0 to 1, then deducting them from the corresponding medians in the range of 286 and summing the differences using the weighted 287 factors [Citation16].
The GPI for ith model is defined mathematically as.
Where,
is median of scaled values of indicator j,
is scaled vales of jth indicator of ith model.
The accuracy of the model depends upon statistical indicator of a model. If it is less than median and farther the value from median value of all other models, the model is considered as more accurate as compared to the other models. The model is less accurate if the value of statistical indicator is higher than median. Hence, a scaled valued of indicators are considered for more accuracy.
Results and discussion
It can be stated that more is the accuracy of the model, higher is the value of GPI. The GPI is calculated as a product of individual indicators has some disadvantages compared to GPI defined in this manner. If one indicator, for example, has a value of 0, then all indicators, even those with potentially high values, will have a value of 0 as well. Additionally, the method of computing GPI used in this study allows models with negative R2 to be compared to one another, which would not be possible without it. Additionally, for computing the GPI a fairly wide range of values of all indicators were selected which is necessary to compare the different models.Sample computations for statistical tests for grain threshed (Gt) are also performed. The other models underwent analogous calculations. The experimental and predicted SFRC strengths of all four models are shown in .
Table 2. Statistical tests results for GT: π01.
For the four models’ predicted values to be used in the statistical tests, 514 samples of the collected data were studied experimentally and compared. The exponential model, Log-linear model, analytical model and ANN model, and the outcomes are shown in . provides an example of a GPI calculation and error analysis results.
Table 3. Global performance indicator(GPI) for π01 with prediction of SFRC strength.
Table 4. Global performance indicator (GPI) for prediction of SFRC strength to determine the median.
Table 5. Prediction of SFRC strength parameter depending upon global performance indicator (GPI).
Table 6. Comparative analysis of the models using coefficient of determinants(R2) and GPI.
The methodology for establishing dependability and co-efficiency of determinants for exponential mathematical models, log-linear models, analytical models and ANN models, computed for all response variables, has been presented in this study. Between all the models, a comparison of the determinant coefficient and reliability was done. The reliability of all response models is found to be excellent by the reliability comparison (Ri) of all the models. As a result, we can conclude that mathematical and log-linear models perfectly describe the reliability of all response variables. In addition, all models’ determinant coefficients were established. The coefficient of determinants of all response variables for the exponential model, log-linear model, and ANN models are therefore perfectly fit. Higher GPI values correspond to more accurate models. It is obvious that the exponential mathematical model (1)‘s prediction of SFRC strength using regression analysis is perfectly accurate.
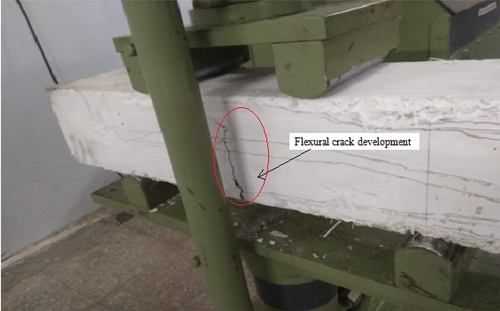
Modified properties of fiber reinforced concrete mostly depend upon aspect ratio (AR55), orientation and fraction of volume (% Vf) of steel fibers. Fatigue resistance and crack propagation can be controlled by uniform spreading of steel fibers in concrete to impart the durability properties. Fatigue resistance in rigid pavement, manholes, pipes, covers and sleepers miscarries due to the propagation of micro cracks. To reduce the viscocity of the mix, super-plasticizer and mineral admixtures are also supplemented to impart sufficient workability. Hence, M40 grade of concrete is designed with mix 1:0.75:1.5. shows the failure pattern of beam under flexural loading.
Figure 2. Failure pattern of beam under flexure with two point loading.
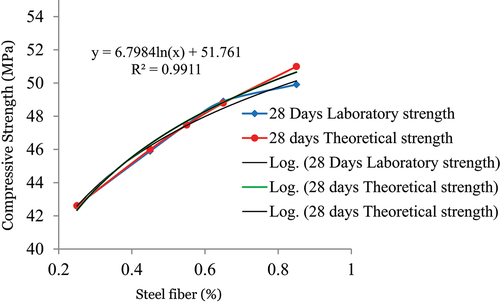
From , it is observed that, for lower percentages of steel fiber theoretical value of 7 days compressive strength is 1.83% higher than experimental value of strength. For higher percentages of steel fiber in concrete theoretical value of 7 days, compressive strength is overestimated by 0.5% than that of experimental value of compressive strength. elaborates 28 days compressive strength of steel fiber reinforced concrete. It can be stated that for lower percentages of steel fiber, % difference between experimental and theoretical values of 28 days compressive strength is 0.068%, whereas it has the value of 2.12% for addition of 0.85% of steel fibers in concrete.Compressive strength of steel fiber reinforced concrete is effectively enhanced due to the addition of these steelfibers. Such studiesare also performed by Mastali et al. [Citation23] and Konečný et al. [Citation24]. The assessment of the concrete mixtures with different dosage by virtue of its methodology is performed. Simalti and Singh [Citation27] also examined self-consolidating concrete with the addition of steel fiber and shredded tire recycled steel fiber. For this, rapid chloride ion penetrability and sign of corrosion are studied as due to addition of steel fibers.
Figure 3. Compressive strength after 7 days with experimental, theoretical and calculated values.
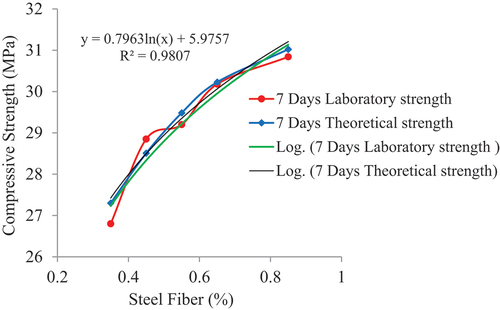
Figure 4. Compressive strength after 28 days with experimental, theoretical and calculated values.
From , it can be concluded that mixed variation in the % difference of experimental and theoretical values are observed. It is observed that experimental values of 7 days flexural strength are slightly higher than theoretical values of flexural strength. Flexural strength of steel fiber reinforced concrete is effectively enhanced due to the addition of these steel fibers. exhibits 28 days flexural strength of steel fiber reinforced concrete. For lower percentages of steel fiber i.e. 0.25%, theoretical value of 28 days flexural strength is overestimated by 0.23% than that of experimental value of strength. For higher percentages of steel fiber (0.85%) in concrete, theoretical value of 28 days flexural strength is underestimated by 0.127% than that of experimental value. Further, provides results of error analysis and Global Performance Indicator showing the best Mode for all response variables.
Figure 5. Flexural strength after 7 days with experimental and theoretical values.
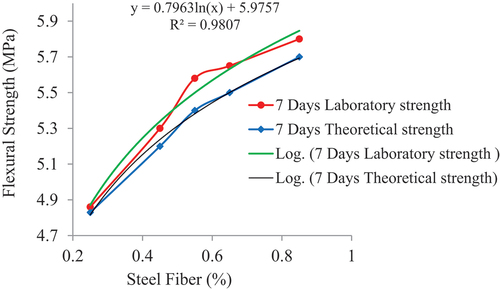
Figure 6. Flexural strength after days with experimental and theoretical values.
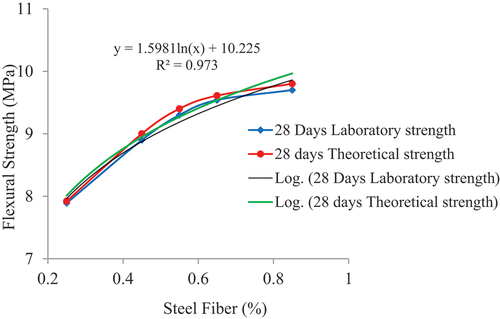
Table 7. Results of error analysis and global performance indicator showing the best mode for all response variables.
FRC concrete behavior with addition of SF (steel fiber), PF (polypropylene fiber) and modified styrene-butadiene rubber (SBR) polymer shows improvement in hybrid concrete behavior [Citation28]. Ziyue et al. [Citation25] also proposed a similar deep convolutional neural network model for different groups of concrete mixes. Coefficients of determination are considered for evaluation purpose and the training setsand the test sets are captured from the obtained results of different models. A number of machine-learning models are developed by various researchers to predict compressive and flexural strength of concrete. For this, information from constituent material is required as inputs [Citation29]. Such models are developed depending upon series of experimentation. Therefore, it becomes costly in terms of experimental, as well as analytical work which involves number of parameters.
Conclusion
Strength parameters in concrete are the most crucial structural engineering designing parameters in fiber reinforced concrete (FRC) structures. Accurate prediction of compressive strength and flexural strength areessential when considering this parameter for time dependent and cost – effective approach. Statistical and deep learning (DL) models are more popular as they have a higher prediction of accuracy. This study proposes comparison of four statistical approaches which is rarely observed in literature.It is evident that the exponential mathematical model, which has a higher GPI value of 0.67, is the best model for predicting the strength of the SFRC. The log-linear model is the second model that fits well for predicting SFRC strength. The % difference between experimental and theoretical values of 28 days compressive strength is 2.12% for addition of 0.85% of steel fibers in concrete. For 0.25% of steel fiber in concrete, theoretical value of 28 days flexural strength is observed to be 0.23% higher than that of laboratory strength. For addition of 0.85% of steel fiber in concrete, theoretical value of 28 days flexural strength is lesser by 0.127% than that of experimental value. Hence, a novel approach for prediction of compressive as well as flexural strength of steel fiber reinforced concrete is provided to help development of sustainable infrastructures without having costly experiments and time-consuming practices. All of the response models’ reliability was found to be excellent in the reliability comparison (Ri) of all the models. The GPI value increases with model accuracy.
Disclosure statement
No potential conflict of interest was reported by the author(s).
References
- Tountanji H, Bayasi Z. Effects of manufacturing techniques on the flexural behavior of steel fiber-reinforced concrete. Cement Concr Res. 1997;28(1):115–124. doi: 10.1016/S0008-8846(97)00213-5
- Khuntia M, Stojadinovic B, Goel SC. Shear strength of normal and high-strength fibre reinforced concrete beams without stirrups. Struct J. 1999;96:282–289.
- Vandewalle L, Nemegeer D, Balazs L, et al. RILEM TC162-TDF: test and design methods for steel fibre reinforced concrete: uni-axial tension test. Mater Struct. 2001;34:3–6.
- Robins P, Austin S, Chandler J. Flexural strain and crack width measurementof steel-fibre-reinforced concrete by optical grid and electrical gauge methods. Cement & Concrete Res. 2001;31(5):719–729. doi: 10.1016/S0008-8846(01)00465-3
- Kwak YK, Eberhard MO, Kim W-S, et al. Shear strength of steel fibre-reinforced concrete beams without stirrups. ACI Struct J. 2002;99:530–538.
- Song PS, Hwang S. Mechanical properties of high-strength steel fiber-reinforced concrete. Constr Build Mater. 2004;18(9):669–673. doi: 10.1016/j.conbuildmat.2004.04.027
- Neves RD, Fernandes de Almeida JCO. Compressive behaviour of steel fibre reinforced concrete. Struct Concr. 2005;6(1):1–8. doi: 10.1680/stco.2005.6.1.1
- Di Prisco M, Plizzari G, Vandewalle L, et al. Fibre reinforced concrete: new design perspectives. Mater Struct. 2009;42(9):1261–1281. doi: 10.1617/s11527-009-9529-4
- Dinh HH, Parra-Montesinos GJ, Wight JK. Shear behavior of steel fibre-reinforced concrete beams without stirrup reinforcement. J ACI Struct. 2010;107(5):597–606. doi: 10.14359/51663913
- Kaklauskas G, Gribniakand V, Bačinskas D. Inverse technique for deformational analysis of concrete beams with ordinary reinforcement and steel fibres. Procedia Eng. 2011;14:1439–1446. doi: 10.1016/j.proeng.2011.07.181
- Gribniak V, Kaklauskas G, Kwan AKH, et al. Deriving stress-strain relationships for steel fibre concrete in tension from tests of beams with ordinary reinforcement. Eng Struct. 2012;42:387–395. doi: 10.1016/j.engstruct.2012.04.032
- Minelli F, Plizzari GA. On the effectiveness of steel fibres as shear reinforcement. Struct J. 2013;110:379–390.
- diPrisco M, Colombo M, Dozio D. Dozio D fibre-reinforced concrete in fib model code 2010: principles, models and test validation. Struct Concr. 2013;14(4):342–361. doi: 10.1002/suco.201300021
- Meskenas A, Gelazius V, Kaklauskas G, et al. A new technique for constitutive modelling of SFRC. Procedia Eng. 2013;57:762–766. doi: 10.1016/j.proeng.2013.04.096
- MashfiqulIslama M, SumaiyaKhatun M, Rashed U, et al. Finite element analysis of steel fiber reinforced concrete (SFRC): validation of experimental shear capacities of beams. Procedia Engg. 2014;90:89–95. doi: 10.1016/j.proeng.2014.11.819
- Despotovic M, Nedic V, Despotovic D, et al. Review and statistical analysis of different global solar radiation sunshine models. Renew Sustain Energy Rev. 2015;52:1869–1880. doi: 10.1016/j.rser.2015.08.035
- Iqbal S, Ali A, Holschemacher K, et al. Mechanical properties of steel fber reinforced high strength lightweight self-compacting concrete (SHLSCC). Constr Build Mater. 2015b;98:325–333. doi: 10.1016/j.conbuildmat.2015.08.112
- Wankhade RL, Landage AB, Konnur BA. Experimental investigation on combined effect of SBR and steel fiber on properties of concrete. Int J Eng Res. 2016;5(1):257–261.
- Amin A, Foster SJ. Shear strength of steel fibre reinforced concrete beams with stirrups. Eng Struct. 2016;111:323–332. doi: 10.1016/j.engstruct.2015.12.026
- Lee JH, Cho B, Choi E. Flexural capacity of fibre reinforced concrete with a consideration of concrete strength and fibre content. Constr Build Mater. 2017;138:222–231. doi: 10.1016/j.conbuildmat.2017.01.096
- Yoo DY, Moon DY. Moon D-Y effect of steel fibres on the flexural behavior of RC beams with very low reinforcement ratios. Constr Build Mater. 2018;188:237–254. doi: 10.1016/j.conbuildmat.2018.08.099
- Nguyen AP, Banh TT, Lee DK, et al. Design of multiphase carbon fibre reinforcement of crack existing concrete structures using topology optimization. Steel Compos Struct. 2018;29(5):635–645.
- Mastali M, Dalvand A, Sattarifard AR, et al. Characterization and optimization of hardened properties of self-consolidating concrete incorporating recycled steel, industrial steel, polypropylene and hybrid fbers. Composites. 2018;151:186–200. doi: 10.1016/j.compositesb.2018.06.021
- Konečný P, Ghosh P, Hrabová K, et al. Effective methodology of sustainability assessment of concrete mixtures. Mater Struct. 2020;53(4):98. doi: 10.1617/s11527-020-01535-3
- Ziyue Z, Zhu Z, Yao W, et al. Accurate prediction of concrete compressive strength based on explainable features using deep learning. Constr Build Mater. 2022;329:127082. doi: 10.1016/j.conbuildmat.2022.127082
- YiFei L, MaoSen C, Abdel Wahab M. Data-driven kriging model for predicting concrete compressive strength and parameter correlation analysis. In: Abdel Wahab M., editor. Proceedings of the 5th International Conference on Numerical Modelling in Engineering. Lecture Notes in Civil Engineering; Singapore: Springer; 2023; p. 311. doi: 10.1007/978-981-19-8429-7_11
- Simalti A, Singh AP. Comparative study on performance of manufactured steel fiber and shredded tire recycled steel fiber reinforced self-consolidating concrete. Constr Build Mater. 2021;266:121102. doi: 10.1016/j.conbuildmat.2020.121102
- Pathan MG, Wankhade RL, Shende AM, et al. Experimental analysis for performance of concrete with addition of steel fibres, SBR and polypropylene fibres. JurnalKejuruteraan. 2022;34(3):429–445. doi: 10.17576/jkukm-2022-34(3)-10
- Islam N, Kashem A, Das P, et al. Prediction of high-performance concrete compressive strength using deep learning techniques. Asian J Civ Eng. 2023;25(1):327–341. doi: 10.1007/s42107-023-00778-z