
Abstract
The evolution of flowering phenology is the result of a trade-off that balances many factors, including growth, reproductive capacity, and temporal overlap with pollinators. When there is large temporal variation in temperature, particularly in the onset of frost, the optimum flowering strategy will vary from year to year. In Duluth, MN, USA, the end of the growing season can vary by more than 30 days. In this study, we observed flowering phenology and pollinator abundance on 15 genotypes of Solidago altissima in Duluth, MN. We predicted that temporal variation in temperature would lead to a range of flowering strategies in the S. altissima population; some genotypes flower early and in synchrony, some ‘hedge their bets’ by flowering over a range of dates, and others have an intermediate strategy. Our results indicate that genotypes vary in mean flowering date and duration of flowering and, for the two observed years, pollinator abundance was highest for early-flowering genotypes.
1. Introduction
Flowering phenology strongly affects plant fitness. Several ecological factors exert selection on the timing of flowering, and species are under selection to reach an optimum strategy to balance these factors. For example, animal-pollinated plants must flower when pollinators are available, but after they have had time to obtain sufficient resources for flowering and seed production (Gross & Werner Citation1983; Widén Citation1991). Species in harsh, variable environments are also under strong selection to adapt to the timing of the onset of low temperatures which terminates the pollination season (Widén Citation1991; Kudo Citation1993). Many species have evolved to flower early to avoid the end of the season temperatures, despite reduced time for resource accumulation (Widén Citation1991; Lacey et al. Citation2003). In clonal species, high temporal variation in temperature can result in a range of strategies within a population because plants can persist and reproduce asexually for a number of years between years when they are successful in sexual reproduction (Werner et al. Citation1980).
Many plant species are known to ‘hedge their bets’ with regard to the timing of reproduction. Bet-hedging is hypothesized to provide a buffer against risks like temporal variation in environmental conditions by employing a variable strategy. Cohen (Citation1966) modeled a classic example of this concept using desert annuals which employ a bet-hedging strategy by which individual plants produce some seeds that germinate immediately and some that remain dormant for a time. In his model, the seeds that germinated immediately risked mortality if the environment was unfavorable, but also had a high reproductive potential because of their short generation time. Later germinating individuals had lower reproductive potential because of their longer generation time, but allowed the plant to germinate at times when the environment might be favorable, reducing it probability of total reproductive failure. ‘Bet-hedging’ has also been observed for the timing and duration of flowering. For example, the spring wildflower Mertensia fusiformis bet-hedges by delaying the opening of some flowers to ensure pollination and seed development in years with late spring frosts (Forrest & Thomson Citation2010). Similarly, the timing and duration of flowering in Ulex europaeus has been suggested to follow a bet-hedging strategy to spread out the risk of freezing, rotting, and seed predation (Tarayre et al. Citation2007).
In areas with temporal variability at the end of the growing season, plants face a similar situation to that of the desert annuals studied by Cohen (Citation1966). Genotypes that flower early are more likely to avoid frosts which will end pollination and seed maturation, but they may have a limited capacity to produce flowers and seeds because of the reduced time to accumulate resources. On the other hand, those that flower late may accumulate more resources to invest in reproduction, but risk the onset of cold temperatures before their seeds are mature. Genotypes that ‘hedge their bets’ have a range of flowering dates to spread out the risk between many ramets if the timing of the onset of the end of the growing season is highly variable. The success of early and late-flowering ramets will vary, but the genet will have some reproductive success in all years. Areas with high temporal variation, then, may select for a bet-hedging strategy. However, in clonal species, the risk of flowering late may be offset if genotypes that flower late have a high payoff in years when the first frost is late. Because they can persist through years with little to no reproductive success, late-flowering, non-‘bet-hedging’ genotypes may still maintain a strong presence in the population because high reproductive success in some years may compensate for years with low or absent sexual reproduction.
Temporal overlap with pollinators is an important factor in the evolution of flowering phenology, particularly for species that are pollen-limited. Selection pressure by temperature and photoperiod is often paired with top-down pressures like pollinators and predispersal seed predators (Elzinga et al. Citation2007). Many studies have shown correlations among flowering phenology, pollinator abundance, and fitness (De Jong & Klinkhamer Citation1991; Brody Citation1997; Totland Citation2001; Irwin Citation2006). For example, for plants that share the same pollinators, competition for pollinators may select for staggered flowering dates (Wright & Calderon Citation1995). In contrast, synchronous flowering can attract additional pollinators to large, showy floral displays through a process called ‘facilitation’ (Staggemeier et al. Citation2010). It has also been suggested that the evolution of flowering phenology may be constrained by pollinators, as climate change has advanced flowering in some species and not others (Rafferty & Ives Citation2011).
In general, pollinators tend to be most abundant during peak flowering when floral rewards are highest (Totland Citation2001; Staggemeier et al. Citation2010). For this reason, some plants may have evolved to flower in synchrony (Augspurger Citation1981). Furthermore, pollinators are more active at warmer temperatures (Arroyo et al. Citation1985; Gilbert Citation1985). While not all pollinators have the same temperature threshold, cooler daytime temperatures near the end of the growing season may reduce activity of some pollinators. One hypothesis is that top-down selection by pollinators will favor early, synchronous flowering. However, the degree and direction that pollinators affect reproductive timing is likely influenced by many other factors, including optimization of growth/end-of-season trade-off.
1.1. Solidago altissima in Duluth, MN, USA
Tall goldenrod, S. altissima, is a mid-successional rhizomatous plant that inhabits disturbed sites throughout North America (Semple & Cook Citation2006). It forms dense clonal clusters, but sexual reproduction is critical for dispersal as succession progresses. In Duluth, S. altissima is one of the last species to bloom, beginning in late August and continuing through the end of the growing season (Pors & Werner Citation1989). S. altissima is an obligate outcrosser, and it is pollinated by several species of generalist insects (Werner et al. Citation1980). Its seed production is limited by pollinator abundance, and experimental hand pollinations have shown that late-flowering S. altissima has a higher capacity for seed production than those that flower early due to increased resources (Gross & Werner Citation1983).
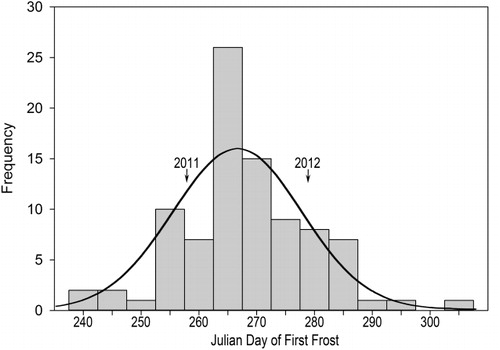
In Duluth, MN, USA, the growing season is short, and the timing of the end of the season is variable. The average first frost occurs on 13 September, and 90% of first frosts occur before 28 September (NOAA Citation2012). However, in the last 90 years, first frost dates have varied by more than 30 days and have occurred as early as 25th August ().
Due to the short growing season in Duluth and high temporal variability in the end of the season, S. altissima faces a trade-off between acquiring sufficient resources for seed production and ensuring seed maturation prior to the end of the growing season. We hypothesized that climatic variation will maintain a polymorphism in the population for both the initiation and the duration of flowering. In this study, we asked: (1) is there variation for the mean date of flowering among genotypes of S. altissima in Duluth, MN?, and (2) do these genotypes differ in the duration of flowering? Because S. altissima is known to be pollen-limited (Gross & Werner Citation1983), and pollinator activity is highly temperature dependent (Corbet et al. Citation1993), we asked: (3) does pollinator abundance vary among genotypes with different flowering strategies? We hypothesized that genotypes with different flowering strategies will have differences in pollinator abundance, and that this will differ among years.
2. Methods
Flowering phenology of S. altissima clones was observed during the summers of 2011 and 2012 at the University of Minnesota Research Farm, in Duluth, MN, USA. In April, 2011, 30 replicates of each of six genotypes were planted in 11 liter pots using rhizome fragments. These genotypes are distinct, as was found by amplified fragment length polymorphism (AFLP) analysis (Y. Ando unpublished data). Flowering phenology was recorded once per week, starting late August 2011. A plant was considered to be ‘in flower’ if 50% or more of its florets were open, which was estimated visually on each sample day.
In October 2011, 30 replicates of nine additional genotypes were planted. These were originally collected from greater than 10 meters apart to ensure that genotypes were distinct. During the 2012 field season, flowering phenology was recorded every 3–4 days and included plants from both years. Second-year replicates had multiple stems per pot, so one stem per pot was randomly selected prior to flowering to be used for all flowering phenology observations and pollinator samples. Selected stems were marked with colored flagging tape tied discretely at the base of the stem. Flowers were evaluated according to the protocol used in 2011. All plants were uniformly watered and fertilized as needed throughout the growing season.
Pollinators were sampled twice per week in September and early October, except for one week in late September in 2011, and four times per week from late August through September in 2012. Samples were conducted using digital photography on sunny days between 1000 and 1600 hours. To randomize the timing of photos, each consecutive photo was taken at a predetermined time interval, so that each photo was exactly 15 or 30 seconds apart. Thirty-second time intervals were used for samples with fewer plants in flower due to longer distances between plants. The photographer stood one meter away from the flower being sampled to prevent pollinator disturbance.
A one-way ANOVA was used to test genotypic differences in flowering time and pollinator abundance. Regression analysis was used to test the relationship between flowering phenology and pollinator abundance for genotype means and individual stems. Levene's test was used to test for equal variance among flowering dates of genotypes.
3. Results
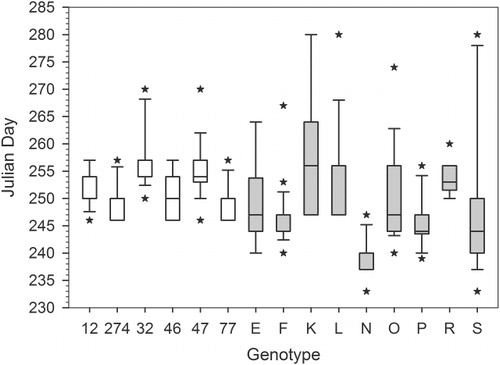
Genotypes varied in both the timing and variance of flowering. Genotypes varied significantly in mean flowering date in both 2011(, F 5,116 =12.88; p <0.001) and 2012 (, F 14,258 =6.32; p<0.001). In 2011, mean flowering date of the genotypes ranged from 5 September to 14 September and from 9 September to 18 September in 2012. Relative timing of flowering was maintained between years for genotypes grown for two years, although this was not significant at α=0.05 level (Pearson's correlation, r=0.751, p=0.085). The variance in flowering time significantly differed between genotypes as well, which was tested using data from each plant's first season (genotypes 12, 32, 46, 47, 77, and 274 from 2011; genotypes E, F, K, L, N, O, P, R, and S from 2012; ; Levene's test, t=3.01, p<0.001).
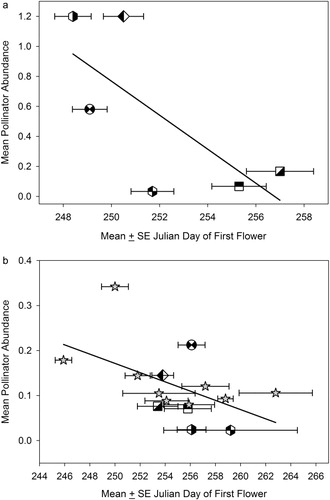
In support of our second hypothesis, we found that total pollinator visitors were significantly different among genotypes in both 2011 and 2012 (one-way ANOVA, F14,358=8.8; p<0.001). Although there was a strong trend, the regression of the mean pollinator abundance on mean flowering date for each genotype was not significant in 2011 (, y=4627–0.113x; r 2=51.3%; p<0.109; n=6) but was significant in 2012 (, y=405–0.00983x, r 2=26.5%; p>0.049, n=15). We found that flowering date was a highly significant predictor of the mean number of pollinators per stem in 2011 (y=5493–0.135x, r 2=13.4%; p<0.001; n=122) and in 2012 (y=297–0.00072x, r 2=15.1%; p<0.001 n=273). Pollinators from the families Apidae and Syrphidae were the most abundant with 60% of the total pollinators being honeybees and 29% syrphids. The remaining 11% consisted of vespid wasps and dipterans other than syrphids.
4. Discussion
We propose temporal variation in the timing of the end of the growing season has produced variation in the timing and variance of flowering among genotypes of S. altissima. In this study, we found that genotypes varied significantly in flowering phenology ( and ) and in their variance for flowering date ().
Environmental variability has led to genotypic variation in life-history traits in other plant species (Johnson Citation2007). Temporal variation can produce a variety of strategies for flowering time because selection will favor genotypes with different flowering strategies each year. In some species, temporal variation may favor only early-flowering genotypes that avoid the onset of low temperatures. In species like S. altissima, however, late-flowering plants can have a fitness advantage in warmer years because they have accumulated more resources to invest in reproduction, and so temporal variation generates variation for flowering time.
In both 2011 and 2012, the early-flowering strategy was apparently advantageous. In 2012, we found a significant negative relationship between flowering date and pollinator abundance. Genotypes that flowered late received significantly fewer pollinators than those that flowered early. In 2011, the relationship between flowering date and pollinator abundance showed a strong trend similar to that in 2012, but our small sample size made it difficult to detect a significant pattern. In 2011, Duluth had two nights beginning 15 September with lows below freezing, and this began 19 September in 2012. Both frost dates fall in the early 60% of the first frost dates for the previous 90 years in Duluth, MN ().
However, late-flowering periods may be favored in some years maintaining the polymorphism for phenology in the Duluth population. There were several years during the past 90 years when the frost-free period extended more than 20 days beyond that seen in the two years of our study (). In these years an extended growing period could produce larger amounts of resources to be invested in reproduction that would put them at a competitive advantage with conservative plants that had closed down growth early and missed the opportunity to gain additional resources. In clonal plants, the progeny from one successful year can persist for many years when their strategy does not give them a fitness advantage. It has been estimated that a single genotype can persist more than 100 years by propagating asexually (Werner et al. Citation1980).
Genotypes with moderate to late mean flowering dates and large variance were strongly represented in our sample. Five out of six genotypes had a mean flowering date before the first frost in 2011, as did all 15 genotypes in 2012. However, genotypes with later mean flowering dates also had ramets that flowered later than the date when the first frost occurred. It is possible that genotypes with extended flowering periods have evolved to use a ‘bet-hedging’ strategy. In both 2011 and 2012, this strategy would have paid off, because although many ramets flowered late and had low pollinator abundance, some ramets flowered prior to the freeze dates, ensuring at least some pollination success. Becoming adapted to use a bet-hedging strategy may be the stable state for populations in highly unpredictable environments (Sasaki & De Jong Citation1999).
In this study we focused on a small subset of strategies for flowering, but it is likely that there is a continuous distribution of timing and variance in flowering phenology. In the 15 genotypes we observed, there was a trend that suggests early-flowering genotypes may have smaller variance in flowering duration than late-flowering genotypes. However, our sample size was not large enough to test whether early-flowering genotypes had significantly smaller variance than late-flowering genotypes. It is also possible that the late-flowering genotypes are using a bet-hedging strategy, although we do not have conclusive data to support this hypothesis.
There may be factors other than temporal variation in temperature and pollinator abundance that select for flowering phenology. For instance, honeybees are the most effective pollinators of goldenrod (Werner et al. Citation1980) and were the most abundant pollinators in our study. They can be active at temperatures as cool as 12°C (Corbet et al. Citation1993; Vicens & Bosch Citation2000), much cooler than many other pollinators including syrphids (Gilbert Citation1985). Additionally, S. altissima is one of few plants in Northern Minnesota to flower so late in the growing season, so it is possible that late-flowering genotypes achieve higher pollen efficiency if honeybees are only pollinating other S. altissima. This may select for genotypes with late-flowering clones.
In summary, we have shown that S. altissima genotypes employ a variety of flowering strategies. In two years with average timing of the onset of temperatures below freezing, we found pollinator abundance was greatest for early-flowering clones, which may translate to higher seed production. Others have shown that late-flowering S. altissima has more resources for seed production (Gross & Werner Citation1983), indicating that there is a trade-off between resources accumulated and ensuring pollination prior to the end of the season. While there are obviously many alternate strategies, it is possible that some S. altissima clones moderate the growth/end-of-season trade-off by employing a bet-hedging strategy.
Acknowledgments
Funding was provided by National Research Foundation grant DEB 0949280 awarded to T.P. Craig and J. K. Itami and Department of Biology, the University of Minnesota, Duluth, MN, USA. J.K. Itami prepared the figures. We would like to thank E. Kalkbrenner, B. Loeks, J. Menchaca, L. Craig, P. Craig, N. Zarnstorff, W. Licht, D. Johnston, and P. Lande for their assistance in data collection.
Related Research Data
References
- Arroyo MT, Armesto JJ, Primack RB. 1985. Community studies in pollination ecology in the high temperate Andes of Central Chile. II. Effect of temperature on visitation rates and pollination possibilities. Plant Syst Evol. 149:187–203. 10.1007/BF00983305
- Augspurger CK. 1981. Reproductive synchrony of a tropical shrub: experimental studies on effects of pollinators and seed predators on Hybanthus prunifolius (Violaceae). Ecology. 62(3):775–778. 10.2307/1937745
- Brody AK. 1997. Effects of pollinators, herbivores, and seed predators on flowering phenology. Ecology. 78(6):1624–1631. 10.1890/0012-9658(1997)078[1624:EOPHAS]2.0.CO;2
- Cohen D. 1966. Optimizing reproduction in a randomly varying environment. J Theor Biol. 12:119–129. 10.1016/0022-5193(66)90188-3
- Corbet SA, Fussell M, Ake R, Fraser A, Gunson C, Savage A, Smith K. 1993. Temperature and the pollinating activity of social bees. Ecol Entomol. 18:17–30. 10.1111/j.1365-2311.1993.tb01075.x
- De Jong TJ, Klinkhamer PGL. 1991. Early flowering in Cynoglossum officinale L. constraint or adaptation? Funct Ecol. 5(6):750–756. 10.2307/2389537
- Elzinga JA, Atlan A, Biere A, Gigord L, Weis AE, Bernasconi G. 2007. Time after time: flowering phenology and biotic interactions. Trends Ecol Evol. 22(8):432–439. 10.1016/j.tree.2007.05.006
- Forrest J, Thomson J. 2010. Consequences of variation in flowering time within and among individuals of Mertansia fusiformis (Boraginiceae), an early spring wildflower. Am J Bot. 97:38–48. 10.3732/ajb.0900083
- Gilbert FS. 1985. Diurnal activity patterns in hoverflies (Diptera, Syrphidae). Ecol Entomol. 10:385–392. 10.1111/j.1365-2311.1985.tb00736.x
- Gross RS, Werner PA. 1983. Relationships among flowering phenology, insect visitors, and seed-set of individuals: experimental studies on four co-occurring species of goldenrod (Solidago: Compositae). Ecol Soc Am. 53(1):95–117.
- Irwin RE. 2006. The consequences of direct versus indirect species interactions to selection on traits: pollination and nectar robbing in Ipomopsis aggregata. Am Nat. 167(3):315–328. 10.1086/499377
- Johnson MTJ. 2007. Genotype-by-environment interactions leads to variable selection on life-history strategy in common evening primrose (Oenothera biennis). J Evolution Biol. 20(1):190–200. 10.1111/j.1420-9101.2006.01201.x
- Kudo G. 1993. Relationships between flowering time and fruit set of the entomophilous alpine shrub, Rhododendron aureum (Ericaceae), inhabiting snow patches. Am J Bot. 80(11):1300–1304. 10.2307/2445714
- Lacey EP, Roach DA, Herr D, Kincaid S, Perrott R. 2003. Multigenerational effects on flowering and fruiting phenology in Plantago lanceolata. Ecology. 84(9):2462–2475. 10.1890/02-0101
- [NOAA]: NWS Duluth winter climate stats and records [Internet]. 2012. Duluth: National Oceanic Atmospheric Association; [updated 2011 Jan 25; cited 2012 Dec 29]. Available from: http://www.crh.noaa.gov/dlh/?n=duluthwinterclimate#miscclimate
- Pors B, Werner PA. 1989. Individual flowering time in a goldenrod (solidago canadensis): field experiment shows genotype more important than environment. Am J Bot. 76(11):1681–1688. 10.2307/2444406
- Rafferty NE, Ives AR. 2011. Effects of experimental shifts in flowering phenology on plant-pollinator interactions. Ecol Lett. 14(1):69–74. 10.1111/j.1461-0248.2010.01557.x
- Sasaki A, De Jong G. 1999. Density dependence and unpredictable selection in a heterogeneous environment: compromise and polymorphism in the ESS reaction norm. Evolution. 53(5):1329–1342. 10.2307/2640880
- Semple JC, Cook RE. 2006. Solidago. In: Flora of North America. Vol. 20. Cambridge: Cambridge University Press; p. 107–157.
- Staggemeier VG, Diniz-Filho JAF, Morellato LPC. 2010. The shared influence of phylogeny and ecology on the reproductive patterns of Myrteae (Myrtaceae). J Ecol. 98(6):1409–1421. 10.1111/j.1365-2745.2010.01717.x
- Tarayre M, Bowman G, Schermann-Legionnet A, Barat M, Atlan A. 2007. Flowering phenology of Ulex europaeus: ecological consequences of variation within and among populations. Evol Ecol. 21(3):395–409. 10.1007/s10682-006-9109-9
- Totland Ø. 2001. Environment-dependent pollen limitation and selection on floral traits in an alpine species. Ecology. 82(8):2233–2244. 10.1890/0012-9658(2001)082[2233:EDPLAS]2.0.CO;2
- Vicens N, Bosch J. 2000. Weather-dependent pollinator activity in an apple orchard, with special reference to Osmia cornuta and Apis melifera (Hymenoptera: Megachilidae and Apidae). Environ Entomol. 29(3):413–420. 10.1603/0046-225X-29.3.413
- Werner PA, Bradbury IK, Gross RS. 1980. The biology of Canadian weeds. 45. Solidago Canadensis L. Can J Plant Sci. 60:1393–1409. 10.4141/cjps80-194
- Widén B. 1991. Phenotypic selection on flowering phenology in Senecio integrifolius, a perennial herb. Oikos. 61(2):205–215. 10.2307/3545338
- Wright SJ, Calderon O. 1995. Phylogenetic patterns among tropical flowering phenologies. J Ecol. 83(6):937–948. 10.2307/2261176