
Abstract
The present study was focused to assess the physiological behavior and antioxidant responses of the medicinal plant Lepidium sativum L. (commonly called Garden cress) subjected hydroponically to NaCl stress during its vegetative growth stage. The results showed that the addition of NaCl to growth medium significantly reduced plant growth. The magnitude of the response was also linked to the plant organ considered and NaCl concentration supplemented to the medium. Tissue hydration seemed unaffected by salinity. Reduction in dry weight (DW) production was associated with a high accumulation of Na+ and Cl− and a significant reduction of K+ content in shoots. The accumulation of osmoregulatory compounds (proline and total sugars) in shoots and roots was greatly increased by NaCl. Activity staining of antioxidants after a native polyacrylamide gel electrophores (PAGE) showed four superoxide dismutase (SOD) isozymes in the extract of leaf-soluble proteins (one Mn-SOD, two Fe-SODs, and one CuZn-SOD), and three isoforms in roots (Mn-SOD, Fe-SOD, and CuZn-SOD). Four peroxidase (POD) isozymes in the roots and only one isozyme in the leaves were detected. The work demonstrated that activities of antioxidant defense enzymes changed in parallel with the increased salinity. In summary, these findings proved that L. sativum can be classified as a moderately tolerant plant to salinity.
Introduction
The medicinal plants are of great interest due to their importance in the human health. Lepidium sativum L. commonly called Garden cress is a polymorphic species. Garden cress is an annual herb, belonging to Brassicaceae family (Kirthikar Citation1952). L. sativum is a polymorphous species and believed to have originated primarily in the highland regions of Ethiopia and Eritrea. It is known for its medicinal value as a source of medicinal compounds. The leaves of Lepidium are antiscorbutic, diuretic, and stimulant. The seeds are aperients, diuretic, tonic, demulcent, aphrodisiac, rubefacient, carminative, galactagogue, and emmenagogue (Nadkarni Citation1954; Diwakar et al. Citation2010; Rehman et al. Citation2012). It is supplemented in the diet of lactating women to increase the milk secretion during postnatal period (Datta et al. Citation2011) and recommended for diarrhea and dysentery. The roots are bitter, acrid, and useful in the treatment of secondary syphillis and tenesmus and used as a condiment (Uphof Citation1959). The aqueous extract of L. sativum L. seeds exhibits hypoglycemic activity both in normal and diabetic rats without affecting insulin secretion (Eddouks et al. Citation2005).
In many countries, this species is grown in arid and semiarid regions where high concentration of salts, mainly chloride sodium (NaCl), is an important characteristic of the soils which has a major impact on plant production and productivity (Zhang & Blumwald Citation2001; Sairam et al. Citation2002; Zhu Citation2002; Juan et al. Citation2005). Plants are stressed in three ways in saline soils: (1) low water potential of the root medium leads to water deficit, (2) the toxic effects of the ions mainly Na+ and Cl−, (3) nutrient imbalance by depression in uptake and/or shoot transport. The result is a wide variety of physiological and biochemical changes in plants that inhibit growth and development, reduce photosynthesis, respiration and protein synthesis, and disrupt nucleic acid metabolism (Levine et al. Citation1990; Zhang & Blumwald Citation2001; Sairam et al. Citation2002).
One of the biochemical changes occurring when plants are subjected to salt stress is the accumulation of reactive oxygen species (ROS) such as superoxide (O2−), hydrogen peroxide (H2O2), and hydroxyl radicals (OH•) (Van Breusegem et al. Citation2001). ROS can seriously disrupt normal metabolism through oxidative damage to lipids, protein, and nucleic acids (Meloni et al. Citation2003) and damage membrane function (Gómez et al. Citation2004). Plants can regulate the ROS by scavenging them with antioxidant enzymes such as superoxide dismutase (SOD), catalase (CAT), and peroxidases (Bano et al. Citation2013). The existence of multiple molecular forms of antioxidant enzymes and any changes they may undergo in response to various environmental signals imply potential roles for these isozymes in the detoxification of ROS (Pinhero et al. Citation1997). The isozymes could be used as a biochemical marker to study the tolerance of plant to stress (Zhang et al. Citation2013).
The elucidation of physiological and biochemical mechanisms is critical before trying to introduce genetic and environmental improvements to salt stress (Ashraf & Harris Citation2004; Manaa et al. Citation2013). Salt-tolerance mechanisms are quite complex, including osmotic adjustment, compartimentation of toxic ions (Munns & Tester Citation2008), metabolite accumulation, ion homeostasis, redox control, and scavenging of activated oxygen species (Gill & Tuteja Citation2010).
Several studies look at plant response to salt stress factors and contribute to a better understanding of physiological mechanisms underlying plant stress response. These researches in relation to the effect of salinity have mostly been carried out on agricultural, forage, and fuel wood species. However, it appears that little information is available regarding the effect of salinity on the growth and productivity of medicinal plants. L. sativum L., Linum usitatissimum L., Plantago ovata Forssk, and Trigonella foenum-graecum L. have been evaluated and proved to be moderately salt tolerant at germination and seedling growth stage (Muhammad & Hussain Citation2010a). The aim of this study was to investigate, for the first time, the physiological and antioxidant responses of L. sativum, a medicinal plant subjected hydroponically to NaCl stress at their vegetative growth.
Materials and methods
Plant material and growth conditions
Seeds of L. sativum were germinated in commercial peat irrigated with fully nutrient solution and were incubated under fluorescent light (90 µmol m−2 s−1 with a 16 h photoperiod at 25 °C). When germinated, seedlings were transferred to a growth chamber (25 °C/70% relative humidity during the day and 20 °C/90% relative humidity during the night; photoperiod: 16 h daily with a light irradiance of 150 µmol m−2 s−1). They were grown in adapted ‘Hoagland solution’ (Hoagland & Arnon Citation1950), continuously aerated containing: KNO3 3 mM, Ca(NO3)2 1 mM, KH2PO4 2 mM, MgSO4 0.5 mM, Fe-Ethylenediaminetetraacetic acid (EDTA) 32.9 µM, and micronutrients: H3BO4 30 µM, MnSO4 5 µM, CuSO4 1 µM, ZnSO4 1 µM, and (NH4)6Mo7O 1 µM for 10 days. At this time, five concentrations of NaCl were applied: 0 (control), 50, 100, 150, and 200 mM. To avoid osmotic shock, NaCl concentrations were increased gradually by 25 mM every day until the desired concentration was reached. The nutrient solutions were replaced each three days. The pH of the nutrient solution was adjusted each time to 5.5 with a minimum amount of 0.1 mM KOH. After 15 days of treatments, for the determination of the dry weight (DW), plants were then separated into roots, stems, and leaves, and oven-dried at −80 °C (for three days). Besides, fresh shoot and root samples from each plant were immediately frozen in liquid nitrogen and stored at –80 °C, until performing the biochemical analysis.
Growth and water relations
For plant growth and ion analysis, 20 independent dry matter measurements and ion analysis were performed on separated leaves, stems, and roots. Shoot or root water content (WC) was calculated as (FW–DW)/FW, where FW and DW represent the fresh and dry weight, respectively.
The sensitivity index (SI) that means the difference between dry matter production of salt-treated plants and the control, expressed in percent of the latter, were calculated according to the following expression:
This parameter SI was much lower when the plant was sensitive to NaCl (Saadallah et al. Citation2001).
Ions analysis
For the measurement of cations, plant material was dried at 80 °C and digested with nitric acid (1% (v/v) HNO3) according to the method of Wolf (Citation1982). K+ and Na+ were analyzed by flame emission using an Eppendorf spectrophotometer. Cl− was quantified by a colorimetric method using a Digital Chloridometer HaakeBuchler (Buchler instruments Inc., New Jersey, USA).
Free proline and soluble sugars
Proline content was determined using the method of Bates et al. (Citation1973). Proline was extracted from organs samples of 200 mg FW with 10 mL of 3% sulphosalycylic acid at 70 °C for 30 min. After an addition of acid ninhydrin and glacial acetic acid to the extracts, the mixture was heated at 90 °C for 1 h in water bath. Reaction was then stopped by using an ice bath. The mixture was extracted with toluene, and the absorbance of fraction with toluene aspired from the liquid phase were spectrophotometrically determined at 520 nm. Proline concentration was determined using calibration curve as μmol proline g−1 FW.
Total soluble sugars were estimated by the anthrone reagent method using glucose as the standard (Yemm & Willis Citation1954).
Protein extraction and quantification
Aliquot of frozen leaf and root material was ground to a fine powder with liquid nitrogen and extracted (100 mg FW, 300 ml) at 4 °C in 100 mM Tris–HCl buffer (pH 8.0) containing 10 mM EDTA, 50 mM KCl, 20 mM MgCl2, 0.5 mM phenylmethylsulfonyl fluoride (PMSF), 1 mM dichlorodiphényltrichloroéthane (DDT), 0.1% (v/v) Triton X-100, and 10% (w/w) polyvinylpyrrolidone (PVP). The homogenate was centrifuged at 13,000 × g for 40 min at 4 °C, and the supernatant was clarified by filtration. The filtrate was used for the determination of antioxidative enzyme activities. Soluble protein concentration in enzyme extract was estimated according to Bradford (Citation1976), using Sigma reagent (B6916) and bovine serum albumin as standard. Three replicates per treatment were used.
Native gel electrophoresis and enzyme activity staining
Polyacrylamide gel electrophoresis (PAGE) was performed to separate the different enzyme isoforms using a discontinuous gel system under nondenaturing conditions, essentially as described by Tewari et al. (Citation2008).
Samples of L. sativum shoot or root extracts were separated by gel electrophoresis in 10% (w/v) polyacrylamide slab gel at pH 8.9 under native conditions, according to Davis (Citation1964). Staining for SOD activity was carried out as described by Beauchamp and Fridovich (Citation1971). The gel was first soaked in 50 mM sodium phosphate, (pH 7.5) containing 4.8 mM 3-(4,5-dimethylthiazol-2-yl)-2,5-diphenyltetrazolium bromide (MTT) in darkness for 20 min, followed by soaking in 50 mM sodium phosphate (pH 7.5) containing 0.4% (v/v) N,N,N0,N0-tetramethylethylenediamine (TEMED) and 26 mM riboflavin, and subsequently illuminated for 10 min. The three types of SOD, Fe-SOD, Mn-SOD, and Cu-Zn SOD were identified using inhibitors. Mn-SOD was visualized by its insensitivity to 5 mM H2O2 and 2 mM Cyanure de potassium (KCN), while Cu-Zn SOD was sensitive to 2 mM KCN. Fe-SOD was inhibited by 5 mM H2O2 (Navari-Izzo et al. Citation1998).
Peroxidase (POD) isoforms were visualized on gels according to Vallejos (Citation1983). POD was localized by incubating the gel for 20 min in a reaction mixture containing 20 ml 0.1 M phosphate buffer (pH 7.0), 4 ml 0.01% H2O2, and 4 ml 0.5% guaiacol or 3,3′-diaminobenzidine. It was then rinsed with distilled water and scanned immediately.
Statistical analysis
The statistical analyses were performed with the ‘Statistica’ software (version 6.0). All physiological and biochemical parameters, mean values, and standard error (SE) were obtained from 4 to 20 replicates and analyzed using Duncan's multiple range test. A P value of <0.05 was considered to be statistically significant. For gel analysis, profile of representative gel was recorded by selecting region of interest (lanes) using ImageJ 1.42 software.
Results
Growth parameters and WC
We observed that 15 days of salt treatment decreased plant growth of L. sativum, at all levels of NaCl added to the medium (). The effect of NaCl on plant growth was assessed by measuring the DW of the leaf, stem and root. Fort the whole plant, reduction value ofDW, expressed as the ratio of the treatment to the control, was about 45% under 100, 150, and 200 mM NaCl (). The magnitude of the response was also linked to the plant organ considered and NaCl concentration. Salt stress treatment inducing a strong reduction of leaf, stem, and root DW at all levels of NaCl except 50 mM (–). However, the root DW was more sensitive to salt treatment than aerial parts at concentrations higher than 50 mM NaCl. Root DW reduction was 38%, 57%, 66%, and 60%, respectively, for 50, 100, 150, and 200 mM NaCl ().
Table 1. Biomass production sensitivity index in L. sativum exposed to salt.
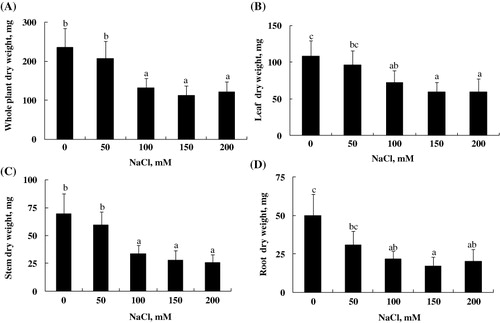
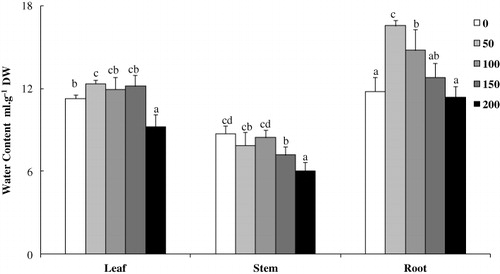
Although salinity also induces a water stress component in relation to a decrease of external water potential, our data suggest that as compared to control treatment NaCl treatment had no effect on leaf and stem WC, except concentration of 200 mM NaCl, which slightly decreased leaf WC (18%) and stem WC (26%) ().
Changes in ion accumulation
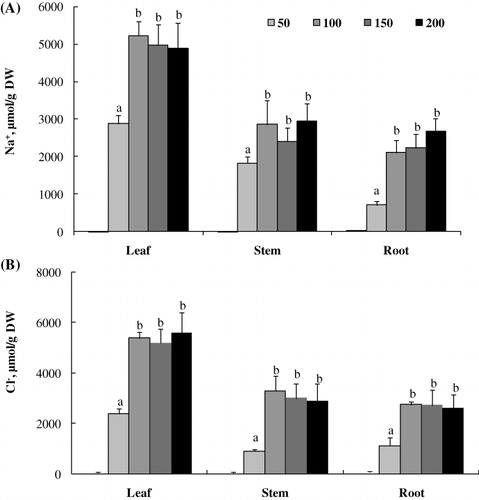
L. sativum plants cultivated under increasing salinity showed a significantly higher Na+ and Cl− accumulation in the leaves as compared to the roots and stems (). The highest concentration of Na+ and Cl− was recorded with 100, 150, and 200 mM NaCl. Leaf Na+ concentration ranged from ca. 2880 to 4900 µmol g−1 DW at 50 mM and 200 mM NaCl, respectively, whereas those of roots varied from ca. 700 to 2600 µmol g−1 DW (). Chloride concentration showed similar changes as sodium ().
On the other hand, salt treatment induced a significant reduction of K+ content as compared to control treatment (). The magnitude of K+ content reduction, in leaves and stems, was steady whatever the NaCl concentration. Leaf K+ content varied from ca. 1700 to 600 µmol.g−1 DW at 0 mM and 200 mM NaCl, respectively. However, as compared to the shoots, root showed the lowest reduction of K+ content at all NaCl concentrations. This reduction was about 33% as compared to control treatment ().
![Figure 4. K+ contents (A) and osmolality [2*(K + Na)] (B) of L. sativum exposed to NaCl treatment (0, 50, 100, 150, and 200 mM), for 15 days. Data are means of 20 replicates ±SE. Means with similar letters are not different at P < 0.05 according to Duncan's multiple range test at 95%.](/cms/asset/b6ba337c-67f9-4b95-a4c5-28dd98ac8129/tjpi_a_850596_f0004_b.jpg)
The osmolality increased in leaf, stem, and root with increasing salinity. In fact, whatever, the NaCl concentration supplemented, shoots (leaves and roots) showed the highest osmolality (2*(K + Na)) than the roots and the medium ().
Compatible solutes (proline and sugars)
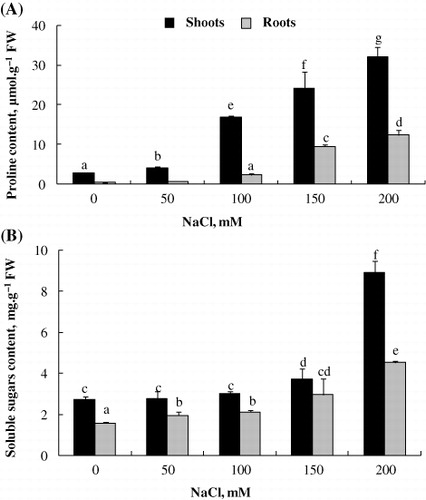
Total soluble carbohydrates and proline are the important components of plants adaptation to salinity. In the present study, we found an accumulation of proline and total soluble sugars in L. sativum plants cultivated under salt conditions (). In fact, the proline level gradually increased with increasing salinity (). Higher levels of proline and total soluble sugars were detected at 200 mM NaCl. Whatever the NaCl concentration, total soluble sugars and proline contents were much higher in shoots than roots. Total soluble sugars level, markedly, increased only in response to 150 and 200 mM NaCl for the shoots (). Shoots sugars content ranged from ca. 3 to 9 mg.g−1 FW at 0 mM and 200 mM NaCl, respectively, whereas those of roots varied from ca. 1.7 to 4.2 mg.g−1 FW ().
Isozyme patterns of the antioxidant enzymes under NaCl stress
We explored the impact of NaCl on the antioxidant isozymes profiles. Indeed, the separation of SOD isozymes (after native PAGE) coupled with different specific inhibitors showed four SOD isozymes in the extract of leaf-soluble proteins: one Mn-SOD, two Fe-SODs (denominated Fe-SOD1 and Fe-SOD2), and one CuZn-SOD (). Examination of SOD isoenzyme profiles in the roots revealed a total of three isoforms: Mn-SOD, Fe-SOD, and CuZn-SOD ().
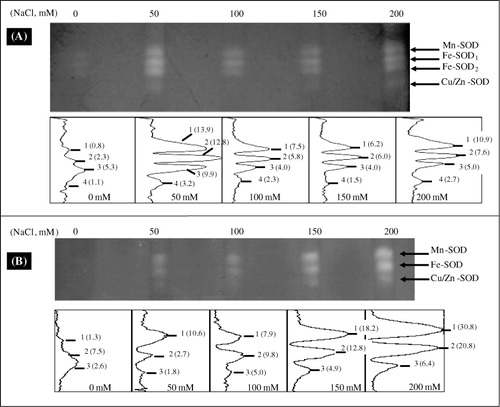
Quantification of the SOD bands intensities by densitometric scanning revealed that Mn-SOD and Fe-SODs were the predominant isozymes. The intensity level of all SOD isozymes increased under NaCl treatments as compared to control. The highest intensity level of SOD isozymes in leaves was detected with 50 mM NaCl. However, intensity of all SOD isozymes in roots, gradually, increased with increasing salinity (). Root Mn-SOD was more activated under salinity than the others SOD isoforms.
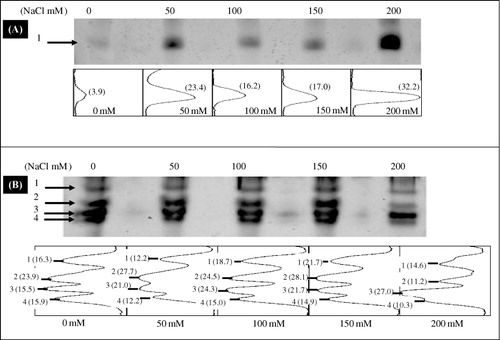
Native PAGE showed four POD isozymes (POD1–4) in the roots and only one isozyme in the leaves (). Densitometric scanning revealed that intensity of leaf POD isoform, gradually, increased with increasing salinity and was more intense at the salt level of 200 mM (), whereas, salinity treatments had no effect on root POD isoforms except concentration of NaCl 200 mM when the intensity of two POD isozymes (POD1 and POD2) was decreased ().
Discussion
Soil salinity is a major abiotic stress, which impairs the plant growth and development by adversely damaging the various plant metabolic processes, i.e. nitrogen and sulfur assimilation, antioxidant system, and photosynthesis (Zhu Citation2002; Sairam & Tyagi Citation2004; Manaa et al. Citation2011; Shaheen et al. Citation2012). In the present study, we conducted experiments to test the physiological and antioxidant responses of L. sativum subjected hydroponically to salinity stress. Our data showed that in the presence of NaCl, the growth medium significantly reduced plant growth of L. sativum. The magnitude of the response was also linked to the plant organ considered and NaCl concentration supplemented to the medium (). The present findings agree with those of Muhammad and Hussain (Citation2010b) who report that salinity, significantly, inhibited the growth of L. sativum, which resulted in a decrease of DW of both shoots and roots and which could be attributed to the adverse lowering of osmotic potential.
The root growth was more sensitive to salt treatment than aerial parts (see sensitive index; ). This sensitivity of the root system seems to be a feature of L. sativum. Generally it is the aerial organs, which manifest the depressive effect of salt (Dasgan et al. Citation2002). These results are in agreement with the study of Ben Ahmed et al. (Citation2008) on Setaria verticillata. According to the author, the sensitivity to salinity observed at the root system of Setaria results in a decrease in biosynthetic activity. Reduction in DW production was associated with a high accumulation of Na+ and Cl− and a significant reduction of K+ content in shoots. This limitation in the supply of the plant in this essential cation was observed in most other Brassicaceae as Arabidopsis thaliana (Munns & Tester Citation2008). The growth reduction observed is probably induced by the decline in K+ uptake. Indeed, an analysis of the relationship between biomass production and the amount of K+ absorbed in the roots and exported in shoots (stems and leaves) of plants subjected to NaCl, showed that growth of these organs is highly correlated with the amount of potassium transported and accumulated in them.
Although salinity also induces a water stress component in relation to a decrease of external water potential, our data suggest that under our experimental conditions, L. sativum was able to cope with this component of salt stress since no decrease in leaf WC was recorded after 15 days of exposure to NaCl (50, 100, and 150 mM). In contrast, a salt-induced increase in root WC was even recorded at 50 and 100 mM NaCl (), which might be related to an attempt to dilute toxic ions through a succulence strategy. This water status could be linked to the increase in osmolality detected in our experiment. Indeed, the increase in osmolality has been regarded as an indicator for osmotic adjustment (Fricke et al. Citation2004).
Under salt stress, plants have involved complex mechanisms allowing for adaptation to osmotic and ionic stress caused by high salinity. These mechanisms includes osmotic adjustment by accumulation of compatible solutes such as proline and sugars (Gill & Tuteja Citation2010). Amino acid proline, which is known to occur widely in higher plants, normally accumulates in large amounts in response to various abiotic stresses (Ashraf Citation1994; Ali et al. Citation1999). Proline was known to be an osmoregulatory compound involved in maintaining the water balance of the plant exposed to salinity (Okuma et al. Citation2004). It not only acts as cytoplasmic osmolyte facilitating water retention but also as a protector and a stabilizer of macromolecules and cellular structures (Bohnert & Jensen Citation1996). It has long been suggested that accumulation of proline in plant tissue under salt stress is an adaptative response even though investigators have obtained contrasting results regarding the role of proline in stress tolerance of plants (Ashraf Citation1994; Rhodes et al. Citation1999). In L. sativum, the proline content in shoots and roots was greatly increased after 15 days of treatment in the presence of NaCl. The accumulation of this solute in the different organs is proportional to the amount of salt added to the medium.
On the other hand, sugars are considered to play a major role in osmoregulation under abiotic stress conditions (Fallon & Phillips Citation1988; Patade et al. Citation2011). In fact, the first effect of salinity on plants is a drought effect or a water deficit. Plants try to reduce their osmotic potential via increasing mineral ions content and compatible solutes synthesis to better water uptake under salinity. Total soluble carbohydrates are important solutes that are synthesized and accumulated in cytosol under salt stress. Thus, they are necessary for the survival of the plant because they are a source of carbon and energy (Rejskova et al. Citation2007; Krasensky & Jonak Citation2012). In our study, the presence of NaCl in the medium also induces an increase in total soluble sugars contents. Collectively, the significant accumulation of proline and sugars in the different organs was probably associated with osmotic adjustment in L. sativum.
Exposure of plants to salt stress increase the production of ROS such as singlet oxygen (1O2), superoxide radical (O2• − ), hydrogen peroxide (H2O2), and hydroxyl radical (OH•), and these ROS cause oxidative damage to different cellular components, including membrane lipids, protein, and nucleic acids (Apel & Hirt Citation2004; Tanaka et al. Citation2006). Previous data revealed that the balance of ROS formation and the removal are a determinant factor for the severity of oxidative stress and cell damage (Mittler et al. Citation2004; Sahi et al. Citation2006). Previous works showed that salt tolerance is closely related to the efficiency of antioxidant enzymes (Khan et al. Citation2009; Shaheen et al. Citation2012). SOD and POD are among the major antioxidant enzymes involved in scavenging ROS (Askari et al. Citation2006; Bhushan et al. Citation2007). Our data support this hypothesis since clearly displaying significantly increased SOD and POD isoforms activities in shoots and roots of L. sativum plants cultivated under increasing salinity. Our results contrast with previous work which revealed that salt induced alterations in the antioxidative system (Saleh & Plieth Citation2009). According to the author, salt stress (150 mM NaCl) inhibits the glutathione reductase (GR) and CAT of L. sativum seedlings.
On the basis of these results, it was concluded that L. sativum can be classified as a moderately tolerant plant to salt stress. The salt tolerance of L. sativum would be partially based on: its ability to maintain convenient tissue water supply, osmotic adjustment by accumulation of osmoregulatory compounds such as proline and sugars, the aptitude of the whole plant to ensure a sufficient K+ supply by maintaining a high selectivity for this essential nutrient in spite of large amount of Na+ in the medium and to exhibit high-antioxidant enzyme activities (SOD–POD), preventing the toxic accumulation of ROS.
Acknowledgment
The authors acknowledge the Ministry of Higher Education and Scientific Research of Tunisia for financial support. Many thanks to Mr. Fadhel BEN AICH for technical assistance and taking care of the plants. We also thank Dr. Abdellah CHALH for statistical help and Amel Terras critical reading of the manuscript.
Related Research Data
References
- Ali G, Srivastava PS, Iqbal M. 1999. Proline accumulation, protein pattern and photosynthesis in Bacopa monniera regenerants grown under NaCl stress. Biologia Plant. 42: 89–95. doi:10.1023/A:1002127711432
- Apel K, Hirt H. 2004. Reactive oxygen species: metabolism, oxidative stress, and signal transduction. Ann Rev Plant Biol. 55: 373–399. doi:10.1146/annurev.arplant.55.031903.141701
- Ashraf M. 1994. Organic substances responsible for salt tolerance in Eruca sativa. Biologia Plant. 36: 61–71. doi:10.1007/BF02921095
- Ashraf M, Harris PJC. 2004. Potential biochemical indicators of salinity tolerance in plants. Plant Sci. 166: 3–16. doi:10.1016/j.plantsci.2003.10.024
- Askari H, Edqvist J, Hajheidari M, Kafi M, Salekdeh GH. 2006. Effects of salinity levels on proteome of Suaeda aegyptiaca leaves. Proteomics. 6: 2542–2554. doi:10.1002/pmic.200500328
- Bano S, Ashraf M, Akram NA. 2013. Salt stress regulates enzymatic and nonenzymatic antioxidative defense system in the edible part of carrot (Daucus carota L.). J Plant Interact. 1–6. doi:10.1080/17429145.2013.832426
- Bates L, Waldren R, Teare I. 1973. Rapid determination of free proline for water-stress studies. Plant Soil. 39: 205–207. doi:10.1007/BF00018060
- Beauchamp C, Fridovich I. 1971. Superoxide dismutase: improved assays and applicable to acrylamide gels. Anal Biochem. 44: 276–287. doi:10.1016/0003-2697(71)90370-8
- Ben Ahmed H, Manaa A, Zid E. 2008. Tolérance à la salinité d'une poaceae à cycle court: la sétaire (Setaria verticillata L.). C R Biol. 331: 164–170. doi:10.1016/j.crvi.2007.12.002
- Bhushan D, Pandey A, Choudhary MK, Datta A, Chakraborty S, Chakraborty N. 2007. Comparative proteomics analysis of differentially expressed proteins in chickpea extracellular matrix during dehydration stress. Mol Cell Proteomics. 6: 1868–1884. doi:10.1074/mcp.M700015-MCP200
- Bohnert HJ, Jensen RG. 1996. Strategies for engineering water-stress tolerance in plants. Trends Biotechnol. 14: 89–97. doi:10.1016/0167-7799(96)80929-2
- Bradford M. 1976. A rapid and sensitive method for quantitation of microgram quantities of protein utilizing the principle of protein-dye-binding. Anal Biochem. 72: 248–254. doi:10.1016/0003-2697(76)90527-3
- Dasgan HY, Aktas H, Abak K, Cakmak I. 2002. Determination of screening techniques to salinity tolerance in tomatoes and investigation of genotype responses. Plant Sci. 163: 695–703. doi:10.1016/S0168-9452(02)00091-2
- Datta PK, Diwakar BK, Viswanatha S, Murthy KN, Naidu KA. 2011. Safety evaluation studies on Garden cress (Lepidium sativum L.) seeds in Wistar rats. Int J Appl Res Nat Prod. 4: 37–43.
- Davis BJ. 1964. Disc electrophoresis. II. Method and application to human serum proteins. Ann N Y Acad Sci. 121: 404–427. doi:10.1111/j.1749-6632.1964.tb14213.x
- Diwakar B, Dutta P, Lokesh B, Naidu K. 2010. Physicochemical properties of garden cress (Lepidium sativum L.) seed oil. J Am Oil Chem Soc. 87: 539–548. doi:10.1007/s11746-009-1523-z
- Eddouks M, Maghrani M, Zeggwagh NA, Michel JB. 2005. Study of the hypoglycaemic activity of Lepidium sativum L. aqueous extract in normal and diabetic rats. J Ethnopharmacol. 97: 391–395. doi:10.1016/j.jep.2004.11.030
- Fallon KM, Phillips R. 1988. Responses to water stress in adapted and unadapted carrot cell suspension cultures. J Exp Bot. 40: 681–687. doi:10.1093/jxb/40.6.681
- Fricke W. 2004. Rapid and tissue-specific accumulation of solutes in the growth zone of barley leaves in response to salinity. Plant. 219: 515–525.
- Gill SS, Tuteja N. 2010. Reactive oxygen species and antioxidant machinery in abiotic stress tolerance in crop plants. Plant Physiol Biochem. 48: 909–930. doi:10.1016/j.plaphy.2010.08.016
- Gómez LD, Noctor G, Knight MR, Foyer CH. 2004. Regulation of calcium signalling and gene expression by glutathione. J Exp Bot. 55: 1851–1859. doi:10.1093/jxb/erh202
- Hoagland DR, Arnon DI. 1950. The water culture method for growing plants without soil. California Agr Exp Station Circular. 347: 1–32.
- Juan M, Rivero RM, Romero L, Ruiz JM. 2005. Evaluation of some nutritional and biochemical indicators in selecting salt-resistant tomato cultivars. Environ Exp Bot. 54: 193–201. doi:10.1016/j.envexpbot.2004.07.004
- Khan F, Siddiqi TO, Mahmood U, Ahmad A. 2009. Morphological changes and antioxidant defence systems in soybean genotypes as affected by salt stress. J Plant Interact. 4: 295–306. doi:10.1080/17429140903082635
- Kirthikar KR. 1952. Lepidium sativum L. In: Kirthikar KR, Basu BD, editors. Indian Medicinal Plants 1. India: Lalith Mohan Basu; p. 174–175.
- Krasensky J, Jonak C. 2012. Drought, salt, and temperature stress-induced metabolic rearrangements and regulatory networks. J Exp Bot. 63:1593–1608. doi:10.1093/jxb/err460
- Levine R, Garland D, Oliver C, Amici A, Climent I, Lenz A, Ahn B, Shaltiel S, Stadtman E. 1990. Determination of carbonyl content in oxidatively modified proteins. Methods Enzymol. 186: 464–478.
- Manaa A, Ben Ahmed H, Valot B, Bouchet JP, Aschi-Smiti S, Causse M, Faurobert M. 2011. Salt and genotype impact on plant physiology and root proteome variations in tomato. J Exp Bot. 62:2797–2813. doi:10.1093/jxb/erq460
- Manaa A, Faurobert M, Valo B, Bouchet JP, Grasselly D, Causse M, Ben Ahmed H. 2013. Salt and calcium impact on tomato fruit proteome. OMICS A J Integr Biol. 17: 338–352. doi:10.1089/omi.2012.0108
- Meloni DA, Oliva MA, Martinez CA, Cambraia J. 2003. Photosynthesis and activity of superoxide dismutase, peroxidase and glutathione reductase in cotton under salt stress. Environ Exp Bot. 49: 69–76. doi:10.1016/S0098-8472(02)00058-8
- Mittler R, Vanderauwera S, Gollery M, Van Breusegem F. 2004. Reactive oxygen gene network of plants. Trends Plant Sci. 9: 490–498. doi:10.1016/j.tplants.2004.08.009
- Muhammad Z, Hussain F. 2010a. Effect of NaCl salinity on the germination and seedling growth of some medicinal plants. Pak J Bot. 42: 889–897.
- Muhammad Z, Hussain F. 2010b. Vegetative growth performance of five medicinal plants under NaCl salt stress. Pak J Bot. 42: 303–316.
- Munns R, Tester M. 2008. Mechanisms of salinity tolerance. Ann Rev of Plant Biol. 59: 651–681. doi:10.1146/annurev.arplant.59.032607.092911
- Nadkarni KM, Nadkarni AK. 1954. Lepidium sativum Linn. In: The Indian Materia Medica With Ayurvedic, Unani and Home remedies. 3rd ed. Bombay: Popular Prakashan; p. 736–737.
- Navari-Izzo F, Quartacci MF, Pinzino C, Dalla vecchia F, Sgherri CLM. 1998. Thylakoid-bound and stromal antioxidative enzymes in wheat treated with excess copper. Physiol Plant. 104: 630–638. doi:10.1034/j.1399-3054.1998.1040416.x
- Okuma E, Murakami Y, Shimoishi Y, Tada M, Murata Y. 2004. Effects of exogenous application of proline and betaine on the growth of tobacco cultured cells under saline conditions. Soil Sci and Plant Nutr. 50: 1301–1305. doi:10.1080/00380768.2004.10408608
- Patade VY, Bhargava S, Suprasanna P. 2011. Salt and drought tolerance of sugarcane under iso-osmotic salt and water stress: growth, osmolytes accumulation, and antioxidant defense. J Plant Interact. 6: 275–782. doi:10.1080/17429145.2011.557513
- Pinhero RG, Rao MV, Paliyath C, Murr DP, Fletcher RA. 1997. Changes in activities of antioxidant enzymes and their relationship to genetic and paclobutrazol-induced chilling tolerance of maize seedlings. Plant Physiol. 114: 695–704.
- Rehman N, Mehmood MH, Alkharfy KM, Gilani AH. 2012. Studies on antidiarrheal and antispasmodic activities of Lepidium sativum crude extract in rats. Phytother Res. 26: 136–141. doi:10.1002/ptr.3642
- Rejskova A, Patkova L, Stodulkova E, Lipavska H. 2007. The effect of abiotic stresses on carbohydrate status of olive shoots (Olea europaea L.) under in vitro conditions. Plant Physiol. 164: 174–184. doi:10.1016/j.jplph.2005.09.011
- Rhodes D, Verslues PE, Sharp RE. 1999. Role of amino acids in abiotic stress resistance. In: Singh BK, editor. Plant amino acids: biochemistry and biotechnology. New York: Dekker; p. 319–356.
- Saadallah K, Drevon JJ, Abdelly C. 2001. Nodulation et croissance nodulaire chez le haricot (Phaseolus vulgaris) sous contrainte saline [Nodulation and growth of nodules in the common bean (Phaseolus vulgaris) under salt stress]. Agronomie. 21: 627–634. doi:10.1051/agro:2001154
- Sahi C, Singh A, Blumwald E, Grover A. 2006. Beyond osmolytes and transporters: novel plant salt-stress tolerance related genes from transcriptional profiling data. Physiol Plant. 127:1–9. doi:10.1111/j.1399-3054.2005.00610.x
- Sairam RK, Rao KV, Srivastava GC. 2002. Differential response of wheat genotypes to long term salinity stress in relation to oxidative stress, antioxidant activity and osmolyte concentration. Plant Sci. 163: 1037–1046. doi:10.1016/S0168-9452(02)00278-9
- Sairam RK, Tyagi A. 2004. Physiology and molecular biology of salinity stress tolerance in plants. Curr Sci. 86: 407–421.
- Saleh L, Plieth C. 2009. Fingerprinting antioxidative activities in plants. Plant Methods. 5: 2. doi:10.1186/1746-4811-5-2
- Shaheen S, Naseer S, Ashraf M, Akram NA. 2012. Salt stress affects water relations, photosynthesis, and oxidative defense mechanisms in Solanum melongena L. J Plant Interact. 8: 85–96. doi:10.1080/17429145.2012.718376
- Tanaka A, Christensen MJ, Takemoto D, Park P, Scott B. 2006. Reactive oxygen species play a role in regulating a fungus-perennial ryegrass mutualistic interaction. Plant Cell. 18: 1052–1066. doi:10.1105/tpc.105.039263
- Tewari RK, Kim S, Hahn EJ, Paek KY. 2008. Involvement of nitric oxide-induced NADPH oxidase in adventitious rootgrowth and antioxidant defense in Panax ginseng. Plant Biotechnol Rep. 2: 113–122. doi:10.1007/s11816-008-0052-9
- Uphof JCT. 1959. Dictionary of economic plants. 2nd ed. New York: Verlag Von J Crammer; p. 308.
- Vallejos CE. 1983. Enzyme activity staining. In: Tanksley SD, Orton TJ, editor. Isozymes in plant genetics and breeding Part A. Amsterdam, The Netherlands: Elsevier; p. 469–516.
- Van Breusegem F, Vranova E, Dat JF, Inze D. 2001. The role of active oxygen species in plant signal transduction. Plant Sci. 161: 405–414. doi:10.1016/S0168-9452(01)00452-6
- Wolf B. 1982. A comprehensive system of leaf analyses and its use for diagnosing crop nutrient status. Commun Soil Sci Plant Anal. 13: 1035–1059. doi:10.1080/00103628209367332
- Yemm W, Willis AJ. 1954. The estimation of carbohydrates in plant extracts by anthrone. Biochem J.57: 508–516.
- Zhang HX, Blumwald E. 2001. Transgenic salt-tolerant tomato plants accumulate salt in foliage but not in fruit. Nat Biotechnol. 19: 765–768. doi:10.1038/90824
- Zhang M, Fang Y, Ji Y, Jiang Z, Wang L. 2013. Effects of salt stress on ion content, antioxidant enzymes and protein profile in different tissues of Broussonetia papyrifera. S Afr J Bot. 85: 1–9. doi:10.1016/j.sajb.2012.11.005
- Zhu JK. 2002. Salt and drought stress signal transduction in plants. Ann Rev Plant Biol. 53: 247–273. doi:10.1146/annurev.arplant.53.091401.143329