
Abstract
In order to understand the continuous defense reactions of host plants against insect attack, a tobacco variety G140 was infested by tobacco aphid Myzus persicae for 2 h to 5 d. The changes of transmembrane ionic fluxes (Ca2+) and hydrogen peroxide (H2O2) were detected by the technique of noninvasive micro-test and their relationship was further studied. It was found that H2O2 accumulation depended on Ca2+ influx. Ca2+ flux exhibited a strong influx at all infestation periods by aphids, while H2O2 showed an efflux behavior. The slight variation tendency of Ca2+ influx and H2O2 efflux was consistent. The activities of the corresponding defense proteins, peroxidase (POD) and catalase (CAT) enzyme, were enhanced to respond to the insect attacks, much higher than those tobacco in control. The Ca2+ influx and H2O2 efflux, as well as the activities of POD and CAT enzymes, were increased in a long period of aphid feeding. It indicated that a continuous physiological response of tobacco to aphid infestation could be initiated and lasted for a long time.
Introduction
Intricate defense systems were amazingly developed by plants in their long evolution process to defend attacks from insects and pathogens. It has been well known that host plants can initiate signal transduction responding to insect feeding, and then activate the related physiological and biochemical reactions. The early signal events during defense responses in plants usually include transmembrane ionic fluxes and the production of reactive oxygen species (ROS). These two events have been received considerable attentions from various research fields (Maffei et al. Citation2006; Howe & Jander Citation2008; Wu & Baldwin Citation2009, Citation2010; Roy & Dhandapani Citation2011). For the ionic fluxes, calcium ion (Ca2+) has been considered as an important second messenger in plant cells because it can be involved in many signal transduction pathways. Ca2+ transmembrane transport, as well as hydrogen peroxide (H2O2), plays an important role in triggering and regulating plant defense responses for insect attacks. Previous studies unraveled that Ca2+ and H2O2 concentrations would be significantly changed in host plants as negative effects of insects. For example, Spodoptera littoralis is able to induce Ca2+ influx changes at the feeding site of lima beans Phaseolus lunatus (Maffei et al. Citation2004). Except physical injuries, Spodoptera littoralis feeding would cause H2O2 accumulation near the feeding site in the injured leaves of host plants. Moreover, the accumulated H2O2 would diffuse into other tissues through veins and membrane in cells. The Ca2+ concentration was found to be increased with an increase of H2O2 concentration (Maffei et al. Citation2006). It was the larval oral secretion from orgyia ericae that induced Ca2+ influx and H2O2 accumulation in Ammopiptanthus mongolicus cells. The emergence of Ca2+ influx and the variation of hydrogen peroxide were considered as early signaling events in response to the regurgitated components (Gao et al. Citation2012).
Defense proteins, such as phenylalanine ammonia lyase, peroxidase (POD), catalase (CAT), and polyphenol oxidase, play an important role in defense reactions of host plants. They can stimulate the transport of insect-resistance signals during the defense response and induce to produce related compounds and enzymes in following cascade reactions after insect invasion (Mao et al. Citation2011, Citation2012). It has been widely reported that insect feeding influences the activities of plant defense enzymes and associates with host resistance (Zhang et al. Citation2012).
The noninvasive micro-test technique (NMT) is a useful tool to study membrane-transport processes of ions and molecules in plants. The main advantages of the tool were illustrated in literatures (Yin et al. Citation2006), including no special treatment of samples, real-time measurement of concentration and flux velocity of molecules and ions, and high resolution. In the recent two decades, this technique has been widely used to elucidate the critical roles of membrane-transport processes in response to various abiotic and biotic stressors including salinity, osmotic stress, extreme temperature, acidity, oxygen deprivation, nutritional disorder, oxidative stress, and pathogens (Shabala & Bose Citation2012).
Tobacco aphid Myzus persicae (Sulzer) (Hemiptera: Aphididae) is a kind of agricultural pest threatening many crops, such as tobacco (Nicotiana tabacum), potato (Solanum tuberosum), and peach tree (Amygdalus persica), around the world (Blackman & Eastop Citation2000). Tobacco aphid not only endangers plant hosts by directly feeding on them, but also acts as a vector for transmitting many viruses among plants (Ng & Perry Citation2004). Kusnierczyk et al. (Citation2007, Citation2008) systemically studied the time-dependent aspect of induced changes in the aphid feeding on plants and addressed a model of plant–aphid interactions at the early phase of infestation.
Many studies on the relationship between insects and host plants focus on physical, chemical, and molecular mechanisms (Will & van Bel Citation2006; Roy & Dhandapani Citation2011; Smith & Clement Citation2012). The ion and molecule changes in defense response of host plants were mainly measured at discrete times. However, the continuous changes could not be determined during the feeding periods of aphids. In this work, the duration of the continuous defense reactions of host plants against aphid attack was investigated through the detection of the Ca2+ and H2O2 changes by the NMT method. The related enzymes activities in tobacco at different aphids feeding periods further unraveled the defense responses of the infested tobacco.
Materials and methods
Plants and insects
A tobacco variety G140 Nicotiana tabacum, which is prone to aphid feeding, was used. Tobacco seedlings were planted in pots (60 mm in diameter) and treated at seven or eight leaf stages. Tobacco aphids were collected from tobacco fields in Xichang city, Sichuan province, China and maintained on G140 tobacco in artificial climatic chambers at conditions of 25 ± 1°C, 75 ± 5% RH, and a photoperiod of 14:10 h (L:D).
Sample treatment
The materials for NMT and enzymatic activity measurements were treated as the following procedure. Ten wingless adult aphids were incubated to the second or the third unfurling leaf of the tobacco seedlings, which were selected with uniform sizes. The aphid-infested tobacco plants were covered by nylon mesh cages to prevent aphid escape. Those aphids were found to stay on the chosen leaf during the whole observation period. The uninfested control (CK) plants were also covered by nylon mesh cages. The infestation treatment was lasted for 0 h (CK), 2 h, 15 h, and 5 d for NMT measurement and 0 d (CK), 1 d, 2 d, and 3 d for enzymatic activity measurements. Six and three parallel samples under each treatment condition were used for NMT and enzymatic activity measurements, respectively.
The following further treatment is for NMT measurement samples. The main vein was abscised from leaves after aphid feeding. The selected leaf sample was about 4 cm2. The lower epidermis at the feeding site was removed and the mesophyll cells were exposed. Prior to measurement, the mesophyll segments were placed in a Petri dish containing 10 mL of measuring solution, which was composed of 0.1 mM CaCl2, 0.1 mM KCl, and 0.3 mM MES with pH of 6.0, for at least 20 min to minimize wounding effects. The leaf samples were then placed in another Petri dish containing the fresh measuring solution before measurement.
The following further treatment is for enzymatic activity measurement samples. The main vein of the fourth unfurling leaf, which was not infested by aphids, was abscised to avoid the contamination of POD and CAT secreted by aphid mouthparts. A leaf sample without main vein of 0.3 g was quick frozen by liquid nitrogen and stored in a refrigerator at –70°C to be determined.
Net Ca2+ flux measurements
Net Ca2+ fluxes were measured in the YoungerUSA (Xuyue Beijing) NMT Service Center by using the NMT-100 (YoungerUSA, LLC, Amherst, MA 01002, USA) with ASET 2.0 (Science Wares, Falmouth, MA 02540, USA) and iFluxes 1.0 (Younger, USA) software.
Ca2+-selective microelectrodes were cleaned as following procedure before each NMT test to ensure the resolution. Silanized glass microelectrodes (Φ5 ± 1 μm, XY-DJ-01, YoungerUSA) were first backfilled with 100 mM CaCl2 to approximately 1 cm in length and then front-filled with approximately 25 μm Ca2+ liquid ion exchange (Ca2+ LIX, XY-SJ-Ca, YoungerUSA). An Ag/AgCl wire electrode holder (XY-DJGD, YoungerUSA) was inserted into the back of electrode to contact with electrolyte solution. YG003-Y05 (YoungerUSA) was used as the reference electrode (Sun et al. Citation2010).
Prior to flux measurements, Ca2+ microelectrodes were calibrated by culture media with three Ca2+ concentrations of 0.05 mM, 0.1 mM, and 0.5 mM. The electrodes with a Nernstian slope >26 mV/decade were used in experiments. The same calibration procedure was carried out again for the microelectrode after each test. The microelectrode was vertically positioned about 400 μm above the cell for 5 min to record the background signal (blank), and then the microelectrode was moved and positioned about 2 μm from the cell membrane to record Ca2+ fluxes. Each sample was measured for 10 minutes.
Net hydrogen peroxide (H2O2) flux measurements
The hydrogen peroxide flux in mesophyll cells was measured by the same NMT system. The Pt/Ir polarographic hydrogen peroxide microelectrodes (tip diameter 2–4 μm, XY-DJ-502, YoungerUSA) were used for detecting dissolved hydrogen peroxide in +600 mV polarization voltage as described earlier (Twig et al. Citation2001). YG003-Y05 (YoungerUSA) was used as the reference electrode. The hydrogen peroxide solutions with concentrations of 0.1 mM, 1 mM, and 10 mM were used to calibrate microelectrodes and the calibration procedure was the same as that in Ca2+ flux measurement.
Flux data analysis
Net Ca2+ and hydrogen peroxide fluxes were calculated by Fick’s first law of diffusion:
Measurements of POD and CAT activities
POD and CAT activities were measured according to the previous method in literatures (Mao et al. Citation2011, Citation2012). The unit of POD and CAT activity was defined as a 0.01 increment of OD470 and OD240 of fresh weight per gram per minute, respectively.
Statistical analysis
Analysis of variance was carried out by using SPSS 11.5 (SPSS Inc., Chicago, IL, USA) for all sets of data, and significant differences between means were determined by Duncan’s test. Differences were considered as statistically significant at P < 0.05.
Results
Ca2+ flux changes
The Ca2+ flux of the tobacco samples with or without aphid infestation was measured for 340 s with an interval time of 20 s. shows the plot of the Ca2+ influx versus time for tobacco samples with different infestation treatment. The Ca2+ efflux for the CK sample was shown in as well. The Ca2+ influx of tobacco samples after aphid infestation was slightly changed with time, but it seems the basic tendency of Ca2+ influx not to be changed. At first nine measurement points, the Ca2+ influx for all three tobacco samples, which were infested by aphids for 2 h, 15 h, and 5 d, respectively, exhibited similar change tendency. However, the Ca2+ influx of the infested sample of 15 h was decreased with time since the 10th measurement point. The behavior of Ca2+ flux for CK sample was significantly different from the infested samples. For CK sample, the Ca2+ flux showed efflux and little change with time. The fact that there was not sudden alteration of flux between CK and infested samples even at the first point indicated the Ca2+ flux response would be happened at beginning of infestation.
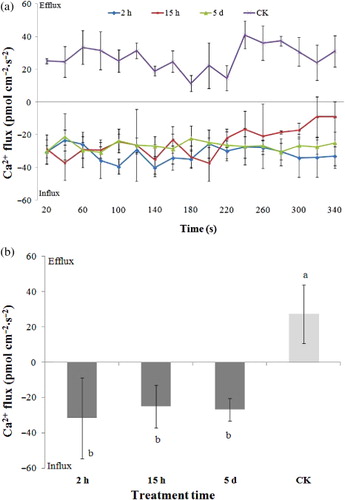
In order to better understand the effect of the infestation time on Ca2+ flux, the average Ca2+ flux of all samples in the period of measurement time was shown in . The average values of Ca2+ flux were 27.27, −31.52, −24.99, and −26.77 pmol·cm−2·s−1, for samples infested by aphids for 0 h, 2 h, 15 h, and 5 d, respectively. Slight difference was observed for the infested samples with different infestation time. The infested sample of 2 h exhibited the highest Ca2+ influx and the sample of 15 h had the lowest Ca2+ influx, but similar with the value for the sample of 5 d, suggesting the Ca2+ influx was close to reach a constant value for tobacco samples after infestation for 15 h. Significant Ca2+ efflux was also found in the control tobacco (F = 12.35, df = 3, P < 0.05).
H2O2 flux changes
At the same infestation conditions as Ca2+ flux measurement, H2O2 flux of all samples, including CK and the infested samples, was measured. It was found that H2O2 flux exhibited influx phenomenon for the CK sample, as shown in , which shows plots of H2O2 flux versus time for tobacco samples with different infestation treatment of 0 h, 2 h, 15 h, and 5d. However, after aphid infestation, H2O2 was considerably generated in tobacco mesophyll cells and exhibited continuous efflux, as shown in . The H2O2 efflux of the samples infested by aphids for 2 h and 5 d showed a flat tendency though there were wave changes among measurement points. For the sample infested for 15 h, the H2O2 efflux seems to be slightly increased with increasing measurement time, especially after the 10th point.
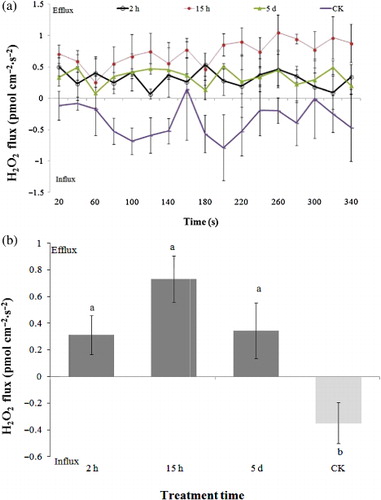
The average H2O2 flux of all samples in the period of measurement time was shown in . The average values of H2O2 flux were −0.35, 0.31, 0.73, and 0.35 pmol·cm−2·s−1, for samples infested by aphids for 0 h, 2 h, 15 h, and 5 d, respectively. It was seen that the H2O2 efflux of the sample after aphid infestation for 15 h was the strongest.
POD and CAT activities
POD antioxidant enzyme activities for all aphid-infested tobacco samples were significantly higher than that of the CK samples (F = 46.57, df = 5, P < 0.05), as shown in . The three infested samples exhibited similar POD antioxidant enzyme activity of around 700 μ·g−1·min−1 but the sample infested for 3 d had a slight higher POD antioxidant enzyme activity. It indicated that the extent of infestation by aphids for tobaccos did not influence the POD antioxidant enzyme activity. The POD antioxidant enzyme activity of CK samples was unexpectedly changed with time. The CK sample measured on the first day showed the highest POD antioxidant enzyme activity. Then, the POD antioxidant enzyme activities were decreased for the CK samples of 2 d and 3 d.
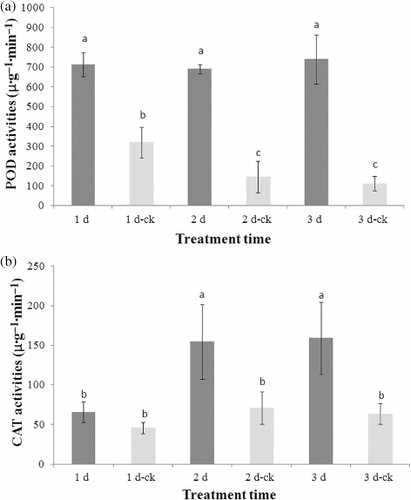
The CAT antioxidant enzyme activities for the CK samples measured on the second and third day were slightly higher than that measured on the first day, as shown in . The CAT antioxidant enzyme activity of the infested sample for 1 d was not removed much by comparison with the CK samples. However, the CAT antioxidant enzyme activities for the tobacco samples, which were infested by aphids for two and three days were significantly increased (F = 8.79, df = 5, P < 0.05), close to 2.5 times to the sample infested for one day. It indicated that the infestation of tobacco aphids resulted in a change in defense response.
Discussion
The role of ion flux in triggering and regulating defense responses has been widely discussed in most of previous studies (Lecourieux et al. Citation2006; Nemchinov et al. Citation2008; Hu et al. Citation2009; Wu & Baldwin Citation2009; Shabala et al. Citation2011). Ca2+ ion, as an important second messenger, is able to transport and amplify signals originating from cellular receptors and then stimulate the defense response in host plants (Garcia-Brugger et al. Citation2006). The cytosolic Ca2+ concentration could be of a rapid elevation for the plant defense responses in transduction pathways induced by the insect-specific elicitors. The data of Ca2+ flux, which was immediately changed from efflux for CK to influx for the infested tobacco samples, in this work are consistent with those previous reports (Maffei et al. Citation2006; Howe & Jander Citation2008). Nemchinov et al. (Citation2008) found that Ca2+ influx occurred only at the first stage of pathogen–host interaction of 0–7 h after infestation. The initial calcium uptake was subsequently followed by the net calcium efflux initiated between 10 and 12 h and continued up to 48 h after infestation. However, in this work, the net calcium influx was neither significantly increased with infestation time, nor changed to the net calcium efflux. Will et al. (Citation2007) studied molecular sabotage of plant defense by aphid saliva and addressed that sheath saliva prevents the calcium influx and that the watery aphid saliva appears to act as a calcium scaverger. The availability of calcium may also be reduced in the lumen of sieve elements (SEs) because of sealing of the puncture site in the SE cell wall. Thermodynamically, the passive Ca2+ efflux from the cell cytosol is impossible. Thus, Nemchinov et al. (Citation2008) believed that PM Ca2+-ATPase was formed and pumped Ca2+ out because of an expanded cell death. In the insect–host interaction in this work, the tobacco mesophyll cells could be active as long as 5 d and the Ca2+ influx would not be significantly changed. This phenomenon was different from the pathogen–host interaction, in which pathogen would cause cell death in short infestation time. The Ca2+ flux was mostly dependent on the ion pathways on cytoplasmic membrane, rather than ion pump. Aphids can puncture all types of cells and readily seal almost every cell along the stylet pathway (Tjallingii & Esch Citation1993). In the stylet puncture, the components of the sheath and watery saliva of aphids play a pivotal role in establishing the physical and chemical constraints on the rise of calcium (Will & van Bel Citation2006). The phenomenon observed in this work should be further studied in the future.
ROS are generated during plant metabolism and play an important role in signal transduction and regulation (Shabala & Bose Citation2012). H2O2 is one of the most important ROS species involving in the signaling pathways to induce plant defense reactions against aphids (Martinez et al. Citation2003). H2O2 can be transported in long distances across cell membranes from its generation site. The previous study showed that Orgyia ericae-induced H2O2 accumulation in Ammopiptanthus mongolicus cells depended on Ca2+ influx, which representing an upstream signal affecting H2O2 accumulation (Gao et al. Citation2012). The phenomenon of H2O2 flux in this work is in agreement with the result in this reference. Ca2+ flux exhibited a strong influx at all infestation periods by aphids, while H2O2 showed an efflux behavior. The slight variation tendency of Ca2+ influx and H2O2 efflux was consistent.
The POD antioxidant activity of CK samples was observed to be changed. It might be related to the growth stage and the physiological status of tobacco. The similar phenomenon for host plants was also observed in literatures (Mao et al. Citation2011, Citation2012). After infestation, the POD antioxidant enzyme activity was significantly increased. POD and CAT antioxidant enzymatic systems in plants are believed to be disturbed, to some extents, by insect piercing-sucking (Han et al. Citation2009). After disturbance, the balance of the host plant metabolism could be resumed by POD antioxidant enzyme working with superoxide dismutase and CAT antioxidant enzyme through scavenging surplus free radicals. The role of CAT antioxidant enzyme is to scavenge the H2O2 produced in photorespiration and mitochondrial electron transport. The total nonspecific POD and CAT antioxidant enzyme activities were increased at all infestation time as a result of aphid feeding, suggesting the metabolism balance was broken by aphid feeding and a new balance was built.
Will and van Bel (Citation2006, Citation2008) and Will et al. (Citation2013) proposed that the Ca2+ influx could be a consequence of the mechanical damage and stretch-activated calcium-channels instead of the aphid saliva, in which contains calcium-binding proteins. Aphids can ingest phloem sap continuously for many hours or even days from a single SE, indicating that the gelling saliva protect the stylets from the plant response defense after the Ca2+ signal and H2O2 responses. Based on the results in this work that Ca2+ signal and H2O2 responses were not decreased but rather were slight increased after the stylet penetration, the defense response seems not to be ceased even under the prevention of sheath saliva sealing effect from the influx of Ca2+ (Will et al. Citation2007). The chemical compounds in aphid saliva would induce signaling pathways of salicylic acid and jasmonic acid (Will et al. Citation2013). During those reactions, the relative enzyme activities would be enhanced and respond to the insect attacks. In a long period of aphid feeding, the Ca2+ influx and H2O2 efflux were increased. POD and CAT antioxidant enzyme activities were significantly enhanced.
Acknowledgments
Thanks are given to Dr W.J. Wang for his technical assistance in the NMT testing.
Funding
This work was financially supported by the Ministry of Agriculture of China [grant number 201203091].
Additional information
Funding
Related Research Data
References
- Blackman RL, Eastop VF. 2000. Aphids on the world’s crops: an identification and information guide. Chichester: John Wiley & Sons Inc.
- Gao HB, Zhang SJ, Shen YB. 2012. Regurgitant from Orgyia ericae Germar induces calcium influx and accumulation of hydrogen peroxide in Ammopiptanthus mongolicus (Maximex Kom) Cheng f. cells. Acta Ecologica Sinica. 32:6520–6526.
- Garcia-Brugger A, Lamotte O, Vandelle E, Bourque S, Lecourieux D, Poinssot B, Wendehenne D, Pugin A. 2006. Early signaling events induced by elicitors of plant defenses. Mol Plant Microbe Interact. 19:711–724.
- Han Y, Wang Y, Bi JL, Yang XQ, Huang Y, Zhao X, Hu Y, Cai QN. 2009. Constitutive and induced activities of defense-related enzymes in aphid-resistant and aphid-susceptible cultivars of wheat. J Chem Ecol. 35:176–182.
- Howe GA, Jander G. 2008. Plant immunity to insect herbivores. Annu Rev Plant Biol. 59:41–66. 10.1146/annurev.arplant.59.032607.092825
- Hu X, Neill SJ, Yang Y, Cai W. 2009. Fungal elicitor Pep-25 increases cytosolic calcium ions, H2O2 production and activates the octadecanoid pathway in Arabidopsis thaliana. Planta. 229:1201–1208.
- Kusnierczyk A, Winge P, Jørstad TS, Troczynska J, Rossiter JT, Bones AM. 2008. Towards global understanding of plant defense against aphids – timing and dynamics of early Arabidopsis defense responses to cabbage aphid (Brevicoryne brassicae) attack. Plant Cell Environ. 31:1097–1115.
- Kusnierczyk A, Winge P, Midelfart H, Armbruster WS, Rossiter JT, Bones AM. 2007. Transcriptional responses of Arabidopsis thaliana ecotypes with different glucosinolate profiles after attack by polyphagous Myzus persicae and oligophagous Brevicoryne brassicae. J Exp Bot. 10:2537–2552.
- Lecourieux D, Ranjeva R, Pugin A. 2006. Calcium in plant defence-signalling pathways. New Phytol. 171:249–269.
- Maffei M, Bossi S, Spiteller D, Mithofer A, Boland W. 2004. Effects of feeding Spodoptera littoralis on lima bean leaves. I. Membrane potentials, intracellular calcium variations, oral secretions, and regurgitate components. Plant Physiol. 134:1752–1762.
- Maffei ME, Mithofer A, Arimura G, Uchtenhagen H, Bossi S, Bertea CM, Cucuzza LS, Novero M, Volpe V, Quadro S, Boland W. 2006. Effects of feeding Spodoptera littoralis on lima bean leaves. III. Membrane depolarization and involvement of hydrogen peroxide. Plant Physiol. 140:1022–1035.
- Mao H, Chen H, Liu XX, Zhang QW. 2011. Effects of Apolygus lucorum feeding and mechanical damage on defense enzyme activities in cotton leaves. Chin J Appl Entomol. 48:1431–1436.
- Mao H, Yang YH, Guo CX, Zhang QW, Liu XX. 2012. Changes in defensive enzyme expression in cotton leaves activity and defensive enzyme gene after feeding by Apolygus lucorum. Chin J Appl Entomol. 49:652–659.
- Martinez DIO, Xie Q, Kaloshian I. 2003. Aphid-induced defense responses in Mi-1-mediated compatible and incompatible tomato interactions. Mol Plant-Microbe Interact. 16:699–708.
- Nemchinov LG, Shabala L, Shabala S. 2008. Calcium efflux as a component of the hypersensitive response of Nicotiana benthamiana to Pseudomonas syringae. Plant Cell Physiol. 49:40–46.
- Ng JCK, Perry KL. 2004. Transmission of plant viruses by aphid vectors. Mol Plant Pathol. 5:505–511. 10.1111/j.1364-3703.2004.00240.x
- Roy P, Dhandapani R. 2011. Plant defence proteins during aphid infestation. Int J Appl Bio Pharm Tech. 2:52–57.
- Shabala S, Baekgaard L, Shabala L, Fuglsang A, Babourina O, Palmgren MG, Cuin TA, Rengel Z, Nemchinov LG. 2011. Plasma membrane Ca2+ transporters mediate virus-induced acquired resistance to oxidative stress. Plant Cell Environ. 34:406–417.
- Shabala S, Bose J. 2012. Application of non-invasive microelectrode flux measurements in plant stress physiology. In: Volkov AG, editor. Plant electrophysiology. New York: Springer Berlin Heidelberg; p. 91–126.
- Smith CM, Clement SL. 2012. Molecular bases of plant resistance to arthropods. Annu Rev Entomol. 57:309–328.
- Sun J, Wang MJ, Ding MQ, Deng SR, Liu MQ, Lu CF, Zhou XY, Shen X, Zheng XJ, Zhang ZK, et al. 2010. H2O2 and cytosolic Ca2+ signals triggered by the PM H-coupled transport system mediate K+/Na+ homeostasis in NaCl-stressed Populus euphratica cells. Plant Cell Environ. 33:943–958. 10.1111/j.1365-3040.2010.02118.x
- Tjallingii WF, Esch TH. 1993. Fine structure of aphid stylet routes in correlation with EPG signals. Physiol Entomol. 18:317–328. 10.1111/j.1365-3032.1993.tb00604.x
- Twig G, Jung SK, Messerli MA, Smith PJ, Shirihai OS. 2001. Real-time detection of reactive oxygen intermediates from single microglial cells. Biol Bull. 201:261–262.
- Will T, Furch AC, Zimmermann MR. 2013. How phloem-feeding insects face the challenge of phloem-located defenses. Front Plant Sci. 4:336.
- Will T, Tjallingii WF, Thonnessen A, van Bel AJE. 2007. Molecular sabotage of plant defense by aphid saliva. Proc Natl Acad Sci USA. 104:10536–10541. 10.1073/pnas.0703535104
- Will T, van Bel AJ. 2006. Physical and chemical interactions between aphids and plants. J Exp Bot. 57:729–737.
- Will T, van Bel AJ. 2008. Induction as well as suppression: how aphid saliva may exert opposite effects on plant defense. Plant Signal Behav. 3:427–430. 10.4161/psb.3.6.5473
- Wu J, Baldwin IT. 2009. Herbivory-induced signalling in plants: perception and action. Plant Cell Environ. 32:1161–1174. 10.1111/j.1365-3040.2009.01943.x
- Wu J, Baldwin IT. 2010. New insights into plant responses to the attack from insect herbivores. Annu Rev Genet. 44:1–24.
- Yin LP, Shang GY, Xu Y. 2006. Application of scanning ion-selective electrode technique in research of higher plant. Prog Nat Sci. 16:262–266.
- Zhang HJ, Yan Y, Peng L, Guo YJ, Wan FH. 2012. Plant defense responses induced by phloem-feeding insects. Acta Entomologica Sinica. 55:736–748.