
Abstract
African violet (Saintpaulia ionantha H. Wendl) is one of the most easily and commonly tissue-cultured ornamental plants. Despite this, there are limited reports on photosynthetic capacity and its impact on the plant quality during acclimatization. Various growth, photosynthetic and biochemical parameters and activities of antioxidant enzymes and dehydrins of micropropagated plants were assessed under three light intensities (35, 70, and 100 µmol m−2 s−1 photosynthetic photon flux density – PPFD). Fresh and dry plant biomass, plant height, and leaf area were optimal with high irradiance (70–100 µmol m−2 s−1 PPFD). Chlorophyll and carotenoid contents and net photosynthesis were optimal in plants grown under 70 µmol m−2 s−1 PPFD. Stomatal resistance, malondialdehyde content, and Fv/Fm values were highest at low light irradiance (35 µmol m−2 s−1 PPFD). The activities of three antioxidant enzymes, superoxide dismutase, catalase, and glutathione peroxidase, increased as light irradiance increased, signaling that high light irradiance was an abiotic stress. The accumulation of 55, 33, and 25 kDa dehydrins was observed with all light treatments although the expression levels were highest at 35 µmol m−2 s−1 PPFD. Irradiance at 70 µmol m−2 s−1 PPFD was suitable for the acclimatization of African violet plants. Both low and high irradiance levels (35 and 100 µmol m−2 s−1 PPFD) induced the accumulation of antioxidants and dehydrins in plants which reveals enhanced stress levels and measures to counter it.
| Abbreviations | ||
| CAT | = | catalase |
| GPx | = | glutathione peroxidase |
| GSH | = | glutathione |
| F0 | = | minimal fluorescence yield of the dark-adapted state |
| F m | = | maximal fluorescence yield of the dark-adapted state |
| Fv | = | variable fluorescence |
| Fv/Fm | = | maximal quantum yield of PSII photochemistry |
| PPFD | = | photosynthetic photon flux density |
| MDA | = | malondialdehyde |
| ROS | = | reactive oxygen species |
| SOD | = | superoxide dismutase |
Introduction
African violet (Saintpaulia ionantha H. Wendl), a member of the Gesneriaceae family, is a popular commercial ornamental plant and holds good export potential as a pot flower in many countries. Micropropagated plants are associated with several physiological and anatomical abnormalities during in vitro growth such as low photosynthetic capacity, nonproper functioning of stomata, and malfunctioning of housekeeping systems mainly due high humidity inside the culture vessel (Hazarika Citation2003). After ex vitro transfer, these plantlets might easily be impaired by sudden changes in environmental conditions, and so a period of acclimatization to correct abnormalities is needed (Pospíšilová et al. Citation1999). As a consequence, plants raised in vitro are grown in environmentally controlled growth chambers or greenhouses and factors such as light, temperature, and humidity are gradually enhanced for their step-by-step acclimatization (Pospíšilová et al. Citation1999; Hazarika Citation2003; Dewir et al. Citation2005). In order to increase growth and to reduce the mortality of plantlets at the acclimatization stage, research has focused on the control of environmental factors which optimizes the survival of plantlets (Hazarika Citation2003; Dewir et al. Citation2004, Citation2005).
Light intensity is one important factor that can be controlled at the acclimatization stage because it can lead to the depression of photosynthetic efficiency (photoinhibition) mainly due to oxidative damage to photosystem II, as occurs in the natural environment (Powles Citation1984). At high light intensity, an increase in photosynthetic carbon fixation can occur, which varies depending on light intensity and may lead to different susceptibilities to photoinhibition (Powles Citation1984). However, above a certain threshold, carbon fixation becomes saturated and photosynthesis is incapable of using all the energy absorbed by the plants. Under conditions of excess light absorption, the chloroplast lumen becomes acidic in nature, which reduces the electron transport chain, and excitation energy accumulates within the chloroplast which can lead to the generation of reactive oxygen species (ROS) such as superoxide and hydrogen peroxide (Asada Citation1999). The accumulation of ROS may lead to lipid peroxidation and to reduced accumulation of enzymatic antioxidants which exist as a defense system in plants (Asada Citation1999). It is also believed that dehydrins (DHNs) can accumulate in acclimatizing plants because, as observed in light-induced expression of DHNs during seedling de-etiolation in sunflower (Natali et al. Citation2007). Some DHNs have been implicated as antioxidants that scavenge free radicals (Hara et al. Citation2003) and may act as protectants of osmoregulation.
In a bid to better understand the photosynthetic response and its impact on plant quality of acclimatized African violet plants derived from micropropagation, this study examined multiple photosynthetic parameters. In addition, lipid peroxidation, the activity of stress-related enzymes, and DHN proteins of acclimatized plants was assessed in response to three light intensities in order to clarify their role in overcoming light-induced stress during the process of acclimatization.
Materials and methods
Chemicals and reagents
All chemicals were of tissue culture grade, except for those used in enzyme-related analyses, which were of HPLC grade. All reagents and chemicals were obtained from Sigma-Aldrich (Poole, UK), unless otherwise stated.
Plant material
In vitro shoots of African violet (Saintpaulia ionantha H. Wendl cv. ‘Diana blue’) were regenerated from leaf segments after 3 weeks of culture on Murashige and Skoog (MS) medium (Murashige & Skoog Citation1962) containing 0.2 mg L−1 6-benzyladenine and 0.1 mg L−1 Kinetin. The regenerated shoot clumps were cultured for 4 weeks onto MS medium without plant growth regulators for their elongation and rooting. These plantlets were gently removed from the medium and the roots were washed under tap water and used as experimental plant material in this study.
Light intensity treatments during acclimatization
Micropropagated plantlets of African violet were transplanted into culture pots (plastic coffee cups with three holes at the bottom) filled with sterilized compost (John Innes, No. 1, Westland Ltd., Berkshire, UK) and grown in a Sanyo growth cabinet for 4 weeks under three levels of PPFD (35, 70, and 100 µmol m−2 s−1) under a 16-h photoperiod using halide lamps (Sanyo). The environment in the growth cabinet was adjusted to 25 ± 2°C air temperature and 50% relative humidity (RH). Growth parameters (fresh weight, dry weight, number of leaves/plantlet, shoot and root length, and leaf area) were determined after 4 weeks in the growth chamber. Plants were irrigated twice a week and a compound fertilizer (19: 19: 19; N: P2O5: K2O) at 1 g L−1 was applied once after 3 weeks.
Photosynthetic parameters
Determination of chlorophyll and carotenoid contents
The contents of chlorophyll (Chl) a, Chl b and total carotenoids in the fully expanded young leaves of 4-week-old plants were determined by a UV-Jenway 7315 spectrophotometer (Staffordshire, UK). Chlorophyll was extracted from leaf tissue by grinding in a mortar with liquid nitrogen to a fine powder and adding 100 mg to a 2-mL Eppendorf tube. One mL of 80% acetone was added and the powder was homogenized by inverting for 10 min in ice using a shaker and the absorbance was measured at 470, 649, and 665 nm. Chlorophyll and carotenoid concentrations were calculated from spectrophotometric data using the formulae of Lichtenthaler and Wellburn (Citation1983).
Fluorescence of organs and photosystem II
Chlorophyll fluorescence parameters were measured on the abaxial surface of the intact leaves. Plants were kept for 30 min in the dark prior to measurement. Modulated fluorescence was measured using a portable chlorophyll fluorimeter (PEA, Hansatech Instrument Ltd., version 1.21, Norfolk, UK). Minimal fluorescence (F 0) was measured for 30 min in dark-adapted leaves using light of <0.1 μmol m−2 s−1 and maximal fluorescence (F m) was measured after a 1 s saturating pulse (>3500 μmol m−2 s−1) in the same leaves. Maximal variable fluorescence (F v = F m – F 0) and the photochemical efficiency of PSII (F v/F m) were calculated for dark-adapted leaves (Dewir et al. Citation2005). Four plants were randomly selected and measurements were made on fully expanded young leaves using a standard leaf chamber. There were four single-leaf replications within each treatment.
Stomatal resistance
Stomatal resistance of plant leaves (resistance to loss of water vapor through the stomata; Scm−1) was estimated by an AP4 Porometer (Delta-T Devices Ltd., Cambridge, UK; Monteith et al. Citation1988). Four plants were randomly selected and measurements were made using fully expanded young leaves in a standard leaf chamber. There were four single-leaf replications within each treatment.
Photosynthetic rate and transpiration rate
Photosynthetic rate and transpiration rate were measured with a portable LCi photosynthesis system (ADC BioScientific Ltd., Herts, UK). Photosynthetic measurements were carried out under the following conditions: CO2 concentration of the in-flow air was 350 µmol mol−1 and RH was 60%. Leaf temperature was 25°C. Four plants (4 weeks old) were randomly selected and measurements were made on fully expanded young leaves using a standard leaf chamber. There were four single-leaf replications within each treatment.
Biochemical parameters
Antioxidant enzyme assay
To determine the activities of antioxidant enzymes, 0.5 g of fully expanded young leaves was homogenized under liquid nitrogen with 1.5 mL of respective extraction buffer using pre-chilled mortar and pestle. The homogenate was filtered through four layers of cheesecloth and centrifuged at 22,000 × g for 20 min at 4°C. The supernatant, which was re-centrifuged at 22,000 × g for 20 min at 4°C, was used for the assays indicated next.
Superoxide dismutase (SOD; EC 1.15.1.1) activity was determined according to Giannopolitis and Ries (Citation1977) and data are expressed as units ml−1. Catalase (CAT; EC 1.11.1.6) activity was determined according to Clairbone (Citation1985). CAT activity was calculated from a standard curve prepared using purified catalase (0–2000 U mL−1). Glutathione peroxidase (GPx; EC 1.11.1.9) activity was determined according to Tappel (Citation1978). GPx activity was calculated in pmol mL−1 min−1.
Determination of total glutathione
Total glutathione was determined in fully expanded young leaves using a method based on that of Owens and Belcher (Citation1965). Leaf tissues weighed, chopped into small pieces (1–2 mm) and homogenized using a Potter homogenizer at a ratio of 1 g of tissue to 4 ml of homogenization buffer (250 mM Tris-HCl, pH 7.4, containing 1 mM EDTA). The homogenate was centrifuged in 1.5-ml Eppendorf tubes at 13,000 × g for 10 min at 4°C, after which the supernatant was mixed at a 1:1 ratio with DTNB solution (100 mM potassium phosphate, pH 7.4, containing 10 mM DTNB and 5 mM EDTA) and placed on ice until use. The assay mix was prepared by mixing 0.6 U of GR with the assay buffer. Samples (40 µL) were transferred to a 96-well plate, then 210 µL of assay mix was added. After equilibration for 1 min, the reaction was started by adding 60 µL of 1 mM NADPH (Melford, Ipswich, UK) dissolved in assay buffer and the absorbance was recorded at 412 nm over 5 min using a VersaMaxTM plate reader. In each run there was a blank (buffer) and a standard (20 µM reduced glutathione) to calibrate the results. Samples were measured in triplicate and total glutathione was calculated according to Owens and Belcher (Citation1965) as:where DF = dilution factor and ΔA = the rate of change of absorbance.
Determination of lipid peroxidation
The thiobarbituric acid reactive substance (TBARS) assay was used to assess the level of lipid peroxidation in the fully expanded young leaves as a consequence of oxidative stress (Hodges et al. Citation1999). Leaf tissues were chopped into small pieces (about 1–2 mm2), and homogenized at a ratio of 1 g of tissue to 4 ml of RIPA buffer (50 mM Tris-HCl, pH 6.5, containing 150 mM NaCl, 0.1% SDS and 1% Triton X-100). The homogenates in 1.5-mL Eppendorf tubes were then centrifuged at 13,000 × g for 10 min at 4°C. An equal volume of ice-cold 10% trichloroacetic acid (TCA) was added to the supernatant and the mixture was centrifuged at 13,000 × g for 5 min at 4°C. The supernatant was then mixed at a 1:1 ratio with of 0.67% (w/v) thiobarbituric acid in 1.5-mL Eppendorf tubes. The mixture was incubated at 80°C for 30 min, and after cooling, 290 µL was transferred to a 96-well plate. The absorbance was then measured at 532 nm using a VersaMaxTM plate reader. The concentration of malondialdehyde (MDA) was determined by reference to a standard curve produced using 0–50 µM 1, 1, 3, 3-tetramethoxypropane. Measurements were carried out in triplicate and MDA content was expressed as μmol g−1 fresh weight.
Western blotting for detection of DHNs
A modified protocol from the protocol described by Rihan et al. (Citation2014) was used to detect DHNs. Total proteins from the fully expanded young leaves were extracted as described by Ni et al. (Citation1996). Samples from –80°C were thawed on ice, placed in a mortar, and 2 mL of extraction buffer (100 mM potassium phosphate, 1 mM dithiothreitol, 1 mM EDTA, 1% Triton X-100, 10% glycerol, pH 7.8) was added to 1 g of tissues and ground with a pestle. One mL of the liquid slurry was transferred to a microfuge tube (1.5 mL) on ice. The supernatant was centrifuged twice at 13,000 × g for 15 and 10 min, respectively at 4°C. Total protein content was evaluated using the Pierce BCA assay kit following the manufacturer’s instructions. The clear supernatant containing proteins was separated using SDS-PAGE (sodium dodecyl sulfate polyacrylamide gel electrophoresis; Laemmli Citation1970) and visualized using Coomassie blue staining solution. Unstained gels were used for western blotting and the proteins were transferred to a PVDF membrane (pore size 0.2 µm) (Millipore, Cat. No ISE000010, UK) by electro-blotting at 100 V for 35 min. 1×Tris glycine transfer buffer was prepared by dissolving 3.05 g L−1 Tris-HCl and 14.4 g L−1 glycine in 20% (v/v) methanol (Towbin et al. Citation1979). After transferring the proteins onto the PVDF membrane, the membrane was blocked using PBST (phosphate buffer saline + 0.05 Tween 20%) + 5% Marvel (a low fat skimmed milk powder) (Iceland Ltd., UK) for 1 h at RT with mild shaking. After incubation, the membrane was incubated to hybridize with an antibody raised against the K-segment of DHNs (primary antibodies obtained from Dr Michael Wisniewski’s Laboratory, USDA-ARS, Appalachian Fruit Research Station, USA). Primary antibodies were diluted 1:1000 in a total volume of 20 mL PBST supplemented with 4% of Marvel semi-skimmed milk and the membrane was incubated at 4°C overnight with very gentle shaking. The membranes were then washed three times with PBST while agitating to wash off excess primary antibody, for 5 min each wash, and the membrane was then incubated with horseradish peroxidase-conjugated goat anti-rabbit IgG secondary antibody (PBS diluted 1:20,000) (Abcam) for 1 h at RT with mild shaking to detect primary antibodies attached to the DHN protein. The membranes were washed three times with PBS for 5 min each and then incubated with ECL detection reagent (Luminata crescendo western HRP substrate; Millipore, WBLUR0100, UK) in the dark for 5 min. The image from the membrane was captured using a UVP gel documentation system.
Experimental design and data analysis
All experiments were set up in a completely randomized design. Data on explants forming callus and explants forming shoots were expressed as percentages. All data were subjected to ANOVA and Duncan’s multiple range test (DMRT) using SAS software (version 6.12; SAS Institute Inc., Cary, NC, USA).
Results and discussion
Growth and photosynthetic characteristics
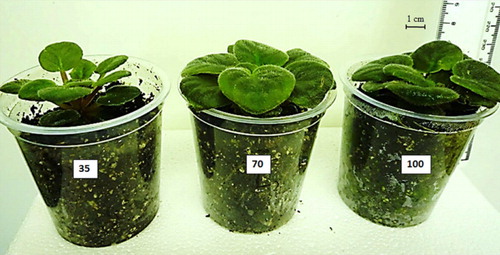
PPFD at 70–100 μmol m−2 s−1 favored the growth of African violet plantlets (). The shoot and root fresh weights and the shoot and root dry weights of plantlets acclimatized under 70–100 μmol m−2 s−1 were significantly greater than low PPFD (35 μmol m−2 s−1). Shoot length, number of leaves and leaf area of plantlets cultured under 70–100 μmol m−2 s−1 were also significantly higher than those of plantlets cultured at low PPFD. A high PPFD at 140 μmol m−2 s−1 had severely negative effect on plantlets, which turned yellow and eventually died (data not shown). The highest stomatal resistance was recorded at 35 μmol m−2 s−1. Chlorophyll and carotenoid contents, net photosynthetic rate and transpiration rate were higher at moderate PPFD than at low PPFD. Micropropagated plants are characterized by increased transpiration rate due to a lack of a thick cuticle (Pospíšilová et al. Citation1999). However, an incremental increase in Chl content has been reported in many plant species after ex vitro transplantation (Pospíšilová et al. Citation1988). The increase in photosynthetic activity recorded here showed that African violet plants are able to respond to increases in PPFD but this could represent a risk of ROS formation if the energy captured cannot be fixed chemically.
Table 1. Growth characteristics of micropropagated African violet as affected by light intensity 4 weeks after transplanting in a growth chamber.
The F v/F m value, a measure of the intrinsic or maximum efficiency of PSII i.e. the quantum efficiency if all PSII centers were open, decreased significantly in African violet plantlets acclimatized at 100 μmol m−2 s−1. The decrease in this parameter indicates the down regulation of photosynthesis or photoinhibition (Matysiak Citation2004; Dewir et al. Citation2005). Kozai and Sekimoto (Citation1988) reported that high PPFD was essential for improving the efficiency of photosynthesis. However, the response of plantlets to PPFD is species-dependent. Increasing PPFD to a high level (300 – 500 μmol m−2 s−1) could improve photosynthesis if other conditions necessary for a maximum photosynthetic rate were sustained (Lee et al. Citation1985), while a moderate PPFD level, 70 μmol m−2 s−1, was optimal for the acclimatization of Spathiphyllum plantlets (Dewir et al. Citation2005). The exposure of Calathea louisae and Spathiphyllum floribundum plantlets to high irradiance (300 μmol m−2 s−1) immediately after transplantation caused photoinhibition and even Chl photobleaching (Van Huylenbroeck et al. Citation1995). Thus, 70 μmol m−2 s−1 may be more optimal for acclimatization of African violet plantlets than higher levels of PPFD. At this light intensity level, the plants had short petioles, wide and large leaves, compact texture and overall better quality of pot plants than at other light intensities ().
Biochemical parameters
Lipid peroxidation and glutathione content
In the present study, MDA content in acclimatized African violet plantlets at 35 μmol m−2 s−1 was significantly higher than at 70 or 100 μmol m−2 s−1 (). The high content of MDA at low PPFD, which was nearly twice that the level at higher PPF, indicating the occurrence of oxidative stress. MDA, a decomposition product of polyunsaturated fatty acid hydroperoxides, is a suitable biomarker for lipid peroxidation which is an effect of oxidative damage (Dewir et al. Citation2006; Turan & Ekmekçi Citation2011). Low light intensity (100 μmol m−2 s−1) increased the MDA content in cucumber leaves (Zhang et al. Citation2011). Increased MDA content has also been associated with increased oxidative stress during acclimatization of Phalaenopsis under high irradiance (300 μmol m−2 s−1; Ali et al. Citation2005). GSH content was significantly increased at 100 μmol m−2 s−1 compared with 70 or 35 μmol m−2 s−1 (). GSH not only serves as a substrate in the ascorbate–glutathione cycle, but also act as an antioxidant to mitigate stresses (Alscher et al. Citation1997). The enhanced GSH level under high PPFD may be an adaptive response of African violet plants to stress. This is consistent with the increase in GPx activity, a GSH-related enzyme, at 100 μmol m−2 s−1 (). Photoinhibition in chestnut (Castanea sativa) under high irradiance (300 μmol m−2 s−1) was accompanied with an increase in the content of reduced glutathione (Carvalho & Amâncio Citation2002). These results indicate that African violet plantlets suffered stress under high (100 μmol m−2 s−1) or low (35 μmol m−2 s−1) PPFD during acclimatization. However, it should be noted that African violet plants require a light intensity of 100–150 μmol m−2 s−1 for their growth in natural environment (Thomas Citation2012).
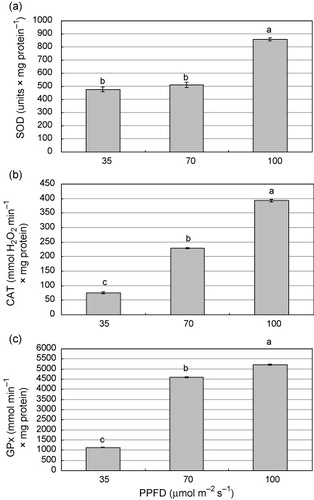
Note: Values are means ± standard error (n = 3). Different letters above bars indicate significant differences between means (Duncan’s multiple range test; P < 0.05).
Activity of antioxidant enzymes
The activity of SOD, CAT, and GPx increased significantly as PPFD increased, peaking at 100 μmol m−2 s−1. CAT and GPx showed the lowest activity at 35 μmol m−2 s−1 but SOD activity at 35 and 70 μmol m−2 s−1 did not differ significantly (). Light provides the energy needed for growth and photosynthesis but different light intensities can be a limiting factor for the acclimatization of tissue-cultured plants (Matysiak Citation2004; Ali et al. Citation2005; Dewir et al. Citation2005). Optimal light intensity for acclimatization is species-dependent and thus plant may undergo light stress during acclimatization. Plants activate a defense mechanism to effectively scavenge harmful ROS. ROS scavenging is essential for plants to cope with changes in the growing environments to maintain their photosynthetic function (Waraich et al. Citation2012). The induction of these enzymes is synchronized under some environmental stresses (Dewir et al. Citation2014). During acclimatization of Phalaenopsis plantlets to ex vitro conditions, SOD and CAT activities in leaves increased more under high (300 μmol m−2 s−1) than under intermediate (160 μmol m−2 s−1) or low (60 μmol m−2 s−1) irradiance (Ali et al. Citation2005). During ex vitro acclimatization of Spathiphyllum and Calathea plants, the changes in antioxidative enzyme activities after ex vitro transfer were dependent on irradiance (40–360 μmol m−2 s−1): SOD activity did not change at low irradiance (40 μmol m−2 s−1) but increased at high irradiance (360 μmol m−2 s−1); CAT activity increased more after transplantation to low than at high irradiance (Van Huylenbroeck et al. Citation2000). Several reports indicated that plants grown under low PPFD were less able to protect themselves from ROS due to a lower capacity to dissipate excess light energy and a lower capacity to scavenge ROS compared with plants grown at higher PPFD or full sun which involves gradual increases in activities of antioxidant enzymes (Mishra et al. Citation1995; Logan et al. Citation1998; Burritt & Mackenzie Citation2003; Ali et al. Citation2005). In the present study, the up/down regulation of antioxidant enzymes activities indicates that African violet plantlets underwent light stress at both low and high PPFD levels. However, under low light intensity, SOD rather than CAT or GPx played a major role in eliminating harmful ROS during the acclimatization of African violet plantlets.
DHNs
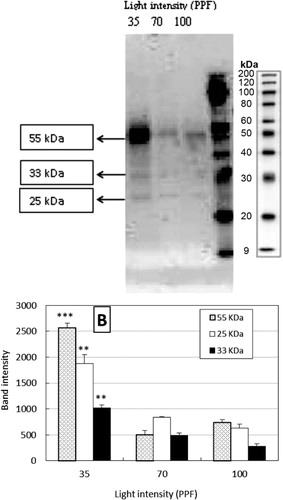
DHNs are late embryogenic abundant proteins which accumulate during seed development and are associated with acquisition of desiccation tolerance in developing seeds (Dure et al. Citation1981). In recent years, various studies have reported accumulation of DHNs in diverse species and tissues in response to abiotic stresses (Close Citation1997; Kosova et al. Citation2007). Accumulations of DHNs are meant for membrane stability and confer freezing, drought and salt stress tolerance in Arabidopsis and rice (Cheng et al. Citation2001; Puhakainen et al. Citation2004). In the present study, we evaluated the effects of light treatments on DHN accumulation during acclimatization of African violet though western blotting analysis. Analysis of the DHN protein fraction extracted from leaves of African violet revealed the presence of three major bands with molecular weight of approximately 55, 33, and 25 kDa (). All the these three bands expressed with all light treatments i.e. 30, 70, and 100 PPFD treatments, however the expression levels were higher with treatment 35 PPFD. Densitometric analysis showed that the relative intensity of 55 kDa band with 35 PPFD treatment. Our results show that accumulation of varied DHNs during light induced stress during ex vitro acclamatization of African violet plants and probably DHNs proteins also involved in safeguarding the membranes during light induced stress. We did not find reports on accumulation of DHNs in relation light induced stress, however, based on line of work of Hara et al. (Citation2003) who have demonstrated the role DHNs in transgenic tobacco in inhibition of lipid peroxidation and we are of opinion that DHNs might be playing a role in overcoming lipid peroxidation in African violet plants during ex vitro acclimatization. However, further investigations are necessary to clear the role of DHNs during ex vitro acclimatization of tissue cultured plants.
Note: Values are mean of band intensity (KDa) ± standard error. ** and *** = significant differences between means at P ≤ 0.01 and P ≤ 0.001, respectively. LSD 0.05 values 253.90, 159.95, and 331.39 for 55, 33, and 25 KDa, respectively.
In this study, the effect of different light irradiance (35, 70, and 100 µmol m−2 s−1 PPFD) on ex vitro acclimatization of micropropagated Saintpaulia plants was evaluated. The biomass of plants, plant height, leaf area, chlorophyll and carotenoid contents, and net photosynthesis were optimal in plants irradiated at 70 µmol m−2 s−1 PPFD. Both low and high irradiance levels (35 and 100 µmol m−2 s−1 PPFD) induced the accumulation of antioxidants and DHNs in plants which reveals enhanced stress levels. These results clearly depict that 70 µmol m−2 s−1 PPFD is suggested for the ex vitro acclimatization of micropropagated Saintpaulia plants. The plants acclimatized at this light intensity level had short petioles, compact texture and overall better quality of pot plants.
Acknowledgments
This project was supported by King Saud University, Deanship of Scientific Research, College of Food & Agriculture Sciences, Agriculture Research Center. We would like to thank Prof. Timothy J. Close (Riverside University) for providing K-segment consensus peptide. We are also grateful to Angela Harrop (Plymouth University) for technical help.
References
- Ali MB, Hahn EJ, Paek KY. 2005. Effects of light intensities on antioxidant enzymes and malondialdehyde content during short-term acclimatization on micropropagated Phalaenopsis plantlet. Environ Exp Bot. 54:109–120. 10.1016/j.envexpbot.2004.06.005
- Alscher RG, Donahue JL, Cramer CL. 1997. Reactive oxygen species and antioxidant: relationship in green cells. Physiol Plant. 100:224–233. 10.1111/j.1399-3054.1997.tb04778.x
- Asada K. 1999. The water-water cycle in chloroplasts: scavenging of active oxygen and dissipation of excess photons. Annu Rev Plant Physiol Plant Mol Biol. 50:601–639. 10.1146/annurev.arplant.50.1.601
- Burritt DJ, Mackenzie S. 2003. Antioxidant metabolism during acclimation of Begoniaxerythrophylla to high light levels. Ann Bot. 91:783–794. 10.1093/aob/mcg076
- Carvalho LC, Amâncio S. 2002. Antioxidant defence system in plantlets transferred from in vitro to ex vitro: effects of increasing light intensity and CO2 concentration. Plant Sci. 162:33–40. 10.1016/S0168-9452(01)00524-6
- Cheng ZQ, Targolli J, Su J, He CK, Li F, Wu R. 2001. Transgenic approaches for generating rice tolerant to dehydration stress. In: Khush GS, Brar DS, Hardy B, editors. Rice genetics IV. Manila: IRRI Science Publishers; p. 423–439.
- Clairbone A. 1985. Catalase activity. Handbook of methods for oxygen radical research. Boca Raton: CRC Press. p. 283–284.
- Close TJ. 1997. Dehydrins: a commonality in the response of plants to dehydration and low temperature. Physiol Plant. 100:291–296. 10.1111/j.1399-3054.1997.tb04785.x
- Dewir YH, Chakrabarty D, Ali MB, Hahn EJ, Paek KY. 2005. Effects of hydroponic solution EC, substrates, PPF and nutrient scheduling on growth and photosynthetic competence during acclimatization of micropropagated Spathiphyllum plantlets. Plant Growth Regul. 46:241–251. 10.1007/s10725-005-0161-1
- Dewir YH, Chakrabarty D, Ali MB, Hahn EJ, Paek KY. 2006. Lipid peroxidation and antioxidant enzyme activities of Euphorbia millii hyperhydric shoots. Environ Exp Bot. 58:93–99. 10.1016/j.envexpbot.2005.06.019
- Dewir YH, Hahn EJ, Paek KY. 2004. Factors affecting ex vitro rooting and growth of Spathiphyllum plantlets in the microponic culture system. Kor J Hortic Sci Technol. 22:42.
- Dewir YH, Indoliya Y, Chakrabarty D, Paek KY. 2014. Biochemical and physiological aspects of hyperhydricity in liquid culture system. In: Paek K-Y, Murthy HN, Zhong J-J, editors. Production of biomass and bioactive compounds using bioreactor technology. Berlin: Springer Science + Business Media; p. 693–703.
- Dure L III, Greenway SC, Galau GA. 1981. Development biochemistry of cotton seed embryogenesis and germination changing mRNA populations as shown by in vitro and in vivo protein synthesis. J Biochem. 20:4162–4168. 10.1021/bi00517a033
- Giannopolitis CN, Ries SK. 1977. Superoxide dismutases: I. Occurrence in higher plants. Plant Physiol. 54:309–314. 10.1104/pp.59.2.309
- Hara M, Terashima S, Fukaya T, Kuboi T. 2003. Enhancement of cold tolerance and inhibition of lipid peroxidation by citrus dehydrin transgenic tobacco. Planta. 217:290–298.
- Hazarika BN. 2003. Acclimatization of tissue-cultured plants. Curr Sci. 85:1704–1712.
- Hodges M., DeLong JM., Forney CF, Prange RK. 1999. Improving the thiobarbituric acid reactive-substances assay for estimating lipid peroxidation in plant tissues containing anthocyanin and other interfering compounds. Planta. 207:604–611. 10.1007/s004250050524
- Kosova K, Vitamvas P, Prasil IT. 2007. The role of dehydrins in plant response to cold. Biol Plant. 51:601–617. 10.1007/s10535-007-0133-6
- Kozai T, Sekimoto K. 1988. Effects of the number of air changes per hour of the closed vessel and the photosynthetic photon flux on the carbon dioxide concentration inside the vessel and the growth of strawberry plantlets in vitro. Environ Control Biol. 26:21–29.
- Laemmli UK. 1970. Cleavage of structural proteins during the assembly of the head of bacteriophage T4. Nature. 227:680–685. 10.1038/227680a0
- Lee N, Wetzstein HY, Sommer HE. 1985. Effects of quantum flux density on photosynthesis and chloroplast ultrastructure in tissue-cultured plantlets and seedlings of Liquidambar styraciflua L. towards improved acclimatization and field survival. Plant Physiol. 78:637–664. 10.1104/pp.78.3.637
- Lichtenthaler HK, Wellburn AR. 1983. Determination of total carotenoids and chlorophyll a and b of leaf extracts in different solvents. Biochem Soc Trans. 11:591–592.
- Logan BA, Demmig-Adams B, Adams WW, Grace SC. 1998. Antioxidants and xanthophyll cycle-dependent energy dissipation in Cucurbita pepo L. and Vinca major L. acclimated to four growth PPFDs in the field. J Exp Bot. 49:1869–1879. 10.1093/jxb/49.328.1869
- Matysiak B. 2004. Effect of light intensity on growth and chlorophyll fluorescence of Rhododendron microcuttings during acclimatization. Folia Hortic. 16:107–114.
- Mishra NP, Fatma T, Singhal GS. 1995. Development of antioxidative defense system of wheat seedlings in response to high light. Physiol Plant. 95:77–82. 10.1111/j.1399-3054.1995.tb00811.x
- Monteith JL, Campbell GS, Potter EA. 1988. Theory and performance of a dynamic diffusion porometer. Agric For Meteorol. 44:27–38. 10.1016/0168-1923(88)90031-7
- Murashige T, Skoog F. 1962. A revised medium for rapid growth and bioassay with tobacco tissue culture. Physiol Plant. 15:473–495
- Natali L, Giordani T, Lercari B, Maesrini P, Cozza R, Pangaro T, Vernieri P, Martinelli F, Cavallini A. 2007. Light induces expression of dehyrin-encoding gene during seedling de-etiolation in sunflower (Helianthus annus L.). J Plant Physiol. 164:263–273. 10.1016/j.jplph.2006.01.015
- Ni M, Dehesh K, Tepperman JM, Quail PH. 1996. GT-2: In vivo transcriptional activation activity and definition of novel twin DNA binding domains with reciproca1 target sequence selectivity. Plant Cell. 8:1041–1059.
- Owens CWI, Belcher RV. 1965. Colorimetric micro-method for the determination of glutathione. Biochem J. 94:705–711.
- Pospíšilová J, Solarova J, Catsky J, Ondrej M, Opatrny Z. 1988. The photosynthetic characteristics during micropropagation of tobacco and potato plants. Photosynthetica. 22:205–213.
- Pospíšilová J, Tichá I, Kadleček P, Haisel D, Plzáková Š. 1999. Acclimatization of micropropagated plants to ex vitro conditions. Biol Plantarum. 42:481–497.
- Powles SB. 1984. Photoinhibition of photosynthesis induced by visible light. Annu Rev Plant Physiol. 124:15–44. 10.1146/annurev.pp.35.060184.000311
- Puhakainen T, Hess MW, Makela P, Svensson J, Heino P, Palva ET. 2004. Overexpression of multiple dehydrin genes enhances tolerance to freezing stress in Arabidopsis. Plant Mol Biol. 54:743–753. 10.1023/B:PLAN.0000040903.66496.a4
- Rihan HZ, Al-Issawi M, Al Shamari M, Woldie W, Kiernan M, Fuller M. 2014. The effect of molybdenum on the molecular control of cold tolerance in cauliflower (Brassica oleracea var. botrytis) artificial seeds. Plant Cell Tiss Org Cult. 118:215–228.
- Tappel AL. 1978. Glutathione peroxidase and hydroperoxides. Methods Enzymol. 52:506–513. 10.1016/S0076-6879(78)52055-7
- Thomas PA. 2012. Growing African violets. Available from: http://extension.uga.edu/publications/detail.cfm?number=C660#Conditions
- Towbin H, Staehelint T, Gordon J. 1979. Electrophoretic transfer of proteins from polyacrylamide gels to nitrocellulose sheets: procedure and some applications. Proc Natl Acad Sci USA. 76:4350–4354. 10.1073/pnas.76.9.4350
- Turan Ö, Ekmekçi Y. 2011. Activities of photosystem II and antioxidant enzymes in chickpea (Cicer arietinum L.) cultivars exposed to chilling temperatures. Acta Physiol Plant. 33:67–78. 10.1007/s11738-010-0517-7
- Van Huylenbroeck JM, Huygens H, Debergh PC. 1995. Photoinhibition during acclimatization of micropropagated Spathiphyllum “Petite” plantlets. In Vitro Cell Dev Biol. 31:160–164. 10.1007/BF02632013
- Van Huylenbroeck JM, Piqueras A, Debergh PC. 2000. The evolution of photosynthetic capacity and the antioxidant enzymatic system during acclimatization of micropropagated Calathea plants. Plant Sci. 155:59–66. 10.1016/S0168-9452(00)00201-6
- Waraich EA, Ahmad R, Halim A, Aziz T. 2012. Alleviation of temperature stress by nutrient management in crop plants: a review. J Soil Sci Plant Nutr. 12:221–244. 10.4067/S0718-95162012000200003
- Zhang XL, Jia XF, Yu B, Gao Y, Bai JG. 2011. Exogenous hydrogen peroxide influences antioxidant enzyme activity and lipid peroxidation in cucumber leaves at low light. Sci Hortic-Amsterdam. 129:656–662. 10.1016/j.scienta.2011.05.009