
ABSTRACT
Early ripening is an important desirable attribute for fruit crops. ‘Tiangong Moyu’, a bud mutant of the grape cultivar ‘Summer Black’ (Vitis vinifera L.× Vitis labrusca L.), ripens nearly 10 days earlier and shows earlier increase in fresh weight, sugar accumulation, and color change and faster decrease in titratable acid than ‘Summer Black’. To identify the genes controlling early fruit development and ripening in ‘Tiangong Moyu’, RNA-Seq profiles of the two cultivars were compared at five different berry developmental stages. Based on GO annotation and KEGG pathway enrichment analysis, the differentially expressed genes were clustered into various functional groups, including plant hormone signal transduction, transcription factors, anthocyanin-associated biosynthesis pathway, phenylpropanoid biosynthesis, plant–pathogen associated and plant–pathogen interaction, and ripening-related protein genes. Our results provided a global transcriptional profile of candidate genes involved in regulating berry development and ripening and a genetic basis for the understanding of grape berry ripening.
1. Introduction
Grape (Vitis vinifera L.) is one of the most widely grown fruit plants in the world and has been cultivated for thousands of years for fresh fruit due to its color, taste, texture and benefits to human health (Wang et al. Citation2017; Yu et al. Citation2020) as well as for grape-derived products, including raisins, juices and wines (Ma and Yang Citation2019). Grapes are considered a non-climacteric fruit, and their berry development shows a double sigmoid growth curve with three distinct stages, involving two phases of rapid growth separated by a lag phase during which expansion slows and seeds mature (Coombe Citation1995).
Fruit ripening is a complex process, involving many highly coordinated physiological and biochemical changes, which in turn affect fruit appearance and palatability. Fruit ripening includes a series of changes in skin color, accumulation of soluble sugars, a decrease in acids, softening and an increase in aroma compounds (Payasi et al. Citation2009). A number of studies have focused on the transcriptional, metabolomic and proteomic changes during grape development and ripening, and revealed key regulators of grape maturation (Martínez-Esteso et al. Citation2011; Kuhn et al. Citation2013). Many factors, such as plant hormones, anthocyanins and flavonoids, have been widely observed to have roles in the berry ripening process. For example, abscisic acid (ABA) accumulation during grape ripening has been widely reported, as well as its correlation with ripening-associated changes, including sugar accumulation, color formation, and berry softening (Davies and Böttcher Citation2009; Kuhn et al. Citation2013). Another important plant hormone in ripening regulation is ethylene, although grape is well known as a non-climacteric fruit; hence, its ripening process is less regulated by ethylene than that of some fruits. Nevertheless, some recent reports observed an increase in ethylene biosynthesis-related genes during ripening (Chervin et al. Citation2008; Chervin and Deluc Citation2010). A blockage of ethylene delayed the berry ripening process, including berry diameter extension, anthocyanin accumulation and acidity decline (Chervin et al. Citation2004). Anthocyanins, which are synthesized via the flavonoid pathway, are the most investigated phenolic compounds in grape ripening. The accumulation of anthocyanins during ripening is important for the formation of red or black colors (He et al. Citation2010). MYB genes were the main regulators of anthocyanin biosynthesis (Allan et al. Citation2008). Several other regulators were also investigated due to their changes during grape ripening. Putative cell wall proteins, Grip 3, 4 and other Grips were found to be highly expressed in ripening grapes, and these proteins may have functions in regulating fruit softening or stress response (Davies and Robinson Citation2000). Some plant-pathogen-related genes were also observed to be significantly changed during ripening in grapes, suggesting a putative role for these genes in the regulation of ripening (Zhang et al. Citation2014). However, much should be done to better understand the underlying mechanism of fruit ripening in grapes.
‘Summer Black’ grape is a seedless, triploid grape cultivar with a dark, purple-black pericarp, and it is a European-American hybrid, derived from the seedless grape cultivars ‘Kyoho’ and ‘Thompson’. ‘Summer Black’ possesses many advantageous horticultural traits, including a strong resistance, high yield, very early maturation, good coloration, strong growth, and the ability to withstand storage and transportation. ‘Summer Black’ is suitable for planting throughout China. Recently, we identified an early-ripening bud mutant of ‘Summer Black’ and released it as an early table grape, named ‘Tiangong Moyu’. The bud mutant matures in late June in Zhejiang Province, China, and nearly 10 days earlier than ‘Summer Black’. All of its traits are similar to those of ‘Summer Black’, except for the ripening date. The phenotypic and physiological differences between the bud mutant and its parent have been investigated in detail. Since the fruits mature 10 days earlier, the ‘Tiangong Moyu’ cultivar might potentially be economically valuable. Given the importance of this mutation, we compared the RNA-Seq profiles of ‘Summer Black’ and ‘Tiangong Moyu’ at five different berry developmental stages and identified numbers of genes that likely play critical roles in accelerating the berry ripening process in ‘Tiangong Moyu’.
2. Materials and methods
2.1. Sample collection and berry development measurements
Two developmental series of ‘Summer Black’ (hereafter referred to as WT) and ‘Tiangong Moyu’ (hereafter referred to as MUT) table grapes were cultivated at the vineyard of the Zhejiang Academy of Agricultural Science (120°24′E, 30°26′N), South China, at an altitude of 3.6 m above sea level. The soil of the study area is a marine-fluvigenic yellow loamy paddy soil with a pH of 6.7. The study area has a typical subtropical climate characterized by summer (27–35°C) followed by winter (2–6°C). The average annual temperature is 17.8°C with a 1400 mm average annual rainfall.
All samples were performed with three biological replicates. For each replicate, 10 clusters were randomly picked at each sampling time from at least 5 plants with no evidence of disease or stress symptoms. Three to four berries were harvested by cutting through the pedicel at the junction between the stem and berry from each cluster. All samples were transported to the laboratory within 2 h after harvest. Berries with similar maturity and no mechanical damage were frozen in liquid nitrogen, and subsequently stored at −80°C for future use. Developmental stages were characterized by changes in berry weight accumulation, total soluble solids (TSS) and titratable acid concentration as well as observed changes in berry color and deformability.
2.2. RNA extraction and RNA-Seq
The TRIzol reagent method was used to extract the total RNA from frozen whole grape berry powder (Invitrogen, Carlsbad, CA, USA). After the removal of genomic DNA with a TURBO DNA-free kit (Sigma-Aldrich, St. Louis, MO, USA), the total RNA was quantified using a Nanophotometer Pearl (Implen, Germany), and used for RNA-seq and real-time PCR. All samples were performed with three biological replicates.
For RNA-Seq, cDNA libraries were constructed with an Ultra™ RNA Library Prep Kit for Illumina (MA, USA), and the raw read sequences were obtained by Nanjing Vazyme Biotechnology Co. (Nanjing, China) using Illumina HiSeqTM 2000 with 6 Gb reads per sample. The raw reads were initially processed to obtain clean reads by removing the adapter and low-quality sequences using HISAT (Haider et al. Citation2017). After quality trimming, the clean reads were aligned to the reference 12X Vitis vinifera genome (http://www.genoscope.cns.fr/externe/Download/Projets/Projet_ML/data/) (Jaillon et al. Citation2007; Canaguier et al. Citation2017) using TopHat 2.0.13 software (http://tophat.cbcb.umd.edu/) (Trapnell et al. Citation2009). Gene expression values were calculated and correlation analysis was performed with the read/fragments per kilobase of exon per million fragments mapped reads (RPKM/FPKM) values using the Cuffdiff 2.2.1 program (http://cufflinks.cbcb.umd.edu/). Then, DEGseq2 was used to obtain differentially expressed genes (DEGs) between Log2 and the stationary phase. A false discovery rate (FDR) <0.05 and estimated absolute log 2-fold change (FC) >1 were used as the thresholds for judging significant differences in transcript expression. Gene Ontology (GO, http://www.geneontology.org) terms of transcripts were identified and annotated by the program Blast2go (http://www.blast2go.com). To classify genes or their products into terms (in the categories molecular function, biological process and cellular component), GO enrichment analysis using GO-seq was used to determine the biological functions of the DEGs. For KEGG annotations, all the DEGs were mapped to the KEGG database (https://www.genome.jp/kegg/pathway.html) and searched for enriched pathways compared to the background genome.
2.3. RT-qPCR validation of RNA-Seq data
For RT-qPCR analyses, gene-specific oligonucleotide primers were designed and are described in Table S1. The ubiquitin1 gene was employed as the internal control for calculating the relative expression of the mRNA. Real-time PCR was performed using FastStart Universal SYBR Green (Roche, Basel, Switzerland), initiated by 10 min at 95°C and followed by 40 cycles of 95°C for 30 s, 60°C for 30 s, with a final extension at 72°C for 10 min, followed by a melting curve program. The PCR mixture (10 µL total volume) was comprised of 5 µL of Roche FastStart Universal SYBR Green Master (ROX) (Roche, Basel, Switzerland), 0.75 µL of each primer (10 µM), 0.5 µL of diluted cDNA and 3µL of PCR-grade ddH2O. No-template controls and melting curve analysis were included for each gene during each run. Three biological replications were used and three measurements were performed on each replicate.
2.4. Statistical analysis
The statistical significance of differences was calculated by ANOVA. The results are expressed as the mean ± SE of at least three independent replicates and were analyzed using the SPSS16.0 statistical software package (Chicago, IL, USA). GraphPad Prism 7 software (GraphPad Software, San Diego, CA, USA) was used for construction of graphs.
3. Results
3.1. Grape sampling and development
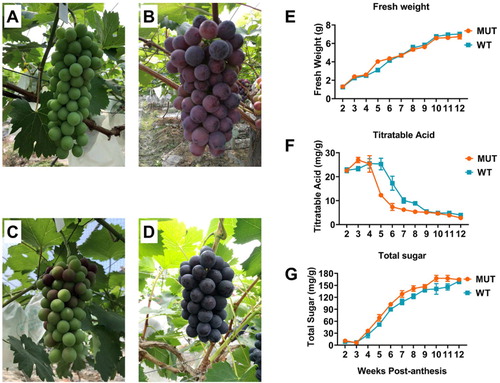
Berries from V. vinifera WT and MUT were sampled at 7- to 14-day intervals throughout the growing season, with the shorter intervals occurring in the period coinciding with the expected time of veraison. At five weeks post-anthesis, the berry size of the MUT was slightly larger than that of the WT (data not shown), with color changes ((A,C)). Similar berry size was observed in both grape cultivars at 10 weeks post-anthesis, when the MUT had a darker color than the WT ((B,D)). Other berry attributes including fresh weight, titratable acid and total sugar, were measured from 2 weeks post-anthesis until harvest at 12 weeks post-anthesis. The fresh weight of berries increased throughout the season, with a slowing of growth observed at approximately 3 weeks followed by a rapid increase in fresh weight from 4 to 5 weeks ((E)). There was no significant difference in fresh weight between WT and MUT grapes, except at 5 weeks, when an increase was observed in MUT. Compared with WT, the titratable acids in MUT accumulated earlier in the season and reached a peak concentration at approximately 3 weeks post-anthesis. From 4 to 6 weeks, the titratable acid content dropped rapidly and continued to decrease until harvest in MUT ((F)). The accumulation of total soluble solids in MUT started earlier and significantly increased between weeks 4 and 6, and then increased steadily until till full ripening ((G)). The decreasing titratable acid content and rapidly increasing soluble sugar are examples of the physiological changes that characterize veraison, which is most easily recognized in grape varieties by the development of pigment over a relatively short period of time. These results indicated that MUT entered veraison earlier than WT. According to the physiological parameters collected during berry development, we can speculate that the main differences in the fruit ripening process between WT and MUT occurred from 4 weeks to 8 weeks post-anthesis. Given our interest in the transcriptional changes that may be involved in regulating grape development and ripening, we chose to carry out global mRNA sequencing on samples at 2, 4, 5, 8 and 10 weeks post-anthesis (referred to as stage 1–5), corresponding to the stages E-L 33, 35, 36, 37 and 38 on the modified E-L system in MUT.
Figure 1. The morphology of two grape cultivars, ‘Summer Black’ at 5 (A) and 10 (B) weeks post-anthesis, ‘Tiangong Moyu’ at 5 (C) and 10 (D) weeks post-anthesis. Berry parameters in different developmental stages, fresh weight (E); titratable acid (F); total sugar (G).
3.2. Evaluation of RNA sequencing data
To obtain a global view of the transcriptome of grape berries, high-throughput RNA-Seq using the Illumina HiSeq 2000 sequencing platform (Vazyme BioTech Co., Ltd., Nanjing, China) was performed on RNAs during the developmental stages for both WT and MUT. RNA-Seq analysis generated approximately 150 Gb of sequence data, and every sample was represented by over 45 million reads, which is sufficient for the quantitative analysis of gene expression. All of the raw and clean data and their qualities are listed in . The raw reads were trimmed by removing low-quality reads and adapters. The Q30 scores of clean bases were approximately 93% for these samples. The quality was assessed by saturation analysis.
Table 1. Summary of sequencing data and statistics of the transcriptome assembly during developmental stages.
The sequence reads were then matched to the grape reference genome database by Hisat software. The total mapped ratio against the PN40024 genome was approximately 85% (), and uniquely mapped reads were 77% to 80%.
3.3. Differential gene expression
After alignment and assembly, the expression of genes was detected for both WT and MUT during berry development by removal of partial overlapping sequences. Gene expression during five developmental stages in the two cultivars is summarized in .
Table 2. Numbers of differentially expressed genes (FDR < 0.05 and Log2FC > 1) during developmental stages. FDR, false discovery rate; FC, fold change (T means 5 development stages for MUT, S means 5 development stages for WT).
Among the DEGs, 1105 (297 upregulated and 808 downregulated), 3801 (1482 upregulated and 2319 downregulated), 2449 (965 upregulated and 1484 downregulated), 1365(533 upregulated and 832 downregulated) and 1390 (505 upregulated and 885 downregulated) DEGs were significantly changed by at least two-fold in stages 1, 2, 3, 4 and 5, respectively, compared with WT.
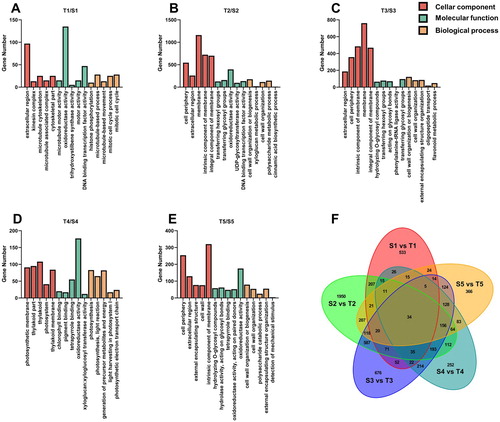
All DEGs during berry development were visualized by a Venn diagram ((F)). A relatively large number of these genes were specifically upregulated and downregulated at stages 2 and 3. Therefore, the DEGs around veraison were used for further research.
Figure 2. Differential expression genes at different developmental stages were annotated to various different biological processes, molecular functions and cellular components based on GO enrichment analysis, stage 1 (A), stage 2 (B), stage 3 (C), stage 4 (D), stage 5 (E). Venn diagrams showing the number of overlapping and non-overlapping genes with significantly differential expression levels (FDR < 0.05 and Log2FC > 1) during developmental stages (F). S1 to S5 represent the developmental stage (stage 1–5) in WT, T1 to T5 represent the developmental stage (stage 1–5) in MUT.
3.4. GO functional annotation and KEGG analysis
Gene Ontology (GO), as an international standardized gene functional analysis system, was used to classify the functions of the transcripts during grape development. DEGs in each developmental stage were annotated to various biological processes, molecular functions and cellular components. The top 5 most enriched GO sub-terms are showed in (A–E) (ordered by p-value). Extracellular region, microtubule motor activity and histone phosphorylation were the top categories in cellular component, molecular function and biological process at stage 1, respectively. For stage 2, the most enriched categories were cell periphery, transferring hexosyl group and cell wall organization or biogenesis in the 3 sub-terms, respectively. Extracellular region, hydrolyzing O-glycosyl compounds and cell wall organization or biogenesis were the most enriched in each sub-term, respectively at stage 3. In stage 4, the top three major categories were photosynthetic membrane, chlorophyll binding and photosynthesis. The cell periphery, hydrolyzing O-glycosyl compounds and cell wall organization or biogenesis were most enriched at stage 5.
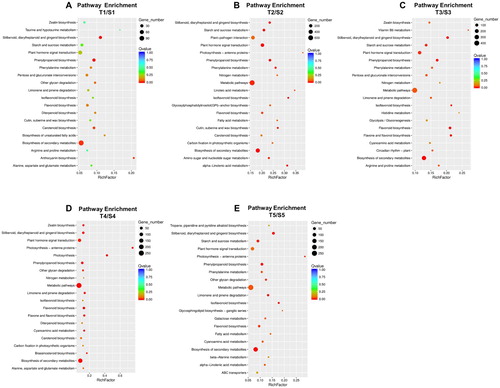
Kyoto Encyclopedia of Genes and Genomes (KEGG) pathway annotation is a useful tool to understand the biological functions of genes. Herein, KEGG annotation was performed on DEGs during 5 developmental stages. The top ranked clusters in the stage 1 were biosynthesis of secondary metabolites, phenylpropanoid biosynthesis and stilbenoid, diarylheptanoid and gingerol biosynthesis, based on gene number and Q values. In stage 2, metabolic pathways, biosynthesis of secondary metabolites and plant–pathogen interactions were the most enriched clusters. Plant hormone signal transduction was the major cluster in stage 3, following metabolic pathways and biosynthesis of secondary metabolites. A similar enriched cluster was also investigated in stages 4 and 5, including metabolic pathways, biosynthesis of secondary metabolites and plant hormone signal transduction. The less enriched clusters ranked at the top are showed in .
Figure 3. Differential expressed genes cluster in pathway based on KEGG analysis in two grape cultivars at different development stages, stage 1 (A), stage 2 (B), stage 3 (C), stage 4 (D), stage 5 (E). Rich factor refers to the ratio of the differential expressed genes number enriched in the pathway to the number of annotated genes. Bigger Rich factor means more significant enrichment. The q-value is the corrected p-value after multiple hypotheses testing, smaller q-value means more significant enrichment. S1 to S5 represent the developmental stage (stage 1–5) in WT, T1 to T5 represent the developmental stage (stage 1–5) in MUT.
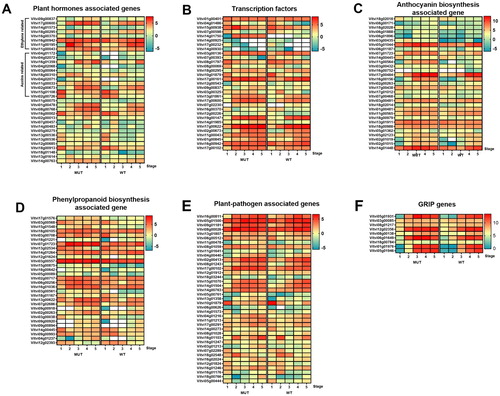
We further investigated DEGs with key functions and involvement in important biological processes, focusing on the expression change over the 5 sampling time points in both WT and MUT. The genes were divided into different categories, pathways and processes, including plant hormone-associated ((A)), transcription factors ((B)), anthocyanin biosynthesis ((C)), phenylpropanoid biosynthesis ((D)), plant–pathogen interaction ((E)) and GRIP genes ((F) & Supplementary dataset 1).
Figure 4. Differentially expressed genes related to plant hormones (A), transcription factors (B), anthocyanin biosynthesis (C), phenylpropanoid biosynthesis (D), plant–pathogen (E), GRIP genes (F), the color scale indicates Log2(FPKM), the blank cell means FPKM=0.
3.5. Validation of gene expression using RT-qPCR
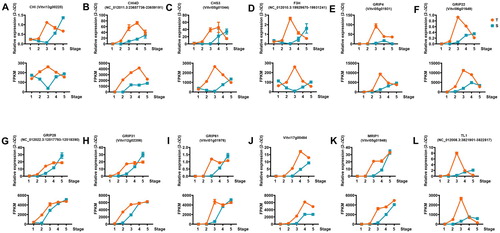
To validate the accuracy and reproducibility of the expression profiles obtained by RNA-Seq, 12 transcripts were selected for RT-qPCR. The fragments per kilobase of exon model per million mapped reads (FPKM) values, RNA-Seq and RT-qPCR fold changes are listed in Table S1. The RT-qPCR fold changes in the expression of these genes were calculated. The changes generally agreed with the transcript abundance measured by RNA-Seq, suggesting the reliability of the RNA-Seq data ().
Figure 5. Validation of gene expression in transcriptome results with RT-qPCR. CHI (A), CHI4D (B), CHS3 (C), F3H (D), GRIP4 (E), GRIP22 (F), GRIP28 (G), GRIP31 (H), GRIP61 (I), Vitvi17g00484 (J), MRIP1 (K), TL1 (L). For each comparison, the top plot is the gene expression by qRT-PCR in 2-ΔCt, the bottom plot is the gene expression by RNA-seq in FPKM. T represents MUT, S represents WT.
4. Discussion
Fruit ripening involves many complicated physiological and molecular processes, affecting flavor, texture, color and aroma (Guo et al. Citation2016). In this research, a common grape cultivar (WT) and its early-ripening mutant (MUT) were selected for investigation of their physiological and transcriptomic differences. Significant changes were observed in titratable acid and total sugar accumulation at 4–6 weeks post anthesis, indicating that the progression of ripening showed some differences between the two grape cultivars. Thus, RNA-seq was conducted to elucidate the genetic mechanisms underlying the differences between WT and MUT, and the DEGs in the two grape cultivars at different developmental stages were then annotated and analyzed.
Plant hormones play key roles in the control of fruit ripening (Zhong et al. Citation2013). Some hormones, such as ABA, can positively regulate the ripening process of various fruit types (Jia et al. Citation2011; Farcuh et al. Citation2019), while auxins always delay ripening (Ohmiya Citation2000; Kuhn et al. Citation2013). Hence, we first focused on the DEGs related to plant hormone biosynthesis and signaling. Based on KEGG annotation, our data indicated that the plant hormone signal transduction pathway was enriched throughout the ripening process. Vitvi08g00768 (abscisic acid receptor PYL4) was upregulated at stages 2–5 in MUT compared to WT. PYL4 has been reported to inhibit a negative regulator of ABA signaling in Nicotiana tabacum (Lackman et al. Citation2011), confirming its positive role in regulating ABA signaling. Vitvi02g00013 (E3 ubiquitin-protein ligase RHA1B) was expressed equally in MUT and WT at stages 1 and 2, while a significant upregulation was observed in MUT at the later 3 stages. A study in Arabidopsis revealed an enhanced expression of RHA1B when exposed to ABA (Pavicic et al. Citation2019), thus, we hypothesized that a more sensitive response to ABA occurs in the early-ripening mutant. Galactinol synthase catalyzes the first step in the biosynthesis of raffinose and plays a key regulatory role in carbon partitioning between sucrose and raffinose (Taji et al. Citation2002), and ABA treatment also stimulates the expression of galactinol synthase in grapes (Koyama et al. Citation2010). Our results demonstrated a decrease at stages 1 and 2 but an increase in stages 3–5 of galactinol synthase 1 (Vitvi07g00457), which may contribute to sugar accumulation in MUT ((A)). The differential expression of these genes in MUT may imply an earlier response to ABA in this cultivar than in WT, accelerating the ripening process.
Grapes were first classified as non-climacteric fruit whose ripening is thought to be ethylene independent, while some recent studies demonstrated a fully functional pathway in grape berry tissues for ethylene synthesis and ethylene perception is critical for some berry changes (Chervin et al. Citation2004; Chervin et al. Citation2008). In our results, the expression of ethylene-responsive transcription factor ERF003-like (Vitvi09g00837) in MUT was first equal to that in WT at stage 1 and then declined at stage 2, but at stage 3–5, a significant increase was observed in MUT compared to WT. Several ethylene-responsive transcription factors were also enriched in the early-ripening mutant, such as ethylene-responsive transcription factor ERF014-like (Vitvi18g00295), ethylene-responsive transcription factor ERF105 (Vitvi16g00370) and ethylene-responsive transcription factor ERF027 (Vitvi16g00942), with similar expression pattern. It may be speculated that ethylene plays a positive role in berry ripening. Moreover, 1-aminocyclopropane-1-carboxylate oxidase 1 (Vitvi11g00195, also known as ACO3) was observed to be increased at stages 2 and 3 and decreased at the other developmental stages, as shown in (A). As a putative ethylene biosynthesis pathway gene, ACO3, was observed increase after grape veraison (Böttcher et al. Citation2013a). Auxins have previously been implicated as ripening inhibitors, but our results indicated the overexpression of some auxin-related genes, such as auxin transporter-like protein 3 (Vitvi18g00310), indole-3-acetic acid-induced protein ARG7-like (Vitvi16g01359), auxin-responsive protein SAUR23 (Vitvi04g02072), auxin-responsive protein SAUR21 (Vitvi04g01172), auxin-induced protein 22D (Vitvi14g00483), auxin-induced protein 15A-like (Vitvi03g00064), auxin response factor 7 (Vitvi11g00043), auxin-responsive protein SAUR21 (Vitvi04g02068) and auxin-responsive protein SAUR50 (Vitvi11g00033), implying a probable role of auxin in berry ripening. It has been reported that the upregulation of some auxin biosynthesis genes at the time of ripening initiation and/or during ripening was preceded by an increase in several ethylene biosynthesis genes (Böttcher et al. Citation2013b), which may suggest that the interactions between ethylene and auxin are critical to the ripening process ((A)).
Transcription factors are of great interest because of their roles in regulating the expression of numerous genes and mediating biological pathways and developmental processes. As described above, some transcription factors are transcribed by stimulation from hormones, such as auxins and ethylene, and regulate downstream genes. The basic leucine zipper family is one of the largest transcription factor families in plants and participates in various biological processes, including the regulation of plant growth, development and ripening (Hu et al. Citation2016; Banerjee and Roychoudhury Citation2017). Additionally, a transcriptional regulator role of basic leucine zipper in berry ripening in the synthesis of phenolic compounds and cell wall softening has been revealed (Nicolas et al. Citation2014). Two basic leucine zipper, basic leucine zipper 34 (Vitvi19g00147) and basic leucine zipper 61 (Vitvi12g00226), were upregulated at stages 2–4 in MUT compared to WT, which may contribute to the early-ripening phenotype. The MYBPA1 (Vitvi15g00938) transcription factor showed a dramatic upregulation at stage 2, which is well known to promote proanthocyanidins synthesis (Wang et al. Citation2018), consistent with previous reports (Bogs et al. Citation2007). MYB24 (Vitvi14g01750) was highly expressed throughout the development period of grape berries in mutant, which was nearly undetectable in wild type. MYB24 regulates jasmonate-mediated stamen maturation in Arabidopsis (Mandaokar Citation2009), while little is known about its role in grapes, with higher expression only documented in post-veraison berries than young berries (Matus et al. Citation2008); thus, the molecular mechanism by which MYB24 affects berry ripening should be further explored. MYBCS1 (Vitvi08g01797), which also named MYB5a, is another R2R3-MYB transcription factor that was previously reported to regulate the spatiotemporal expression of flavonoid structural genes during berry development (Cavallini et al. Citation2014), but our results indicated a downregulation of MYB5a throughout berry maturation in MUT, implying an alternative mechanism in flavonoid biosynthesis ((B)).
It is well established that flavonoids are plant secondary metabolites and major constituents of plant pigments (Braidot et al. Citation2008). Flavonoids mostly accumulate in berry teguments (Bogs et al. Citation2006), and are responsible for the color, taste and nutritional value of berries. Anthocyanins are the most abundant flavonoid constituents of fruits and vegetables, whose biosynthesis involves a common branch of the flavonoid pathway and has been intensively investigated in many plants including grape (Palapol et al. Citation2009). Anthocyanin biosynthesis is mainly regulated by R2R3-MYB transcription factors, for example, MYBA1 and MYBA2 regulate expression of UDP-glucose: flavonoid 3-O-glucosyltransferase (UFGT), which converts anthocyanidins to anthocyanins (Höll et al. Citation2013). Either MYBA1 or MYBA2 inactive mutation leads to white-berried cultivar (Walker et al. Citation2007). These two R2R3-MYB transcription factors (Vitvi02g01019 and Vitvi02g01015) were observed increase at stages 2 and 3 in MUT according to our result ((C)). One of the known upstream regulators of anthocyanin biosynthesis is ethylene, and exposure grape berries to ethylene-releasing compound at veraison upregulates some anthocyanin biosynthesis-associated genes, such as CHS (Vitvi14g01448) and UFGT (Vitvi16g00156), as well as the accumulation of anthocyanin (El-Kereamy et al. Citation2003). Increase of CHS and UGFT are also observed at stages 2–4 in MUT. Additionally, anthocyanidin biosynthesis has been shown to be affected by the regulation of ABA (Li et al. Citation2019). Our results illustrated that elevated anthocyanin biosynthesis pathway coincided with the activation of the ethylene and ABA-responsive pathways, verifying the roles of ABA and ethylene in contributing to the early-ripening phenotype ((C)).
Phenolic compounds produced by the phenylpropanoid pathway paly vital role in fruit pigmentation and disease resistance response during ripening. Several genes involved in phenylpropanoid pathway also participate in flavonoid biosynthesis, such as phenylalanine ammonia lyase (PAL), O-methyltransferase, cinnamyl alcohol dehydrogenase (CAD) and peroxidases (Singh et al. Citation2010). Flavonoid then composed of branch pathways leading to isoflavonoids, flavonols, proanthocyanidins (condensed tannins), and anthocyanins. PAL catalyzes the first reaction in the pathway of phenylpropanoid biosynthesis (Ortega-García et al. Citation2009) and participates in the regulation of the circulatory system, lignin accumulation, and the response against pathogens or mechanical damage (Sewalt et al. Citation1997). Additionally, catalytic activity of PAL can be modulated by ABA and ethylene, subsequently affected anthocyanin accumulation (Jiang and Joyce Citation2003). Methyltransferases are enzymes that catalyze the transfer of a methyl group to a hydroxyl group of the substrate molecule. Methyltransferases play a critical role in the biosynthesis of many classes of compounds required for plant growth, aroma generation, and plant defense. Hundreds of O-methylated flavonoids have been found in plant, and they belong to the chalcones, flavones, isoflavones, and flavonols, as well as their dihydro derivatives (Wollenweber and Dietz Citation1981). In our result, several methyltransferase transcripts are identified differentially expressed between MUT and WT during developmental stages, such as caffeoyl-CoA O-methyltransferase (Vitvi07g01723), caffeic acid 3-O-methyltransferase (Vitvi02g00263 and Vitvi15g00875) and O-methyltransferase (Vitvi12g02393). Vitvi07g01723 is slightly upregulated at stages 1–5 in MUT, a similar tendency is also observed in Vitvi02g00263 and Vitvi15g00875 expression, while for Vitvi12g02393, the expression downregulates in MUT at stages 2–5. Actually, the majority of genes involved in phenylpropanoid pathway are upregulated in MUT after veraison, which may imply an enhanced phenylpropanoid pathway in early-ripening mutant ((D)).
A great number of plant–pathogen associated genes were upregulated in MUT in our transcriptome data, coinciding with extensive reports (Davies and Robinson Citation2000; Guo et al. Citation2016). In addition, as described above, some DEGs involved in phenylpropanoid pathway also play roles in pathogen defense. The emerging role of calcium in regulating the activities of hormonal and environmental signals associated with biotic and abiotic stresses has been well illustrated (Munir et al. Citation2016). According to a recent study, calmodulin-like proteins, as well as calmodulin proteins, were respond to stimulation of temperature and ethylene, which indicates a potential vital role of these genes in the papaya ripening process (Ding et al. Citation2018). Given the differential expression of several calcium-associated genes in our transcriptome data, including calmodulin-like protein 5 (Vitvi05g01500), calcium binding (Vitvi08g00026) and calcium-dependent protein kinase 26 (Vitvi02g00413), there were other significant DEGs (Vitvi09g01181, Vitvi17g00102, Vitvi15g01070, Vitvi14g00763, Vitvi04g01216) related to the plant–pathogen response, suggesting their possible role in ripening regulation ((E)).
Ripening-related proteins have been widely reported to play a part in the response to biotic and abiotic stresses, as well as fruit ripening (Stanley Kim et al. Citation2005; Chruszcz et al. Citation2013; Zhang et al. Citation2018), while still remain elusive in grapes. The genes coding for ripening-related proteins in our results were analyzed, and interestingly, a similar temporal expression pattern was found for most genes, including GRIP4 (Vitvi05g01931), GRIP21 (Vitvi08g01217), GRIP31 (Vitvi12g02356), GRIP32 (Vitvi08g00138), GRIP22 (Vitvi06g01649), GRIP55 (Vitvi18g00784) and GRIP61 (Vitvi01g01976), whose expression in MUT was close to that in WT at stage 1, drastically increased at stages 2 and 3, and then dropped to a level close level to that in WT at the later stages. These genes were closely related to berry ripening; for example, GRIP4, which encodes a proline-rich protein belonging to the cell wall structure, delayed its expression following NAA applications at berry veraison. The expression of GRIP22 was also observed in several studies and may contribute to the early-ripening berry phenotype (Guo et al. Citation2016; Ma and Yang Citation2019). The expression variation of the genes during berry ripening process in the two grape cultivars might represent some common mechanisms contributing to early berry ripening ((F)).
In conclusion, our results revealed an acceleration of berry ripening in MUT, especially during 4–8 weeks post-anthesis, with a rapid accumulation of soluble sugar and a decline in titratable acid, according to our physiological parameters. The changes that occurred at the transcription level were also investigated using transcriptomic analysis to reveal the underlying mechanisms. DEGs at each berry development stage were clustered based on their GO functional categories and KEGG enrichment analysis, and we next identified the possible genes regulating development mainly enriched in plant hormone signal transduction, transcription factors, phenylpropanoid biosynthesis and anthocyanin-related biosynthesis, as well as some plant-pathogen associated genes and GRIP genes. The temporal expression pattern of these genes in two grape cultivars, coinciding with changes in physiological, will offer insights into the regulation of the ripening process and contribute to the development of early-ripening phenotypes.
Supplemental Material
Download MS Excel (1.3 MB)Acknowledgments
This wornk was supported by the China Agriculture Research System under Grant CARS-29-12 and the Key Project for New Agricultural Cultivar Breeding in Zhejiang Province under Grant 2016C02052-6.
Disclosure statement
No potential conflict of interest was reported by the author(s).
Additional information
Funding
Notes on contributors
Lingzhu Wei
Lingzhu Wei holds a PhD in applied plant genomics from Nanjing Agricultural University. Now she is an assistant professor of Institute of Horticulture, Zhejiang academy of Agricultural sciences. Her current research interests focus on fruit tree genetics and breeding.
Yuehua Cao
Yuehua Cao holds an MSc in biology from Zhejiang Normal University. Now she is a technician of Institute of Horticulture, Zhejiang academy of Agricultural sciences. Her current research interests focus on fruit tree breeding.
Jianhui Cheng
Jianhui Cheng holds a PhD in biology from Zhejiang University. Now he is an assistant professor of Institute of Horticulture, Zhejiang academy of Agricultural sciences. His current research interests focus on fruit tree genetics and breeding.
Jiang Xiang
Jiang Xiang holds a PhD in pomology from China Agricultural University. Now he is an assistant professor of Institute of Horticulture, Zhejiang academy of Agricultural sciences. His current research interests focus on fruit tree genetics and breeding.
Biwei Shen
Biwei Shen holds an MSc in biology from Zhejiang Normal University. Now she is a technician of Institute of Horticulture, Zhejiang Academy of Agricultural Sciences. Her current research interests focus on fruit tree breeding.
Jiang Wu
Jiang Wu holds an MSc in pomology from Zhejiang Agricultural University. Now she is a professor of Institute of Horticulture, Zhejiang academy of Agricultural sciences. Her current research interests focus on fruit tree breeding and cultivation.
References
- Allan AC, Hellens RP, Laing WA. 2008. MYB transcription factors that colour our fruit. Trends Plant Sci. 13(3):99–102.
- Banerjee A, Roychoudhury A. 2017. Abscisic-acid-dependent basic leucine zipper (bZIP) transcription factors in plant abiotic stress. Protoplasma. 254(1):3–16.
- Bogs J, et al. 2006. Identification of the flavonoid hydroxylases from grapevine and their regulation during fruit development. Plant Physiol. 140(1):279–291.
- Bogs J, et al. 2007. The grapevine transcription factor VvMYBPA1 regulates proanthocyanidin synthesis during fruit development. Plant Physiol. 143(3):1347–1361.
- Böttcher C, et al. 2013a. Ripening of grape berries can be advanced or delayed by reagents that either reduce or increase ethylene levels. Funct Plant Biol. 40(6):566–581.
- Böttcher C, et al. 2013b. Interactions between ethylene and auxin are crucial to the control of grape (Vitis vinifera L.) berry ripening. BMC Plant Biol. 13(1):222.
- Braidot E, et al. 2008. Evidence for a putative flavonoid translocator similar to mammalian bilitranslocase in grape berries (Vitis vinifera L.) during ripening. Planta. 228(1):203.
- Canaguier A, et al. 2017. A new version of the grapevine reference genome assembly (12X. v2) and of its annotation (VCost. v3). Genom Data. 14:56.
- Cavallini E, et al. 2014. Functional diversification of grapevine MYB5a and MYB5b in the control of flavonoid biosynthesis in a petunia anthocyanin regulatory mutant. Plant Cell Physiol. 55(3):517–534.
- Chervin C, et al. 2004. Ethylene seems required for the berry development and ripening in grape, a non-climacteric fruit. Plant Sci. 167(6):1301–1305.
- Chervin C, et al. 2008. Stimulation of the grape berry expansion by ethylene and effects on related gene transcripts, over the ripening phase. Physiol Plant. 134(3):534–546.
- Chervin C, Deluc L. 2010. Ethylene signalling receptors and transcription factors over the grape berry development: gene expression profiling. Vitis. 49(3):129–136.
- Chruszcz M, et al. 2013. Structural and bioinformatic analysis of the kiwifruit allergen Act d 11, a member of the family of ripening-related proteins. Mol Immunol. 56(4):794–803.
- Coombe BG. 1995. Growth stages of the Grapevine: Adoption of a system for identifying grapevine growth stages. Aust J Grape Wine Res. 1(2):104–110.
- Davies C, Böttcher C. 2009. Hormonal control of grape berry ripening. In: Roubelakis-Angelakis, Kalliopi A., editors. Grapevine molecular physiology & biotechnology. Dordrecht: Springer; p. 229–261.
- Davies C, Robinson SP. 2000. Differential screening indicates a dramatic change in mRNA profiles during grape berry ripening. Cloning and characterization of cDNAs encoding putative cell wall and stress response proteins. Plant Physiol. 122(3):803–812.
- Ding X, et al. 2018. Genome-wide identification and expression analyses of the calmodulin and calmodulin-like proteins reveal their involvement in stress response and fruit ripening in papaya. Postharvest Biol Technol. 143:13–27.
- El-Kereamy A, et al. 2003. Exogenous ethylene stimulates the long-term expression of genes related to anthocyanin biosynthesis in grape berries. Physiol Plant. 119(2):175–182.
- Farcuh M, et al. 2019. Hormone balance in a climacteric plum fruit and its non-climacteric bud mutant during ripening. Plant Sci. 280:51–65.
- Guo D-L, et al. 2016. Comparative RNA-Seq profiling of berry development between table grape ‘kyoho’and its early-ripening mutant’Fengzao’. BMC Genomics. 17(1):795.
- Haider MS, et al. 2017. Grapevine immune signaling network in response to drought stress as revealed by transcriptomic analysis. Plant Physiol Biochem. 121:187–195.
- He F, et al. 2010. Biosynthesis of anthocyanins and their regulation in colored grapes. Molecules. 15(12):9057–9091.
- Höll J, et al. 2013. The R2R3-MYB transcription factors MYB14 and MYB15 regulate stilbene biosynthesis in Vitis vinifera. Plant Cell. 25(10):4135–4149.
- Hu W, et al. 2016. Genome-wide analyses of the bZIP family reveal their involvement in the development, ripening and abiotic stress response in banana. Sci Rep. 6:30203.
- Jaillon O, et al. 2007., The grapevine genome sequence suggests ancestral hexaploidization in major angiosperm phyla. Nature. 449(7161):463.
- Jia H-F, et al. 2011. Abscisic acid plays an important role in the regulation of strawberry fruit ripening. Plant Physiol. 157(1):188–199.
- Jiang Y, Joyce DC. 2003. ABA effects on ethylene production, PAL activity, anthocyanin and phenolic contents of strawberry fruit. Plant Growth Regul. 39(2):171–174.
- Koyama K, Sadamatsu K, Goto-Yamamoto N. 2010. Abscisic acid stimulated ripening and gene expression in berry skins of the Cabernet Sauvignon grape. Funct Integr Genomics. 10(3):367–381.
- Kuhn N, et al. 2013. Berry ripening: recently heard through the grapevine. J Exp Bot. 65(16):4543–4559.
- Lackman P, et al. 2011. Jasmonate signaling involves the abscisic acid receptor PYL4 to regulate metabolic reprogramming in Arabidopsis and tobacco. Proc Natl Acad Sci U S A. 108(14):5891–5896.
- Li G, et al. 2019. ABA mediates development-dependent anthocyanin biosynthesis and fruit coloration in Lycium plants. BMC Plant Biol. 19(1):317.
- Ma Q, Yang J. 2019. Transcriptome profiling and identification of the functional genes involved in berry development and ripening in Vitis vinifera. Gene. 680:84–96.
- Mandaokar A. 2009. MYB108 acts together with MYB24 to regulate jasmonate-mediated stamen maturation in Arabidopsis. Plant Physiol. 149(2):851–862.
- Martínez-Esteso Maria José, Sellés-Marchart Susana, Lijavetzky Diego, Angeles Pedreño Maria, Bru-Martínez Roque. 2011. A DIGE-based quantitative proteomic analysis of grape berry flesh development and ripening reveals key events in sugar and organic acid metabolism. J Exp Bot. 62(8):2521–2569.
- Matus JT, Aquea F, Arce-Johnson P. 2008. Analysis of the grape MYB R2R3 subfamily reveals expanded wine quality-related clades and conserved gene structure organization across Vitis and Arabidopsis genomes. BMC Plant Biol. 8(1):83.
- Munir S, et al. 2016. Genome-wide identification, characterization and expression analysis of calmodulin-like (CML) proteins in tomato (Solanum lycopersicum). Plant Physiol Biochem. 102:167–179.
- Nicolas P, et al. 2014. The basic leucine zipper transcription factor abscisic acid response element-binding factor2 is an important transcriptional regulator of abscisic acid-dependent grape berry ripening processes. Plant Physiol. 164(1):365–383.
- Ohmiya A. 2000. Effects of auxin on growth and ripening of mesocarp discs of peach fruit. Sci Hortic. 84(3-4):309–319.
- Ortega-García F, et al. 2009. Phenylalanine ammonia-lyase and phenolic compounds in leaves and fruits of Olea europaea L. cv. Picual during ripening. J Sci Food Agric. 89(3):398–406.
- Palapol Y, et al. 2009. A MYB transcription factor regulates anthocyanin biosynthesis in mangosteen (Garcinia mangostana L.) fruit during ripening. Planta. 229(6):1323–1334.
- Pavicic M, et al. 2019. High throughput in vitro seed germination screen identified new ABA responsive RING-type ubiquitin E3 ligases in Arabidopsis thaliana. Plant Cell, Tissue and Organ Culture. 1–13.
- Payasi A, et al. 2009. Biochemistry of fruit softening: an overview. Physiol Mol Biol Plants. 15(2):103–113.
- Sewalt VJH, et al. 1997. Reduced lignin content and altered lignin composition in transgenic tobacco down-regulated in expression of L-phenylalanine ammonia-lyase or cinnamate 4-hydroxylase. Plant Physiol. 115(1):41–50.
- Singh R, Rastogi S, Dwivedi UN. 2010. Phenylpropanoid metabolism in ripening fruits. Compr Rev Food Sci Food Saf. 9(4):398–416.
- Stanley Kim H, et al. 2005. Transcriptional divergence of the duplicated oxidative stress-responsive genes in the Arabidopsis genome. Plant J. 41(2):212–220.
- Taji T, et al. 2002. Important roles of drought-and cold-inducible genes for galactinol synthase in stress tolerance in Arabidopsis thaliana. Plant J. 29(4):417–426.
- Trapnell C, Pachter L, Salzberg SL. 2009. Tophat: discovering splice junctions with RNA-Seq. Bioinformatics. 25(9):1105–1111.
- Walker AR, et al. 2007. White grapes arose through the mutation of two similar and adjacent regulatory genes. Plant J. 49(5):772–785.
- Wang N, et al. 2018. The proanthocyanidin-specific transcription factor Md MYBPA 1 initiates anthocyanin synthesis under low-temperature conditions in red-fleshed apples. Plant J. 96(1):39–55.
- Wang X, et al. 2017. Comparative transcriptome analysis of berry-sizing effects of gibberellin (GA 3) on seedless Vitis vinifera L. Genes Genomics. 39(5):493–507.
- Wollenweber E, Dietz VH. 1981. Occurrence and distribution of free flavonoid aglycones in plants. Phytochemistry. 20(5):869–932.
- Yu J, et al. 2020. Transcriptome analysis of calcium-induced accumulation of anthocyanins in grape skin. Sci Hortic. 260:108871.
- Zhang N, et al. 2018. Genome-wide evolutionary characterization and expression analyses of major latex protein (MLP) family genes in Vitis vinifera. Mol Genet Genomics. 293(5):1061–1075.
- Zhang Y-J, et al. 2014. Comparative transcriptome analyses between a spontaneous late-ripening sweet orange mutant and its wild type suggest the functions of ABA, sucrose and JA during citrus fruit ripening. PLoS One. 9(12):e116056.
- Zhong S, et al. 2013. Single-base resolution methylomes of tomato fruit development reveal epigenome modifications associated with ripening. Nat Biotechnol. 31(2):154.