
ABSTRACT
Relatively little is known about the physiological significance of betalain pigments. To investigate a possible protective role for betalains (betacyanin), from UV-B irradiation, two cultivars of A. tricolor, Red-Leaf (RL) and Green-Leaf (GL) were obtained and VIGS method was used to produce isogenic derivatives of RL. Short-term responses to UV-B in the leaves were compared with and without detectable betalains. Following exposure, the red and green tissues showed similar decrease in photosynthetic capacity and in the increased production of UV-B stress markers including melatonin, flavonoids, phenolics, and PAL1 and RCD1 gene transcripts. Red tissues showed an increase in photosynthetic pigments under UV-B treatment, whereas the photosynthetic pigments and CAB1 and CAB2 gene transcripts decreased. The responses observed were similar for both high-betacyanin (RL) plants, and green plants (VIGS, GL), from which it was concluded that betacyanin does not have a UV-B protective role in amaranth leaves, under the experimental conditions.
1. Introduction
Earth’s stratospheric ozone layer filters out most of the sun’s highly energetic ultraviolet (UV) radiation, allowing significant amounts of only UV-A (320–400 nm) and UV-B (280–315 nm) wavelengths to reach the earth’s surface (Hollósy Citation2002). Of these wavelengths, UV-B is the most damaging to cellular components. Damage is caused through direct effects on chemical bonds of macromolecules, and indirectly through production of reactive oxygen species (ROS) (Frohnmeyer Citation2003; Kataria et al. Citation2014). Nucleic acids, proteins, membranes, pigments, and growth regulators are all susceptible to the harmful effects of UV-B (Kaur et al. Citation2015; Yokawa et al. Citation2016). At the physiological level, UV-B exposure results in stunting, degradation of photosynthetic machinery, and reduction in leaf number and biomass (Delucia et al. Citation1992; Jansen et al. Citation1998; Hollósy Citation2002; Frohnmeyer Citation2003; Kataria et al. Citation2014). Some species produce phenolic sunscreens to reduce exposure to UV-B radiation (Burger and Edwards Citation1996; Gould Citation2004; Rozema et al. Citation2009; Zhang et al. Citation2017). Secondary metabolites including flavonoids, anthocyanins, betalains, and indoleamines (e.g. melatonin) are produced and are strong free radical scavengers that may detoxify the effects of UV-B induced ROS (Tan et al. Citation1993; Cai et al. Citation2003; Hardeland Citation2005; Lazar et al. Citation2013; Kaur et al. Citation2015; Yokawa et al. Citation2016).
In the last several decades, UV-B stress studies have focused on growth and physiological responses in higher plants including those that produce anthocyanin (Gould Citation2004; Sztatelman et al. Citation2015), but little attention has been given to betalainic species such as A. tricolor (Jain and Gould Citation2015). Presumably, betalain pigments have similar roles in the protection from abiotic stress but supporting evidence for this hypothesis is lacking. The quality and the intensity of visible light and UV-B radiation affect betalain pigment content in certain plant tissues (Girod and Zryd Citation1987; Kishima et al. Citation1991; Ibdah et al. Citation2002; Klein et al. Citation2018). Water and salt stress can also induce the pigments (Nakashima et al. Citation2011; Jain and Gould Citation2015), but the question remains: do plants with betalains have an advantage in the presence of UV-B?
UV-B stress causes a significant loss in photosynthetic activity, thereby impeding the growth and development of plant (Brandle et al. Citation1977; Hollósy Citation2002; Xu et al. Citation2010; Zuk-Golaszewska et al. Citation2011). Although UV-B clearly has a negative impact on photosynthesis (Kataria et al. Citation2014); reports of the effect of the radiation on light harvesting pigments such as chlorophyll and carotenoids have been inconsistent (Agrawal Citation1992; Middleton and Teramura Citation1993; Warren et al. Citation2002; Xu et al. Citation2010; Salama et al. Citation2011). Transcripts encoding CHLOROPHYLL BINDING PROTEINS (CAB1 and CAB2), decrease in abundance under UV-B in some species (Mackerness et al. Citation1997). In contrast PHENYLALANINE AMMONIA LYASE (PAL1) is upregulated in many plant species, including Pisum sativum (Kalbin et al. Citation2001), Petunia (Ryan et al. Citation2002), Cucumis sativus (Cantarello et al. Citation2005), and A. thaliana (Ulm et al. Citation2004; Morales et al. Citation2013). PAL1 is the first committed step in phenylpropanoid synthesis and is therefore key to the production of flavonoids, which have well-established roles in UV-B protection (Lister et al. Citation1996; Morales et al. Citation2010).
A. tricolor, a betalainic species, is presumably native to Asia. The stress-protective role of betalains in amaranths and other plants has been controversial (Deladino et al. Citation2017; Karamac et al. Citation2019). Information on the impact of UV-B radiation on betalainic plant is especially scant. In the present study, short-term responses to UV-B in A. tricolor leaves, with and without detectable betalains, were compared by measuring gas exchange, photosynthetic pigments, secondary metabolites, and transcript expression.
2. Materials and methods
2.1. Plant material
Seeds of the intensely red-pigmented variety A. tricolor cv. Red Leaf (herein after RL) were obtained from the vendor Pias Blommor (Kalmar, Sweden). The species identification was confirmed by David M. Brenner, amaranth curator (USDA-ARS-MWA-PIRU; Iowa State University, Ames, Iowa). Seeds of green A. tricolor cv. Green Leaf, (hereinafter GL) (Accession PI607446) were obtained from USDA (Ames, Iowa). All plants were germinated in plastic pots filled with potting mix and water in a growth chamber maintained at a temperature of 23°C with 16 h light and 8 h dark with photosynthetic photon flux density (PPFD) of 450 µmol m−2 s−1 produced from fluorescent tube lights. The PPFD was quantified using LI-250A Light Meter (LI-COR, Inc., Lincoln, Nebraska, USA).
VIGS (virus-induced gene silencing) was performed on the RL plants to target the betalain biosynthetic cytochrome P450 gene AtriCYP76AD1, as described by Adhikary et al. (Citation2019). VIGS-treated plants in which visible red pigments had been successfully eliminated from >90% of the area of new leaves were selected for use in further experiments and here described hereafter as VIGS.
2.2. Plant treatments
Experimental plants were grown in the conditions as mentioned above. Leaves treated with UV-B light were oriented to be parallel to the light source. One to two fully opened leaves at the second node from the apex were targeted and the other adjoining leaves were covered. The control group was exposed to the regular light conditions without UV-B, and the treatment group was exposed additionally to a high UV-B fluence (0.80 Wm−2) with a peak emission at 306 nm (spectral range from 280 to 355 nm) for 6 h. The high fluence was selected because there were earlier studies completed in the similar fluence range (Tevini et al. Citation1981; Nogués et al. Citation1998, Citation1999) and this study tried to imitate the similar environmental situation to the high UV index (UVI) value of 43 that has been reported in the tropical Andes (Cabrol et al. Citation2014). UV-B radiation was produced by 8 W fluorescent tube lights (G8T5E UV-B Light Source) and measured with a UVAB513B Digital Light Meter (Secaucus, New Jersey, USA). To minimize bias and make sure all treated plants received equal UV-B exposure, plants were placed randomly on a tray under the UV-B light source and the tray was rotated in every 2 h for 3 times in 6 h. The UV-B treatment started 3 h after the start of the regular photoperiod in the regular growth chamber and continued for 6 h of exposure. At least five individuals were treated for each plant type (GL, RL, VIGS) and the experiment was repeated in three independent replicates.
2.3. Chlorophyll extraction & quantification
Chlorophyll a, chlorophyll b, and carotenoids were isolated from fresh leaf samples following the methods outlined by Hiscox and Israelstam (Citation1978). In brief, 100 mg of leaf tissue was placed in a vial containing 7 ml dimethyl sulfoxide (DMSO) and incubated for 30 min at 70°C. The liquid was then transferred to a new tube and the volume was adjusted to 10 ml with DMSO. Two ml of freshly isolated sample was transferred to a clear cuvette, and absorbance readings were taken from 400 to 700 nm at a 23 ± 1°C on a UV-Vis spectrophotometer (UV-6300PC, VWR International, Pennsylvania, USA). The concentration (μg/ml) of pigments was calculated following the guidelines in Sumanta et al. (Citation2014): as follows, chlorophyll a (Ca) = 12.47A665.1 − 3.62A649.1; chlorophyll b (Cb) = 25.06A649.1 − 6.5A665.1; Carotenoids (c) = (1000A480 − 1.29Ca − 53.78Cb)/220.
2.4. Photosynthetic measurements
Using a photosynthetic gas exchange meter (Qubit Systems, Kingston, Ontario Canada), the carbon exchange rate (CER) was measured before and after UV-B treatment. Initial measurement (0 h) was made on the day prior to UV-B treatment, approximately 3 h after the start of the regular photoperiod in the growth chamber. On the day of treatment, the same plants were exposed to UV-B, beginning 3 h after the start of the regular photoperiod. The first measurement of photosynthetic activity was made after 2 h of continuous UV-B exposure. Following this measurement, plants were returned to constant UV-B exposure. Subsequent measurements were taken at three different time points at 2 h intervals. The carbon exchange rate (CER) was measured on the adaxial portion of the leaf maintaining a cycle of a light–dark-light period on the leaf chamber by turning on and off the LED light source (Qubit Systems Inc, Kingston, Ontario, Canada). During measurements, a constant flow rate of CO2 (121 ml/min) at a concentration of 400 parts per million (ppm), and the LED light flux of 500 µmol m−2 s−1 were maintained. This intensity was chosen because it was similar to the flux received by plants in the growth chamber and the intensity produced CER saturation in a reliable amount of time (2–3 min). A total of 15 red plants (RL), 12 VIGS plants, and 15 green plants (GL) were used in the experiment. A difference in CO2 intake (diffCO2), carbon exchange rate (CER), intercellular CO2 (Ci), and transpiration rate (Trans.Rate) were calculated following the guidelines provided by the Qubit Systems. The experiment was repeated at three independent times.
Prior to UV-B treatment, in the normal growth chamber conditions, the behavior of the plant was assessed by measuring CER, diffCO2, Ci, and Trans.Rate at different times in a day. The plants were photosynthetically active from 7 am to 6 pm in the growth conditions (Figure S1). Thus, the UV-B treatment was conducted during the active period and measured the photosynthesis activity.
2.5. Total phenolic quantification
Total phenolic content was determined using the original Folin–Ciocalteu reagent (Folin and Ciocalteau Citation1927) and later improved by Singleton and Rossi (Citation1965). The method was used in combination to Kaur and Kapoor (Citation2002) with some modifications. Flash frozen tissue samples (2 g) were homogenized in 80% ethanol at room temperature (23°C). The mixture was then centrifuged at 12,000 rcf for 15 min and the supernatant was collected. Using 80% ethanol, the residue was re-extracted twice and supernatants were combined. The supernatant was then evaporated to dryness at 23°C. Once the liquid had been evaporated, the residue was dissolved in 5 ml of deionized water. 200 µl of isolated phenolic extract was taken and diluted with 3 ml of deionized water and mixed with 0.5 ml of Folin–Ciocalteu reagent. The mixture was incubated for 3 min at 23°C, followed by addition of 2 ml of 20% (w/v) sodium carbonate. The mixture was incubated for an hour in the dark at a temperature, 23°C. The color was observed and absorbance was measured at 650 nm at a 23 ± 1°C in a UV-Vis spectrophotometer (UV-6300PC, VWR International, Pennsylvania, USA). The results were expressed as mg of gallic acid equivalent per g of dry weight of the extract.
2.6. Flavonoids extraction & quantification
The plant extract that was used for the total phenolic test was also used for the assessment of flavonoid content. The metabolite was quantified using a previously published method (Sen et al. Citation2013) with some modifications. An aliquot of 0.5 ml of the plant extract was taken and mixed with 1.5 ml of 95% ethanol. To this mixture, 0.1 ml of 10% aluminum nitrate (w/v), 0.1 ml of 1 M potassium acetate, 2.8 ml of deionized water, were added. The solution was mixed well allowed to sit for 40 min at a room temperature. After incubation, absorbance readings were taken at 415 nm at a 23 ± 1°C in a UV-Vis spectrophotometer (UV-6300PC, VWR International, Pennsylvania, USA). The total flavonoid content was calculated from a calibration curve and expressed as mg quercetin equivalent per mg of dried plant extract.
2.7. Betalain extraction & quantification
Betalain pigment was extracted following a published method (Jain et al. Citation2015) with a slight modification. A sample mass of 0.1 g was collected and kept frozen in liquid nitrogen, ground to a powder and re-suspended in 5 ml of 100% methanol and held at 4°C for 2 h. The extracts were then centrifuged at 12,000 rcf for 10 min. The supernatant was discarded and the pelleted extracts were dissolved in 5 ml of deionized water pH 5.0. Hydrochloric acid (HCl) was used to adjust the pH. Once dissolved, samples were centrifuged at 12,000 rcf for 2 min. The pigmented supernatant was collected and the absorption spectrum of the extracts was analyzed at wavelengths 300–700 nm at 23 ± 1°C in a UV-Vis Spectrophotometer (UV-6300PC, VWR International, Pennsylvania, USA). Betalain pigment content in the crude extract (CA) was determined by using the following formula ACa = A536 (MW)Va (DF)_102/ε LWa (µg/100 mg of fresh weight) developed by (Cai et al. Citation1998). For amaranthine, ε (molar absorptivity) = 5.66 × 104 cm−1 mol−1 L and MW = 726.6 (Piattelli et al. Citation1969). A536 is the absorbance at 536 nm (λmax); L (path length) = 1 cm. DF is dilution factor; Va is the total extract volume (ml); Wa is the fresh weight of the starting material (mg).
2.8. Quantitative real time polymerase chain reaction (RT-qPCR)
RT-qPCR was performed following MIQE (minimum information for publication of quantitative real-time PCR experiments) guidelines (Bustin et al. Citation2009). After 6 h of UV-B radiation, fresh leaf samples were collected in triplicates from each treatment group: RL control and treated, GL control and treated, and VIGS control and treated. The tissue samples were flash frozen in liquid nitrogen and immediately lysed into fine powder using Tissuelyser II (Qiagen, Valencia, CA, USA). The total RNA was isolated using EZ-RNA Kit (Omega Bio-tek, Inc., GA, USA) according to the manufacturer’s instructions and on-column DNAse digestion step was carried out to remove trace DNA using RNAse-Free DNAse kit (Omega Bio-tek). The total RNA was quantified using an ND-1000 Spectrophotometer (NanoDrop Technologies, Inc. Wilmington, DE, USA) and RNA quality was assessed using 1.5% agarose gel electrophoresis. First strand cDNA was synthesized using 1 µg of total RNA, qScript cDNA Synthesis Kit (Qiagen, Beverly Inc, MA, USA). Before running RT-qPCR, gene specific primers for both the internal control (β-ACTIN) and target genes (PAL1, CYP76AD1, CAB1, CAB2, RCD1) were optimized by running a gradient PCR. Using the freshly synthesized cDNA (1:6 dilution, 1.2 µl) as the PCR template, melting curves were assessed at the best annealing temperature (Tm 57°C) for the tested genes; and Cq values were maintained at 21 cycles for the internal control gene. Three biological replicates were taken from the three independent experiments and three technical replicates were included in each run. For quantification of the target genes, RT-qPCR was conducted using Perfecta Mix (QIAGEN, Beverly Inc, MA, USA) following manufacturer’s protocol and A. tricolor β-ACTIN (Atrβ-Actin) was used as the internal control. Using CFX Manager Software (BioRad), fold change in the transcript with respect to the control RL groups were calculated. Statistical significance of mean difference between the samples was analyzed by Student’s t-test in R-studio version 3.3.3 (R Core Team Citation2016) and the standard error of means was calculated using excel. All gene specific primer sequences applied in this experiment are listed in Table S1.
2.9. Selection of candidate genes
Genes related to UV-B stress response, PAL1 (ID: AT2G37040); RCD1 (ID: AT1G32230), secondary metabolites, CYP76AD1 (KR376479.1), and photosynthetic response CAB1 (ID: AT1G29930); CAB2 (ID: AT1G29920), were selected from the previously published literature (Sasaki et al. Citation2005; Jiang et al. Citation2009; Hatlestad et al. Citation2012; Morales et al. Citation2013). The gene sequences were retrieved from UniProtKB databases (www.uniprot.org/help/uniprotkb). Using an available A. tricolor transcriptome assembly from the RL variety (Matasci et al. Citation2014), BLAST searches (Altschul et al. Citation1990) were performed and candidate genes were identified considering the best match with a cutoff value smaller and closer to 0 and 50% identity or more to the query sequence. Target sequences from A. tricolor, along with the RT-qPCR primers are included in the manuscript (Table S1).
2.10. Melatonin isolation & quantification
Sample preparation was performed based on previously published protocol (Saremba et al. Citation2017; Adhikary et al. Citation2019). In brief, plant tissue samples (whole leaf) were precisely weight (50 mg) and flash frozen in liquid nitrogen and homogenized using Kontes pellet pestle (Fisher Scientific, ON, Canada) in 200 µL of 80:20 (v/v) methanol (Fisher Optima LC/MS):0.5 N trichloroacetic acid (TCA, Sigma, Mississauga, ON) in 18 mΩ E-Pure water™ (Millipore) in darkness with red light. Homogenized samples were filtered through a spin column (0.2 µm, Ultrafree-MC Millipore) 3 min at 15,000 × g, and the filtrate was analyzed using a validated UPLC- MS/MS method. Melatonin was separated in 10 μL injections by reverse phase chromatography (30 × 3 mm, 2.6 μm C18 100 Å, Phenomenex, Torrance, CA) on a Waters Acquity I-Class UPLC with column temperature 30°C. Melatonin was eluted with a gradient of 0.1% formic acid in e-pure water (Eluent A; Sigma-Alrich Canada Co., Oakville, ON) and acetonitrile (Eluent B; Fisher Optima grade) at a flow rate of 0.3 ml/min and curve 6 mixing as follows: 90% A from 0.0 to 0.5 min, 40% A at 3.5 min, 5% A at 4.2 min, 5% A at 6.5 min, 90% A at 7.0 min. For detection and quantification, Xevo TQ-S Quadrupole mass spectrometer (Waters Inc., Mississauga, ON) was used with electrospray ionization (ESI) in ES+ mode. The capillary voltage and cone voltage were set at 3.50 kV and 55.00 V, respectively with an offset of 30.0 V. The source temperature and desolvation temperature was set to 150°C and 550°C, respectively. Nitrogen was used as the cone gas (rate of 150 L/h) and desolvation gas (flow rate of 800 L/h). Argon gas (flow rate of 0.15 mL/min) was used for the collision cell. For the nebulizer gas, the flow was set to 7.00 bar. Data was obtained by MassLynx V4.1 (Waters Inc., Mississauga, ON), and processed using TargetLynx V4.1 (Waters Inc., Mississauga, ON) and exported to Microsoft Excel. Quantification of the chemical yield was performed by comparing to dilution series of standards (Sigma-Alrich Canada Co., Oakville, ON) for each compound (0, 0.001, 0.025, 0.5, 10, 200, 400, 4000 ng/mL in the homogenized solution) (Saremba et al. Citation2017; Adhikary et al. Citation2019). Since the dynamic range of the data spread over 4 orders of magnitude, data for the external standard curve underwent a LOG transformation for linearity. The Limit of Detection (LOD) was determined at ≈10 pg on column by the lowest concentration with an observed signal (>3 s/n) for all compounds. Positive signals in extracts were quantified within the linear range of 40–2000 pg on column.
3. Results
3.1. Identification of lines with contrasting betalain content
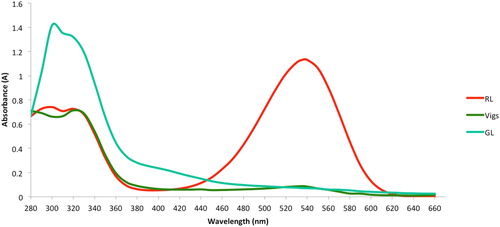
The absorbance spectra of extracts were analysed from the Red Leaf (RL) variety of A. tricolor, as well as from green tissues of VIGS-treated (VIGS) plants of the same variety, and finally from the independent Green Leaf (GL) variety of the same species. In this experimental condition, the VIGS plants had the advantage of being nearly isogenic to the RL plants, whereas the GL plants were less closely related to RL. On the other hand, the VIGS treatment could have residual effects on stress responses. Therefore, both GL and VIGS lines were used for comparison to RL (). Consistent with its intense red appearance, RL extracts showed an absorbance peak at ∼536 nm, which is near the published maximum of 535 nm that is characteristic of the betacyanin compound, amaranthine (). In contrast, both the VIGS and GL showed no absorbance peak at 536 nm. None of the lines () tested showed detectable absorbance peaks in the range of the yellow betaxanthins (470 nm), although in the case of RL, a small amount of absorbance in this range could have been masked by the shoulder of the broad betacyanin peak. Although GL and VIGS were very similar in the visible spectrum, for unknown reasons, GL had much higher absorbance than either of the other two lines in the 300–340 nm range. RL can therefore be contrasted in terms of betalain content, with both GL and VIGS.
Figure 1. A. tricolor leaves. Using VIGS, isogenic lines were developed by silencing CYP76AD1 gene. (A) Uninoculated group represents the Red leaf (control group) in a normal condition; (B) TRV1/TRV2-CYP76AD1 represents the green VIGS phenotype developed by silencing CYP76AD1; (C) TRV1/TRV1-Empty represents the plants that are inoculated with an empty vector without the target gene; (D) Wildtype Green leaf represents green A. tricolor grown in a normal environment.
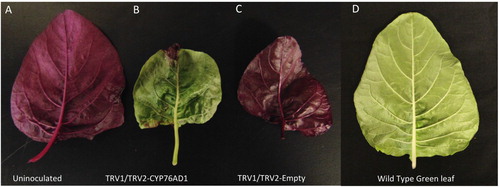
Figure 2. Assessment of isogenic lines using UV-Vis spectrophotometric absorption reading. Extracts of CYP76AD1 silenced green VIGS phenotypic leaf (Vigs), normal red leaf (RL), and normal green leaf (GL) were subjected for absorption reading between 280 and 660 nm.
3.2. UV-B radiation and transcript expression
PAL1 and RCD1 are well-established transcriptional markers of UV-B stress (Chappell and Hahlbrock Citation1984; Jiang et al. Citation2009; Żurek et al. Citation2011). UV-B radiation induced a high accumulation of PAL1 and RCD1 transcripts in all lines (RL, VIGS, GL); (A,B). In contrast, UV-B treatment induced significant reduction of CAB1 and CAB2 transcripts in all three lines (C,D). Furthermore, CAB1 and CAB2 showed no significant difference between the means of RL-treated and isogenic VIGS lines; however, they were significantly different from the GL-treated group.
Figure 3. Quantification of genes that are related to UVR marker genes (A and B), chlorophyll binding proteins (C and D), and betalain pigments (E). Bars represent the mean (n = 3) and error bars represent the standard errors of mean. The different letters indicate that the mean difference between the control and the treated groups are statistically significant at the significance level of p-value = 0.05. * Indicates either the means of Vigs-treated or GL-treated group are not significantly different from the RL-treated group, ** indicates the mean is statistically significant from the means of RL-treated group.
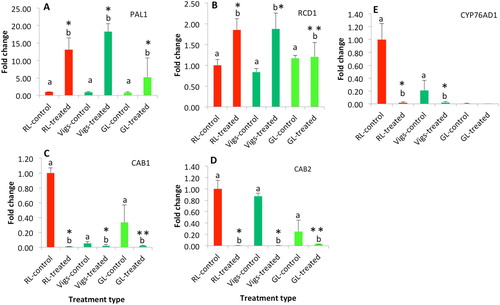
Transcript abundance of the cytochrome P450 gene CYP76AD1 was measured as this gene is required for betalain synthesis, especially the red betacyanins that are abundant in the RL variety. This is also the target of the silencing protocol that produced the VIGS line used in these experiments. As expected, in untreated tissues, CYP76AD1 transcript abundance was much lower in VIGS than RL (E). Moreover, CYP76AD1 transcript abundance was also lower in GL than RL, suggesting that the green phenotype in GL is due to a nearly complete loss of CYP76AD1 gene expression. Following UV-B irradiation, CYP76AD1 transcript expression decreased significantly in both RL and VIGS (it was already near the limit of detection in GL, so no further decrease could be detected) (E). Thus, there was no evidence that CYP76AD1 transcript expression increased as a result of UV-B exposure, as might be expected if betalain (specifically betacyanin) production were to be induced in response to UV-B.
3.3. Photosynthetic pigments and gas exchange
Under short term, high UV-B irradiation (0.80 Wm−2) (), the photosynthetic pigments (chlorophyll a, b, and carotenoids) significantly increased in the RL groups by 16.4%, 58.6%, and 14.6%, respectively (). On the contrary, the other two groups (GL, VIGS) showed a decrease in all three pigments; the mean decrement was significant for chlorophyll b in VIGS and GL group, while for carotenoids, a significant mean difference was detected only in the GL group (). Further, the means between the UV-treated groups were compared, chlorophyll a showed no significant difference between the mean of RL-treated groups with the two other treated groups. However, for chlorophyll b, the mean was significantly different from the other two treated groups; and for the carotenoids, the mean was significantly different from the GL-treated group ().
Figure 4. Schematic diagram showing UV-B stress treatment. Control samples were not exposed to UV-B, represented by the solid yellow background from 0 to 16 h while the grid lines represent 6 h UV-B treatment at high fluency (0.8 Wm−2), and the triangular block represents the infrared gas analyzer (IRGA) measurements period.
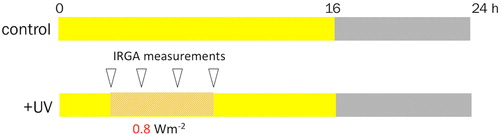
Table 1. Photosynthetic pigments, carotenoids, chlorophyll a, and chlorophyll b, in A. tricolor GL, RL, and VIGS before and after UV-B treatment.
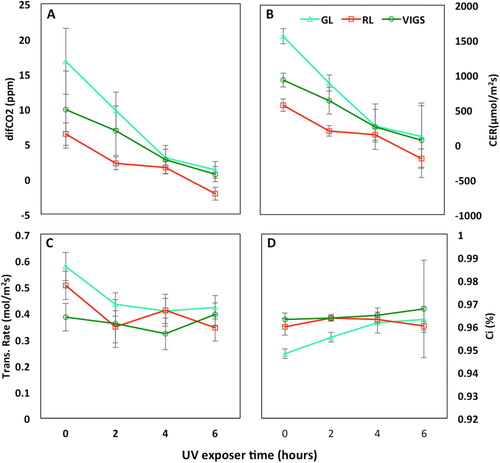
Phenotypically, after 6 h of exposure, photobleaching spots were observed on the abaxial leaf surfaces (Figure S2). Red leaf appeared dull and slight discoloration of the betacyanin pigment; similarly, the Vigs and Green leaf produced slight bleached leaf spots giving light green pigmentation on the leaf surface. The impact of UV-B irradiation on photosynthesis was assessed measuring carbon exchange rate (CER), differential CO2 (diffCO2), intercellular CO2 concentration (Ci), and transpiration rate (Trans.Rate). In all three groups (RL, GL, and VIGS), a similar pattern was observed, namely: diffCO2 and CER decreased steadily across all time points; transpiration decreased until 4 h and slightly increased; and Ci steadily increased (). These patterns were consistent across three replicate experiments.
Figure 5. Photosynthetic response of A. tricolor (GL) & A. tricolor (RL) at 2 h interval of UV-B exposure, before the treatment (0 h) and after the treatment (2, 4, 6 h). This is the reading based on measurement on the adaxial portion of the leaf. (A) shows the differential CO2 (diffCO2), (B) shows carbon exchange rate (CER), (C) shows transpiration rate (Trans.Rate), and (D) shows intercellular carbon dioxide (Ci). Error bars represent the standard error of mean (n = 5).
3.4. UV-B protective metabolites
Flavonoids, total phenolics, betalains, and melatonin have all been previously identified as potential plant responses to UV-B, in one or more species (Jordan et al. Citation1991; Ibdah et al. Citation2002; Afreen et al. Citation2006; Kaur et al. Citation2015; Klein et al. Citation2018). In this experiment flavonoid and melatonin accumulated in response to UV-B (). Melatonin increased following UV-B treatment by 74.8%, 79.1%, and 39.6% in RL, VIGS, and GL groups, respectively. For flavonoids, the UV-B responsive increase was 18.2%, 19.9%, and 18.2% for RL, VIGS, and GL group, respectively (). For total phenolics, the mean differences were not significant between any control and UV-B treated group, nor were there significant differences between the groups. Betalain pigment was only slightly increased and the mean differences was significant at the significant level, p-value<0.1 ().
Table 2. UV-B protective compound, melatonin, flavonoids, total phenolics, and betalains (putative) in A. tricolor GL, RL, and VIGS before and after UV-B treatment.
4. Discussion
To investigate a possible role for betalains, especially the red betalain (betacyanin), in protecting plants from UV-B irradiation, two cultivars of A. tricolor, named Red Leaf (RL) and Green Leaf (GL) were obtained and used virus-induced gene silencing to produce isogenic derivatives of RL in which visible red pigments had been essentially eliminated (Adhikary et al. Citation2019; ). Spectral analysis of extracts from these three lines showed that RL had a strong absorbance peak at 536 nm, consistent with the presence of abundant betacyanin (). GL and VIGS showed no detectable absorbance peak in this region. None of the three lines had detectable absorbance peaks at 470 nm, indicating a lack of detectable betaxanthin, although a small 470 nm peak in RL could possibly be hidden in the shoulder of the betacyanin peak. Analysis of transcripts by RT-qPCR showed that both GL and VIGS had significant reductions in the expression of CYP76AD1, which catalyzes the conversion of L-DOPA to cylco-DOPA, one of the two precursors of betacyanin (E; Hatlestad et al. Citation2012). CYP76AD1 may also be partially responsible for the conversion of Tyr to L-DOPA, which is a precursor of both betacyanins and betaxanthins (Hatlestad et al. Citation2012; Sunnadeniya et al. Citation2016). In any case, it is clear that the GL and VIGS lines were effectively devoid of detectable betalains of any type, likely due to an absence of functional CYP76AD1 in both cases.
To test whether the presence of betalains could mitigate the effects of UV-B treatment, RL, GL, and VIGS plants were exposed to UV-B radiation (0.80 Wm−2, peak emission 306 nm, 6 h duration) (). With one exception, regardless of betalain content, all lines tested had largely similar responses to UV-B consistent with previously described indicators of UV-B stress, namely: increased abundance of transcripts for PAL1 and RCD1 (Chappell and Hahlbrock Citation1984; Kalbin et al. Citation2001; Ryan et al. Citation2002; Cantarello et al. Citation2005; Jiang et al. Citation2009; Żurek et al. Citation2011), decreased transcript abundance of CHLOROPHYLL A/B BINDING PROTEIN CAB1 (ID: AT1G29930) and CAB2 (ID: AT1G29920) (Jordan et al. Citation1991; Mackerness et al. Citation1997), decreased photosynthetic rate (Brandle et al. Citation1977; Hollósy Citation2002; Xu et al. Citation2010) and increased accumulation of melatonin and flavonoids (Tan et al. Citation2000; Hollósy Citation2002; Ibdah et al. Citation2002; Afreen et al. Citation2006).
This is the first report of endogenous melatonin in amaranths and the first indication of a melatonin-mediated stress response to UV-B exposure in the species. Research in other plant species has demonstrated that melatonin improves plant cell tolerance of cold, heat, drought, salt, metal and other environmental stresses including full spectrum light and UV-B (Erland et al. Citation2017; Wang et al. Citation2018). In Chara australus, melatonin protected photosynthetic apparatus from damaging high-light and increased quantum yield of PSII by 34% (Lazar et al. Citation2013). At lower exposure levels, UV is a useful signal to indicate the direction of sunlight; and melatonin has also been hypothesized to mediate this light sensing process, possibly through COP 1 and 9 receptors, via interaction with the UV-B receptor UVR8 (Sanchez-Barcelo et al. Citation2016). Interestingly, as the chromophore of UVR8 comprises several conserved tryptophan residues, this suggests a potential link to melatonin, though this idea has yet to be fully investigated (Jenkins Citation2009; Lee Citation2016).
The only notable difference that was observed between red-pigmented (RL) and green-pigmented (VIGS, GL) plants following UV-B treatment was the effect on photosynthetic pigments: chlorophyll a, chlorophyll b, and carotenoids (). Carotenoids are believed to be efficient quenchers of high energy shortwave radiation (Middleton and Teramura Citation1993), and as antioxidants that minimize the impact of radicals in photosynthetic membranes (Götz et al. Citation1999). However, according to reports over the past decades, the effects of UV-B radiation on photosynthetic pigments (chlorophyll a, chlorophyll b, and carotenoids) can vary broadly. In studies with green alga Chlorococcum infusionum and Chlorogonium elongatum, or desert plants Malva parviflora, Plantago major, Rumex vesicarius, and Sismbrium erysimoids, pigments decreased following UV-B treatment (Agrawal Citation1992; Salama et al. Citation2011), whereas in Populus cathayana, Populus trichocarpa, and Glycine max, pigments increased (Middleton and Teramura Citation1993; Warren et al. Citation2002; Xu et al. Citation2010). It was found that UV-B radiation increased photosynthetic pigment abundance in RL plants but decreased abundance of one or more pigments in VIGS and GL plants (). It is unclear why the RL plants would respond oppositely to the VIGS and GL plants in terms of pigment production, when all other physiological responses appeared generally similar. Perhaps the betalains filter visible wavelengths that are somehow inhibitory to the production of photosynthetic pigments under UV-B stress.
The cytochrome P450 CYP76AD1 catalyzes the only enzymatic reaction specific to the production of betacyanin from the colorless precursor L-DOPA (Hatlestad et al. Citation2012; Casique-Arroyo et al. Citation2014; Polturak et al. Citation2016). If betacyanins were photoprotective, it might be expected that CYP76AD1 transcripts would increase following UV-B treatment. However, the CYP76AD1 transcripts was decreased in both RL and VIGS plants, and CYP76AD1 transcripts in GL plants were already near the limit of detection, even before UV treatment (E). Furthermore, when betacyanin concentration was measured, there was no statistically significant difference in untreated plants as compared to UV-treated plants (). Thus, there is no evidence that betacyanins are induced, either at the transcript level, or at the metabolite level, by short term acute UV-B stress. Although it is possible that under different treatment parameters (e.g. longer duration of UV-B, lower flux, different genotypes, at different growth stage), it was noted that the duration of the experiment that was conducted was sufficient for the observation of clear changes in abundance of other metabolites ().
5. Conclusion
The results showed that the short term, high fluence UV-B treatments induced physiological, transcriptional, and biochemical changes in A. tricolor consistent with those previously described in other species. The responses observed were generally similar for both high-betacyanin (RL) plants, and green plants (VIGS, GL), from which it was concluded that betacyanin does not seem to be UV-B protective, at least under the experimental conditions. This conclusion is supported by the observation that betacyanins were not induced by UV-B treatment, even though known protective secondary metabolites such as melatonin increased substantially following UV-B treatment. For reasons not yet understood, photosynthetic pigments increased exclusively in the betalainic RL plants, following the UV-B treatment. Although the function of betalains has been presumably similar to anthocyanins, attractive colors on the leaf, stem, and flower might contribute in attracting pollinators and seed dispersers. This is the first study exploring the impact of short term high fluence UV-B radiations on betalainc plants in a controlled condition. More studies on different betalainic species is yet to be investigated to confirm the protective role of betalains against UV-B across different species.
Supplemental Material
Download MS Word (436.1 KB)Acknowledgements
We would like to thank Upama Khatri-Chhetri and Joel Murga for their support in laboratory experiments. DA and MKD conceived and designed the experiments. MKD and SJM supervised and generated resources for the project. DA carried out the experiments. JF and SJM performed the phytochemical analysis. DA and MKD performed the data analysis. DA wrote the manuscript and all authors provided editorial advice. All authors read and approved the final manuscript.
Disclosure statement
No potential conflict of interest was reported by the author(s).
Additional information
Funding
Notes on contributors
Dinesh Adhikary
Dinesh Adhikary, Postdoctoral Researcher, University of British Columbia.
Jillian A. Forsyth
Jillian A. Forsyth, Graduate Student, University of British Columbia.
Susan J. Murch
Susan J. Murch, Professor, University of British Columbia.
Michael K. Deyholos
Michael K. Deyholos, Professor, University of British Columbia.
References
- Adhikary D, Khatri-Chhetri U, Tymm FJ, Murch SJ, Deyholos MK. 2019. Virus induced gene-silencing (VIGS) system for functional genomics in betalainic species, Amaranthus tricolor. Appl Plant Sci. 7:e1221.
- Afreen F, Zobayed SMA, Kozai T. 2006. Melatonin in Glycyrrhiza uralensis: response of plant roots to spectral quality of light and UV-B radiation. J Pineal Res. 41:108–115.
- Agrawal SB. 1992. Effects of supplemental U.V.-B radiation on photosynthetic pigment, protein and glutathione contents in green algae. Environ Exper Bot. 32:137–143.
- Altschul SF, Gish W, Miller W, Myers EW, Lipman DJ. 1990. Basic local alignment search tool. J Mol Biol. 215:403–410.
- Brandle JR, Campbell WF, Sisson WB, Caldwell MM. 1977. Net photosynthesis, electron transport capacity, and ultrastructure of Pisum sativum L. exposed to ultraviolet-B radiation. Plant Physiol. 60:165–169.
- Burger J, Edwards GE. 1996. Photosynthetic efficiency, and photodamage by UV and visible radiation, in red versus green leaf coleus varieties. Plant Cell Physiol. 37:395–399.
- Bustin SA, Benes V, Garson JA, Hellemans J, Huggett J, Kubista M, Mueller R, Nolan T, Pfaffl MW, Shipley GL, et al. 2009. The MIQE guidelines: minimum information for publication of quantitative real-time PCR experiments. Clin Chem. 55:611–622.
- Cabrol NA, Feister U, Hader DP, Piazena H, Grin EA, Klein A. 2014. Record solar UV irradiance in the tropical Andes. Front Environ Sci. 2:00019. doi:10.3389/fenvs.2014.00019.
- Cai Y, Sun M, Corke H. 2003. Antioxidant activity of betalains from plants of the amaranthaceae. J Agri Food Chem. 51:2288–2294.
- Cai Y, Sun M, Wu H, Huang R, Corke H. 1998. Characterization and quantification of betacyanin pigments from diverse Amaranthus species. J Agri Food Chem. 46:2063–2070.
- Cantarello C, Volpe V, Azzolin C, Bertea C. 2005. Modulation of enzyme activities and expression of genes related to primary and secondary metabolism in response to UV-B stress in cucumber (Cucumis sativus L.). J Plant Interact. 1:151–161.
- Casique-Arroyo G, Martínez-Gallardo N, De La Vara LG, Délano-Frier JP. 2014. Betacyanin biosynthetic genes and enzymes are differentially induced by (a)biotic stress in Amaranthus hypochondriacus. PLoS ONE. 9:19–22.
- Chappell J, Hahlbrock K. 1984. Transcription of plant defence genes in response to UV light or fungal elicitor. Nature. 311:76–78.
- Core Team R. 2016. R: A language and environment for statistical computing, version 3.3.3. Vienna (Austria): R Foundation for Statistical Computing.
- Deladino L, Alvarez I, de Ancos B, Sánchez-Moreno C, Molina-García AD, Teixeira AS. 2017. Betalains and phenolic compounds of leaves and stems of Alternanthera brasiliana and Alternanthera tenella. Food Res Int. 97:240–249.
- Delucia EH, Day TA, Vogelman TC. 1992. Ultraviolet-B and visible light penetration into needles of two species of subalpine conifers during foliar development. Plant Cell Environ. 15:921–929.
- Erland LAE, Saxena PK, Murch SJ. 2017. Melatonin in plant signaling and behavior. Func Plant Biol. 45:58–69.
- Folin O, Ciocalteau V. 1927. On tyrosine and tryptophane determinations in proteins. J Biol Chem. 73:627–650.
- Frohnmeyer H. 2003. Ultraviolet-B radiation-mediated responses in plants. Balancing damage and protection. Plant Physiol. 133:1420–1428.
- Girod PA, Zryd JP. 1987. Clonal variability and light induction of betalain synthesis in red beet cell cultures. Plant Cell Rep. 6:27–30.
- Götz T, Windhövel U, Böger P, Sandmann G. 1999. Protection of photosynthesis against ultraviolet-B radiation by carotenoids in transformants of the cyanobacterium Synechococcus PCC7942. Plant Physiol. 120:599–604.
- Gould KS. 2004. Nature’s Swiss army knife: the diverse protective roles of anthocyanins in leaves. J Biomed Biotechnol. 2004:314–320.
- Hardeland R. 2005. Antioxidative protection by melatonin: multiplicity of mechanisms from radical detoxification to radical Avoidance. Endocrine. 27:119–130.
- Hatlestad GJ, Sunnadeniya RM, Akhavan N, Gonzalez A, Goldman IL, McGrath JM, Lloyd AM. 2012. The beet R locus encodes a new cytochrome P450 required for red betalain production. Nat Genet. 44:816–820.
- Hiscox JD, Israelstam GF. 1978. A method for the extraction of chlorophyll from leaf tissue without maceration. Can J Bot. 283:774–783.
- Hollósy F. 2002. Effects of ultraviolet radiation on plant cells. Micron. 33:179–197.
- Ibdah M, Krins A, Seidlitz HK, Heller W, Strack D, Vogt T. 2002. Spectral dependence of flavonol and betacyanin accumulation in Mesembryanthemum crystallinum under enhanced ultraviolet radiation. Plant Cell Environ. 25:1145–1154.
- Jain G, Gould KS. 2015. Are betalain pigments the functional homologues of anthocyanins in plants? Environ Exper Bot. 119:48–53.
- Jain G, Schwinn KE, Gould KS. 2015. Betalain induction by l-DOPA application confers photoprotection to saline-exposed leaves of Disphyma australe. New Phyto. 207:1075–1083.
- Jansen MA, Gaba V, Greenberg BM. 1998. Higher plants and UV-B radiation: balancing damage, repair and acclimation. Trends Plant Sci. 3:131–135.
- Jenkins GI. 2009. Signal transduction in responses to UV-B radiation. Ann Rev Plant Biol. 60:407–431.
- Jiang L, Wang Y, Bjorn LO, Li S. 2009. Arabidopsis radical-induced cell death1 is involved in UV-B signaling. Photochem Photobiol Sci. 8:838–846.
- Jordan BR, Chow WS, Strid A, Anderson JM. 1991. Reduction in cab and psb A RNA transcripts supplementary in response to radiation. FEBS Let. 284:5–8.
- Kalbin G, Hidema J, Brosche M, Kumagai T, Bornman JF, Strid A. 2001. UV-B-induced DNA damage and expression of defence genes under UV-B stress: tissue-specific molecular marker analysis in leaves. Plant Cell Environ. 24:983–990.
- Karamac M, Gai F, Longato E, Meineri G, Janiak MA, Amarowicz R, Peiretti PG. 2019. Antioxidant activity and phenolic composition of amaranth (Amaranthus caudatus) during plant growth. Antioxidants. 6:173.
- Kataria S, Jajoo A, Guruprasad KN. 2014. Impact of increasing ultraviolet-B (UV-B) radiation on photosynthetic processes. J Photochem Photobiol B. 137:55–66.
- Kaur C, Kapoor HC. 2002. Antioxidant activity and total phenolic content of some Asian vegetables. Int J Food Sci Technol. 37:153–161.
- Kaur H, Mukherjee S, Baluska F, Bhatla SC. 2015. Regulatory roles of serotonin and melatonin in abiotic stress tolerance in plants. Plant Signal Behav. 10:e1049788.
- Kishima Y, Nozaki K, Akashi R, Adachi T. 1991. Light-inducible pigmentation in Portulaca callus; selection of a high betalain producing cell line. Plant Cell Rep. 10:304–307.
- Klein FRS, Reis A, Kleinowski AM, Telles RT, Amarante LD, Peters JA, Braga EJB. 2018. UV-B radiation as an elicitor of secondary metabolite production in plants of the genus Alternanthera. Acta Bot Bras. 32:615–623.
- Lazar D, Murch SJ, Beilby MJ, Khazaaly SA. 2013. Exogenous melatonin affects photosynthesis in characeae Chara australis. Plant Signal Behav. 8:e23279.
- Lee JH. 2016. UV-B signal transduction pathway in Arabidopsis. J Plant Biol. 59:223–230.
- Lister CE, Lancaster JE, Walker JRL. 1996. Phenylalanine ammonia-lyase (PAL) activity and its relationship to anthocyanin and flavonoid levels in New Zealand-grown apple cultivars. J Am Soc Hortic Sci. 121:281–285.
- Mackerness SA, Thomas B, Jordan BR. 1997. The effect of supplementary ultraviolet-B radiation on mRNA transcripts, translation and stability of chloroplast proteins and pigment formation in Pisum sativum L. J Exp Bot. 48:729–738.
- Matasci N, Hung LH, Yan Z, Carpenter EJ, Wickett NJ, Mirarab S, Nguyen N, Warnow T, Ayyampalayam S, Barker M, et al. 2014. Data access for the 1000 plants (1KP) project. Gigascience. 3:1–10.
- Middleton EM, Teramura AH. 1993. The role of flavonol glycosides and carotenoids in protecting soybean from ultraviolet-B damage. Plant Physiol. 103:741–752.
- Morales LO, Brosche M, Vainonen J, Jenkins GI, Wargent JJ, Sipari N, Strid A, Lindfors AV, Tegelberg R, Aphalo PJ. 2013. Multiple roles for UV resistance locus8 in regulating gene expression and metabolite accumulation in Arabidopsis under solar ultraviolet radiation. Plant Physiol. 161:744–759.
- Morales LO, Tegelberg R, Brosché M, Keinänen M, Lindfors A, Aphalo PJ. 2010. Effects of solar UV-A and UV-B radiation on gene expression and phenolic accumulation in Betula pendula leaves. Tree Physiol. 30:923–934.
- Nakashima T, Araki T, Ueno O. 2011. Photoprotective function of betacyanin in leaves of Amaranthus cruentus L. under water stress. Photosynthetica. 49:497–506.
- Nogués S, Allen DJ, Morison JIL, Baker NR. 1998. Ultraviolet-B radiation effects on water relations, leaf development, and photosynthesis in droughted pea plants. Plant Physiol. 117:173–181.
- Nogués S, Allen DJ, Morison JIL, Baker NR. 1999. Characterization of stomatal closure caused by ultraviolet-B radiation. Plant Physiol. 121:489–496.
- Piattelli M, Nicola MGD, Castrogiovanni V. 1969. Photocontrol of Amaranthin synthesis in Amaranthus tricolor. Phytochemistry. 8:731–736.
- Polturak G, Breitel D, Grossman N, Sarrion-Perdigones A, Weithorn E, Pliner M, Orzaez D, Granell A, Rogachev I, Aharoni A. 2016. Elucidation of the first committed step in betalain biosynthesis enables the heterologous engineering of betalain pigments in plants. New Phytol. 210:269–283.
- Rozema J, Blokker P, Mayoral Fuertes MA, Broekman R. 2009. UV-B absorbing compounds in present-day and fossil pollen, spores, cuticles, seed coats and wood: evaluation of a proxy for solar UV radiation. Photoch Photobio Sci. 8:1233.
- Ryan KG, Swinny EE, Markham KR, Winefield C. 2002. Flavonoid gene expression and UV photoprotection in transgenic and mutant Petunia leaves. Phytochemistry. 59:23–32.
- Salama HMH, Watban AAA, Al-fughom AT. 2011. Effect of ultraviolet radiation on chlorophyll, carotenoid, protein and proline contents of some annual desert plants. Saudi J Biol Sci. 18:79–86.
- Sanchez-Barcelo EJ, Mediavilla MD, Vriend J, Reiter RJ. 2016. Constituitive photomorphogenesis protein 1 (COP1) and COP9 signalosome, evolutionarily conserved photomorphogenic proteins as possible targets of melatonin. J Pineal Res. 61:41–51.
- Saremba BM, Tymm FJM, Baethke K, Rheault MR, Sherif M, Saxena PK, Murch SJ. 2017. Plant signals during beetle (Scolytus multistriatus) feeding in American elm (Ulmus americana Planch). Plant Signal Behav. 12:1–11.
- Sasaki N, Wada K, Koda T, Kasahara K, Adachi T, Ozeki Y. 2005. Isolation and characterization of cDNAs encoding an enzyme with glucosyltransferase activity for cyclo-DOPA from four o’clocks and feather cockscombs. Plant Cell Physiol. 46:666–670.
- Sen S, De B, Devanna N, Chakraborty R. 2013. Total phenolic, total flavonoid content, and antioxidant capacity of the leaves of Meyna spinosa Roxb., an Indian medicinal plant. Chin J Nat Med. 11:149–157.
- Singleton VL, Rossi JA. 1965. Colorimetry of total phenolics with phosphomolybdic-phosphotungstic acid reagents. Am J Enol Viticul. 16:144–158.
- Sumanta N, Haque CI, Nishika J, Suprakash R. 2014. Spectrophotometric analysis of chlorophylls and carotenoids from commonly grown fern species by using various extracting solvents. J Chemical Sci. 4:63–69.
- Sunnadeniya R, Bean A, Brown M, Akhavan N, Hatlestad G, Gonzalez A, Symonds VV, Lloyd A. 2016. Tyrosine hydroxylation in betalain pigment biosynthesis is performed by cytochrome P450 enzymes in beets (Beta vulgaris). PLoS ONE. 11:e0149417.
- Sztatelman O, Grzyb J, Gabry H, Katarzyna A. 2015. The effect of UV-B on Arabidopsis leaves depends on light conditions after treatment. BMC Plant Biol. 15:281.
- Tan DX, Chen LD, Poeggeler B, Manchester LC, Reiter RJ. 1993. Melatonin: a potent, endogenous hydroxyl radical scavenger. Endocrine. 1:57–60.
- Tan DX, Manchester LC, Reiter RJ, Plummer BF, Limson J, Weintraub ST, Qi W. 2000. Melatonin directly scavenges hydrogen peroxide: a potentially new metabolic pathway of melatonin biotransformation. Free Radic Biol Med. 29:1177–1185.
- Tevini M, Iwanzik W, Thoma U. 1981. Some effects of enhanced UV-B irradiation on the growth and composition of plants. Planta. 153:388–394.
- Ulm R, Baumann A, Oravecz A. 2004. Genome-wide analysis of gene expression reveals function of the bZIP transcription factor HY5 in the UV-B response of Arabidopsis. Proc Natl Acad Sci U S A. 101:1397–1402.
- Wang Y, Reiter RJ, Chan Z. 2018. Phytomelatonin: a universal abiotic stress regulator. J Exp Bot. 69:963–974.
- Warren JM, Bassman JH, Eigenbrode S. 2002. Leaf chemical changes induced in Populus trichocarpa by enhanced UV-B radiation and concomitant effects on herbivory by Chrysomela scripta (Coleoptera: Chrysomelidae). Tree Physiol. 22:1137–1146.
- Xu X, Zhao H, Zhang X, Hänninen H, Korpelainen H, Li C. 2010. Different growth sensitivity to enhanced UV-B radiation between male and female Populus cathayana. Tree Physiol. 30:1489–1498.
- Yokawa K, Kagenishi T, Baluška F. 2016. UV-B induced generation of reactive oxygen species promotes formation of BFA-induced compartments in cells of Arabidopsis root apices. Front Plant Sci. 6:1162. doi:10.3389/fpls.2015.01162.
- Zhang XR, Chen Y-H, Guo QS, Wang WM, Liu L, Fan J, Cao LP, Li C. 2017. Short-term UV-B radiation effects on morphology, physiological traits and accumulation of bioactive compounds in Prunella vulgaris L. J Plant Interact. 12:348–354.
- Zuk-Golaszewska K, Upadhyaya MK, Golaszewski J. 2011. The effect of UV-B radiation on plant growth and development. Plant Soil Environ. 49:135–140.
- Żurek JZ, Kozłowska M, Nuc K. 2011. Phenylalanine ammonia lyase under combined effects of enhanced UV-B radiation and allelopathy stress. ACTA Biol Cracov Bot. 53:73–78.