
 ?Mathematical formulae have been encoded as MathML and are displayed in this HTML version using MathJax in order to improve their display. Uncheck the box to turn MathJax off. This feature requires Javascript. Click on a formula to zoom.
ABSTRACT
Interactions between plants are complicated: they can change resource availability, the proportion of resources acquired and the efficiency of resource use. This can eventually lead to changes in stand yield, but the driving mechanisms remain controversial. This study aimed to clarify the effects of mixing on stand yield. We established 120 mixed and pure plots of Chinese pine (Pinus tabulaeformis) and Liaodong oak (Quercus liaotungensis) in the Loess Plateau, China. Based on the inventory data in 2009 and 2016, we compared the differences in yields between mixed and pure stands. Our results indicated that the mixing of pine and oak resulted in over-yielding, but there was no transgressive over-yielding and pure pine stands consistently produced the highest yields. The over-yielding was due to facilitation between pine and oak, especially the improvement of light conditions in the understory, and an increase in the light use-efficiency of young pine and the availability of light to young oak. Mixing did not reduce competition: pine was dominant in interspecific competition and inhibited the growth of oak. The mixing effect was affected by site quality and stand density: improvements in site quality reduced over-yielding, while increases in stand density increased over-yielding.
1. Introduction
There has been increasing interest in tree species mixtures, as they can provide substantial ecological benefits (Gamfeldt et al. Citation2013; Bravo-Oviedo et al. Citation2014). However, in comparison with the ecological benefits of mixing, there is no consensus on the effect of mixing on tree growth and stand yields (Kelty and Cameron Citation1995; Frivold and Frank Citation2002; Pretzsch Citation2005; Kelty Citation2006; Piotto Citation2008; Weiner and Freckleton Citation2010; Vila et al. Citation2013; Forrester Citation2014; Bauhus et al. Citation2018).
In forests, tree growth depends on resource availability, the proportion of resources acquired and resource use efficiency. Each of these variables can be influenced by neighborhood interactions, which include negative and positive interactions. Competition is one of the major negative interactions: neighboring trees compete for resources, such as water, light and nutrition, and the competitive capacity determines the proportion of resources that are acquired. If resources are allocated according to the size of the individuals, then the type of competition is referred to as symmetric competition. However, sometimes resources are not allocated according to the size of the individuals, and larger individuals have a disproportionate advantage in competition with smaller individuals, this is asymmetric competition. No matter what mode of competition is present, eventually, neighborhood competition negatively influences the growth of trees (Begon et al. Citation1986). However, living in association with neighbors may also have advantages over solitary growth. For example, neighbors may protect individuals against windthrow (Griess and Knoke Citation2011), improve soil conditions (Augusto et al. Citation2002) or prevent nearest neighbors from being subject to bark scorch or drought (Assmann Citation1970; Pretzsch and Dieler Citation2012). Therefore, interactions between individuals can improve resource availability, increase resource use efficiency and promote viability. These positive interactions are called facilitation (Vandermeer Citation1992). Compared with pure forests, in mixed forests, there are both intraspecific and interspecific interactions. Differences in competition and facilitation between interspecific and intraspecific interactions determine differences in individual growth in mixed and pure stands and eventually lead to over-yielding or under-yielding in mixed stands (Riofrio et al. Citation2016).
In mixed stands, each species occupies a different niche and utilizes different resources. When niches are complementary between different species, competition is reduced, which leads to higher resource availability or higher resource use efficiency (Kelty Citation1992). An example of this is increases in light availability when the different species have crowns with complementary shapes that fit together more efficiently in mixtures than in monocultures (Bauhus et al. Citation2004). Also, if a fast-growing species with high light use efficiency (LUE) overtops a slower-growing and more shade-tolerant species that is capable of efficiently using diffuse light, then the mixtures could have a greater LUE (Forrester Citation2014). However, if species niches overlap or are not complementary, the intensity of interspecific competition will not be significantly less than intraspecific competition (Rosenfeld Citation2002), and under intense interspecific competition, the growth of the less competitive species will be inhibited. If the intraspecific competition is asymmetric, less competitive species may even be eliminated (Bristow et al. Citation2006), and the yields of mixed stands also decrease.
Mixed forests could also express better facilitative processes in some stands, including symbiotic nitrogen fixation (Forrester et al. Citation2006), hydraulic lift (Zapater et al. Citation2011) and improved environmental conditions (Langvall Citation2011). Some of these intraspecific interactions may increase resource availability, acquisition and use efficiency, accelerate the growth of trees and improve the yields of stands. In contrast, not all species mixtures express facilitation, and some mixtures could damage the living environment of other species (Halty et al. Citation2017).
The interspecific interactions between a given pair of species are dynamic, and they can be moderated by site quality (Huber et al. Citation2014), climate (Manso et al. Citation2015), stand density (Condes et al. Citation2013) or species assemblage (Toigo et al. Citation2015), which can also affect growth (Richards and Schmidt Citation2010; Forrester and Albrecht Citation2014), yield (Pretzsch et al. Citation2016) and mortality (Condes and del Rio Citation2015). Among these, site quality is the primary factor influencing interspecific relationships. As an index to evaluate the soil yield potential of forests, site quality reflects the availability of soil nutrients and water (Barnes et al. Citation1982). Even if facilitation or competition reduction between a given pair of species does exist, it could only be beneficial for some resources (e.g. nutrition), and if these resources (e.g. nutrition) are favorable, then facilitation or competition reduction will not necessarily lead to over-yielding (Pretzsch et al. Citation2010). In other words, interspecific interactions that release the limitations of soil nutrition and water could positively influence tree growth and stand yields under low-quality sites. However, this influence is weakened in high-quality sites whereas light availability becomes most important factor instead of soil nutrition and water (Pretzsch and Biber Citation2010; Forrester et al. Citation2013). In addition to being affected by site quality, interspecific relationships are also affected by stand density in mixed forests (Pretzsch et al. Citation2013). Stand density is a critical factor in interspecific relationships because many competitive events are less important or disappear altogether when densities are not optimal (Kelty and Cameron Citation1995; Amoroso and Turnblom Citation2006). At low densities, the interactions between species, including facilitation and interspecific competition, are reduced, and therefore the influence of mixing on tree growth and stand yields, both positive and negative, is decreased. However, at high densities, since competition is intense, the competition reduced caused by niche complementarity would make greater influence on yields.
Liaodong oak (Quercus liaotungensis) and Chinese pine (Pinus tabulaeformis) are widely distributed in northern China (Zhao and Zhou Citation2006; Wang and Zhang Citation2011), and both tree species have important ecological functions, such as soil and water conservation and carbon sequestration (Guo et al. Citation2008; Cao et al. Citation2012; Song et al. Citation2016). In addition, Chinese pine is also an important timber species. Because the two species have similar requirements for light, temperature and soil moisture, their natural distribution often overlaps and forms natural mixed forests. In the Loess Plateau, the Chinese pine (pine)-Liaodong oak (oak) mixed forest is a major forest type. After long-term overutilization in the last century, the forest ecosystem on the Loess Plateau has been degraded, causing a weakening of forest ecological functions and more natural disasters. To restore the forest ecosystem, the Chinese government enacted the Natural Forest Protection Project in 1998, which forbids any logging and management, to prevent further human disturbance and enable ecosystem recovery. However, this project also made many forests without disturbed couldn't get enough management, leading to intense competition and limited understory light, which then led to yield declines and slow seedling regeneration. Recently, the management and transformation of the forest have gradually increased, and mixing has become an important management and transformation direction, but few studies have focused on the influence of mixing on tree growth and stand yields, especially in pine-oak mixed forests. In this study, we investigated 120 typical forests plots in the Loess Plateau in 2009 and 2016. Our objectives were to (1) evaluate the effects of mixing on tree volume growth and stand yields, (2) verify the causes of the mixing effect and (3) investigate the influence of site quality and stand density on mixing effect. The findings of this study are useful for informing the management of pine and oak forest in the Loess Plateau to achieve maximum conservation and yield outcomes.
2. Materials and methods
2.1. Study site
The study site was in the Huanglong mountains in Shaanxi Province in North-western China, which is a major forest region in the southeast of the Loess Plateau. In this region, the total forest area is 174,185 ha, with pure oak forests ( > 80% coverage of oak) and broad-leaved mixed forests dominated by oak (50%–80% coverage of oak) covering 56,430 ha, pure pine forests (>80% coverage of pine) covering 47,112 ha, pine-oak mixed forests (the composition of pine and oak is more than 80%, while each species covers more than 20%) covering 29,882 ha, and other forest types covering 40,761 ha. It is a warm temperate semi-humid forest area (Wu and Yang Citation1998; Tsunekawa et al. Citation2014): the mean annual temperature is 10.4°C, and the mean annual precipitation is 545.78 mm (from 1990 to 2016) according to meteorological data supplied by the POWER Data Access Viewer weather database website (https://power.larc.nasa.gov/data-access-viewer/).
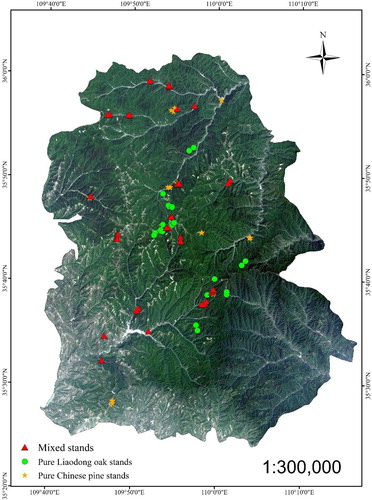
To study the influence of species composition, site quality and stand density on stand yield, 120 sample plots were established () in uneven-aged natural secondary forests without disturbing scattered in the Huanglong mountains, with elevations ranging from 1056 to 1685 m and slopes ranging from 0° to 42° (Table S1, Append X). The plots included 30 pure oak plots, 34 pure pine plots and 56 pine-oak mixed plots.
Figure 1. Location of the plots used for investigating the growth of pure and mixed stands of Liaodong oak (Quercus liaotungensis) and Chinese pine (Pinus tabulaeformis) in the Huanglong mountains.
The collection of sample plot information was conducted in 2009 and 2016. In each sample plot, the species, location, diameter at breast height (DBH, cm), tree height (H, m), crown length (m) and crown width (m) were recorded for trees with a DBH of more than 5 cm. All the stand and basic tree information were based on the first investigation in 2009. The individual-tree indicators were only calculated for target species. For stand indicators, all the broad-leaved species, including non-target species, were regarded as Liaodong oak and all the coniferous species were regarded as Chinese pine. The volume of Chinese pine and Liaodong oak were calculated using equations proposed by Yang et al. (Citation2012) and Meng et al. (Citation2013), respectively, the calculation of tree volume for other species was based on Shaanxi's two-variable volume equation for broad-leaved trees and coniferous species, all the volume equations are two variables volume equation (DBH, tree height) (Hao and Wang Citation2012).
2.2. Mixing effects on stand yields
2.2.1. Development stage
To analyze the development stage of different uneven-aged forests, quadratic mean diameter (dg, cm)was used for comparison; other three typical indicators were also used: average tree height (, m), average tree basal area (
, m2 ha−1) and average tree volume (
, m3 ha−1).
2.2.2. Stand density
Reineke's (Reineke Citation1933) stand density index (SDI) was chosen as a measure of stand density and site occupancy. The usefulness of SDI, which is based on the quadratic mean diameter and number of trees in a subject stand, for uneven-aged and multi-species stands, has been questioned because of the need to partition the index into additive components to describe the relative stocking of a stand by different species or size classes. Stage (Citation1968) showed that SDI can be partitioned to allow for the contribution of various classes of trees in the stand towards the total index value. The summation method involves calculating SDI for each tree and then summing for the total stand value (Long and Daniel Citation1990; Shaw Citation2000):
(1)
(1) where Di is the DBH of the ith tree in the plot, Ni is the number of trees per hectare characterized by the ith tree, and b is the logarithmic slope of the maximum size-density relationship. To calculate b, the two species were fitted by Equation (2), and the fitting results were significant, with b being −1.497 (p < 0.001) and −1.730 (p < 0.001) for pine and oak, respectively.
(2)
(2) In mixed stands, Reineke's SDI was calculated separately for each species.
2.2.3. Site quality
Site form (SF), defined as the dominant height of the stand at a reference dominant diameter (Vanclay and Herny Citation1988), is an alternative for estimating site quality for different stand structures (even- and uneven-aged) because it does not require stand age. In this study, for each plot, we fitted the data of DBH and tree height for all trees in this plot and build a Height-DBH curves, and the Chapman-Richards function (Richards Citation1959) (Equation (3)) was used to fit the Height-DBH curves. the highest frequency DBH (19.5 cm) for all stands was chosen as reference dominant DBH () (Fu et al. Citation2018). Then we used Height-DBH curves for each plot as SF guide curves (Equation (4)) to calculate the dominant height of each plots at
.
(3)
(3) where H (m) is tree height, DBH (cm) is tree diameter at breast height, and a, b and c are model parameters.
The SF was then calculated as follows:
(4)
(4) where SF is site form,
is the reference dominant DBH, and a, b and c are model parameters.
2.2.4. Species proportion
The species proportion by area (Pi) (Equation (5)) can be estimated by using the stand basal area for the target species and the total stand (Sterba et al. Citation2014):
(5)
(5) where Pi is the proportion of species i, BAi is the basal area of species i and BAT is the total basal area.
2.2.5. Stand dynamics
Stand yields, annual ingrowth ratio (Equation (6)) and annual mortality ratio (Equation (7)) were used to describe the stand dynamics of each forest type. We used the periodic annual volume increment (PAIV, m3 ha−1 year−1) as a response variable to model stand yields.
(6)
(6)
(7)
(7) where t1 and t2 are the time of first and second inventory,
is the number of trees per hectare at t1, stand ingrowth is the number of trees which DBH less than 5 cm at t1 but greater than 5 cm at t2, stand mortality is the number of trees survived at t1 but dead at t2.
2.2.6. Whole-stand yield model
The influence of site quality, stand density, development stage and species proportion on stand yields was clarified based on the empirical function as follows (Condes et al. Citation2013):
(8)
(8) where PAIVi is the periodic annual volume increment of species i per hectare, hence, its stand yields, SF is site form of species i, dgi is the quadratic mean diameter of species i, SDIi is the SDI of species i, Pi is the proportion by area of the species i, ε is stand error and a0–a4 are model parameters.
Model goodness-of-fit was assessed using residual standard error (RSE); mean Square Error (MSE); significance and adjusted coefficient of determination R2 (Adj. R2) four indicators.
2.2.7. Mixing effects on stand yield
Two indices were used to compare the stand yields of pine-oak mixed and pure stands and to quantify the mixing effect. The absolute mixing response (AMR) indicates the mixing effect at the stand level:
(9)
(9) where
is expected pine mean annual increment of stand volume in mixed stands,
is expected oak mean annual increment of stand volume in mixed stands,
is expected pine mean annual increment of stand volume in pure stands with the same site condition in terms of species proportion, stand density, site quality and development stage,
is expected oak mean annual increment of stand volume in pure stands with the same site condition,
is the proportion of pine and
is the proportion of oak.
The relative mixing response (RMR) indicates the mixing effect at the species levels:
(10)
(10) Whereas the AMR is concerned with the efficiency of area and resource use, the RMR reflects the general regulation of species mixing, which could also be considered a measure of complementarity (Forrester et al. Citation2013).
To test the effect of different stand densities (using SDI) and site quality (using SF) on stand volume we modeled stand volume using low (0–600, in SDI = 500 N ha−1), intermediate (600–1000, in SDI = 800 N ha−1) and high (>1000, in SDI = 1100 N ha−1) stand densities and low (0–10, in SF = 9), intermediate (10–14, in SF = 12) and high (>14, in SF = 15) site quality.
2.3. Mixing effect on competition and facilitation
We chose the total basal area of trees larger than the subject trees (BAL) as the competition index. The BAL index is a commonly used distance-independent competition index in individual-tree growth models (Wykoff Citation1990). This index is stable, applicable and best suited to reflect competition in pine-oak mixed forests in this region (Sun et al. Citation2019). The calculation of BAL was as follows
(11)
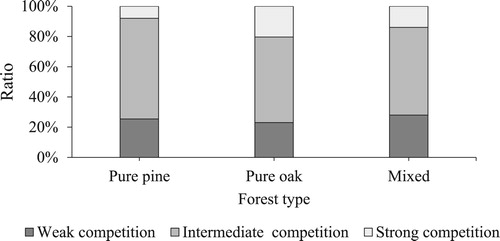
(11) where BAL1, ij is the total basal area of number j tree in plot i, BAik is the basal area of number k tree in plot i, k = 1, 2, 3 … … ni and ni is the tree number in plot i. When BAik > BAij, a = 1, else a = 0. We considered strong competition to be a BAL score of more than 25, intermediate competition to be a BAL score between 25 and 10 and weak competition to be a BAL score less than 10.
The relationships between the individual-tree competition index BAL and mean annual increment of tree volume (iv) were analyzed for pure and mixed stands using linear regression analysis to analyze the influence of interspecific and intraspecific competition on individual growth under different intensities of competition.
Comparison of the iv-v relationship in mixed-species stands with pure stands was used to reveal the modification of size asymmetry by species mixing, the slope (b) of the iv-v relationship revealed the interindividual competition and growth partitioning between the trees in a stand (Schwinning and Weiner Citation1998; Wichmann Citation2001). The slope can also be used to quantify and further analyze the size symmetry of competition (Hara Citation1992, Citation1993; Yokozawa et al. Citation1998).
Five soil augers were drilled in each plot, 3 soil samples were taken from each horizon. The mean soil volumetric water content (SWC) of the whole horizon (0–100 cm; SWC0–1) was calculated by an equation that averaged the records with different weight according to the relative thickness as (Wilson et al. Citation2001):
(12)
(12) where SWC0-0.1, SWC0.1-0.2, SWC0.2-0.3, SWC0.3-0.5, and SWC0.5-1 are the data measured at 0–10, 10–20, 20–30, 30–50, and 50–100 cm, respectively. The soil nutrient was represented by soil total nitrogen and soil carbon content in each plot and measured same as soil water content.
In order to study the competition and facilitation of different diameter classes, we analyzed the DBH class distribution of different forest types and the volume growth corresponding to different DBH classes.
3. Results
3.1. Mixing effects on stand structure and yields
The maximum tree size (max , max dg and max
) and mean tree size (mean
, mean dg and mean
) of pure pine, pure oak and mixed stands were not significantly different, except that pine volume (
) was much higher than that of oak, and oak crown was much bigger than that of pine. The mixed stands were a trade-off between pure pine stands and pure oak stands (). In mixed stands, not only was the ratio of pines higher than that of oaks (), but pine tree size was also significantly bigger than oak tree size, indicating the dominant position of pine in mixed forests.
Table 1. Tree characteristics of 120 pure and mixed Liaodong oak (Quercus liaotungensis) and Chinese pine (Pinus tabulaeformis) plots.
Table 2. Stand characteristics of 120 pure and mixed Liaodong oak (Quercus liaotungensis) and Chinese pine (Pinus tabulaeformis) plots.
As for stand dynamics, pure oak stands () showed high ingrowth, mortality and low yields. However, tree numbers in pure oak stands increased, as annual ingrowth was more than annual mortality (). In contrast, pure pine stands showed the opposite, with high yields and declining tree numbers, as annual mortality was higher than annual ingrowth, mainly because the ingrowth was very low (). The ingrowth of pine trees in mixed stands was more substantial than it was in pure pine stands, while the mortality of oaks in mixed stands was higher than in pure oak stands (). In mixed forests, the number of pines increased while the number of oaks declined. The soil water content in mixed forests was significantly higher than it in pure forests, while the soil nutrient in pure pine forests was significantly lower than it in pure oak and mixed forests.
All coefficients in the whole-stand growth models of the two species were significant in the final models (p < 0.05) (), and the models showed good fits (). The relationships of the two species showed some similar trends: both site quality and stand density showed positive effects on the PAIV. The influence of many other factors was different: with increasing development stage (dg), the PAIV of pine increased, but the PAIV of oak decreased, and with the increase in species proportion, the PAIV of pine decreased, while the PAIV of oak increased ().
Table 3. Fixed effect parameter estimates, standard errors, t values, and p-values for the Chinese pine and Liaodong oak growth models (Equation (8)).
Table 4. Goodness of fit statistics for the Chinese pine and Liaodong oak growth models (Equation (8)).
3.2. The cause of mixing effects
The difference in the average competition index between mixed stands (15.4) and pure stands (15.9 in oak and 15.2 in pine) was not significant. However, the average competition index of oak in pure stands (15.9) was less than that in mixed stands (17.3), while for pine, the competition index in pure stands (15.2) was higher than that in mixed stands (14.3). The ratios of the different intensities of competition for individuals in pure and mixed stands were similar (). Most of the individuals were under intermediate competition or weak competition, and few individuals were under strong competition. However, compared with the competition in pure pine stands, there was more strong competition and less intermediate competition in pure oak stands ().
Figure 2. The ratio of different intensities of competition for individuals in pure oak (n = 4572) and pine (n = 4509) forests and pine (n = 5292) and oak (n = 2774) individuals in mixed forests.
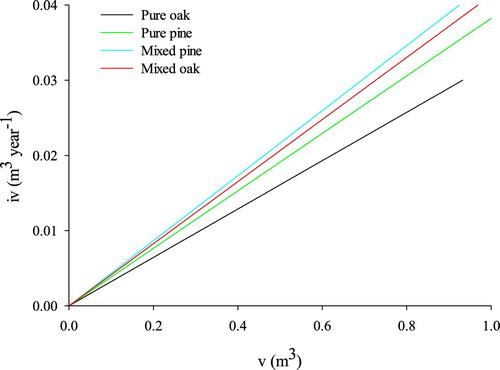
For competition mode, the competition of pine was more asymmetrical than oak trees and mixing increased the asymmetry. The slope (b) of the iv-v curve was steepest for pine in mixed stands, followed by oak in mixed stands then pine in pure stands and finally oak in pure stands ().
Figure 3. The mean annual increment of tree volume (iv)- tree volume (v) relationship for mixed and pure Liaodong oak and Chinese pine.
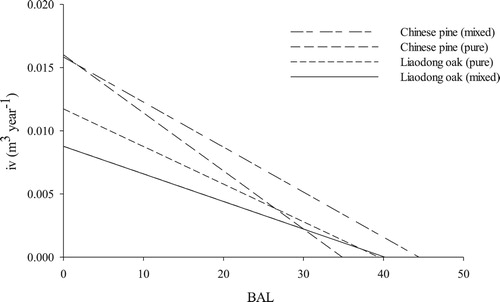
Mixing not only affected competition but also differentially influenced the growth of individual trees of oak and pine under the same intensities of competition (). Under weak competition, the growth of individual trees of pine in mixed and pure stands was not significantly different. With increased competition intensity, the decrease in growth of pine in pure stands was more substantial than that in mixed stands. In contrast, the growth of oak in pure and mixed stands showed little difference under strong competition intensity. However, with decreased competition intensity, the increase in oak growth was higher in pure stands than in mixed stands.
Figure 4. Relationships between the total basal area of trees larger than the subject trees (BAL) and mean annual increment of tree volume (iv) of Chinese pine and Liaodong oak.
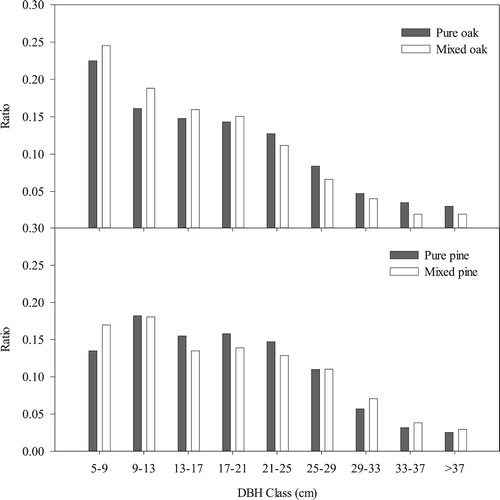
In uneven-aged forests, oaks typically followed reverse J-shaped diameter distributions, where most of the trees had a small diameter, and the numbers of trees decreased with an increase in diameter, while the size distribution of pine was closer to a right-skewed distribution, with the number of trees in the middle classes being more than in the small classes (). However, in the mixed stands, the ratio of oaks with a small DBH increased and the distribution of pines became more spread out, with a higher ratio of pines with small or large DBH.
Figure 5. Diameter at breast height (DBH) classes of pure and mixed Chinese pine and Liaodong oak plots.
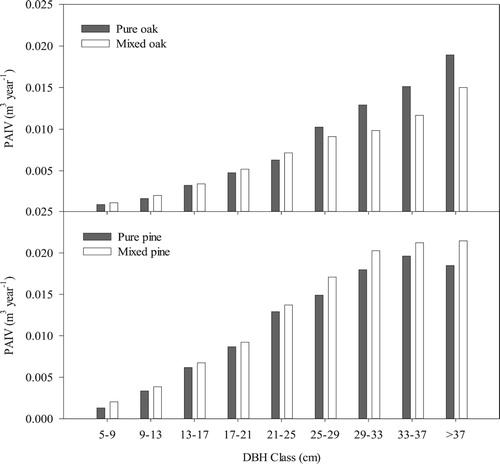
With the increase of DBH, the volume increment of both pine and oak become higher (). However, the volume increment of pine stabilized after the DBH of trees was greater than 29 cm, while oak retained the rising trend. With mixing, the volume increment of oak with small and middle DBH increased, but the trend weakened with increasing DBH, and after the DBH was greater than 25 cm, mixing negatively influenced the growth of oak. For pine, mixing increased the volume increment in every DBH class (), but this positive influence also weakened with an increase in pine DBH.
Figure 6. Influence of mixing on the periodic annual volume increment (PAIV) of different diameter at breast height (DBH) classes of Chinese pine and Liaodong oak.
3.3. The effects of site quality and stand density on mixing effects
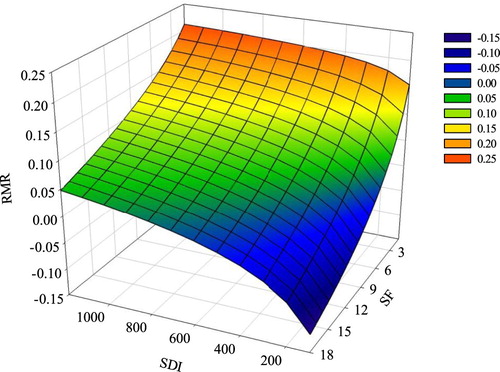
For pine, the PAIV in mixed stands was more than that in pure stands (). However, for oak, the PAIV in mixed stands was less than that in pure stands, but the difference was less than that for pine, so the total PAIV in mixed stands was slightly higher than that in pure stands. This also indicated that for our plots, mixing caused over-yielding, no matter how high the stand density and site quality was. The PAIV was highest when the ratio of pine was 100%, which means mixing could not cause transgressive over-yielding. After extrapolating site form and stand density though the model (), we found that when the stand density was very low and the site quality was very high, RMR was less than 0, which indicated that under-yielding could happen under extreme situations. The proportion of pine at the maximum RMR was related to stand density and site quality: it ranged from 40% to 100%, with most of them in the range of 40–60%. The change in AMR was the same as that for RMR, which decreased with increasing stand density and decreasing site quality and proportion of pine trees. The RMR changed with changes in stand density and site quality (), ranging from −15–25%. The RMR increased with the increase in stand density but decreased with increasing site quality. In contrast, the AMR increased with increasing stand density. However, it did not decrease with the increase in site quality: the maximum AMR usually occurred when SF was between 9 and 10.
Figure 7. Modeled stand volume increment (PAIV) of pure and mixed stands of Chinese pine and Liaodong oak with different stand density indices (SDI) and site forms (SF).
Note: The dg of pine and oak in this figure are 20 cm.
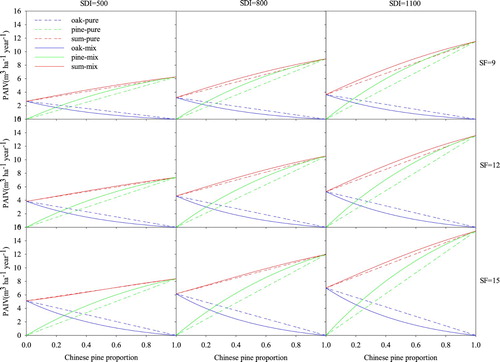
Figure 8. Response of relative mixing response (RMR) to total stand density index (SDI) and site form (SF) at a ratio of 50% Chinese pine.
Note: The dg of pine and oak in this figure are 20 cm.
4. Discussion
4.1. The over-yielding in pine-oak stands
We found that mixing generally led to slight over-yielding in pine-oak stands. However, no transgressive over-yielding was observed, and pine stands produced the highest yields, followed by mixed stands and pure oak stands. The volume growth of oak was significantly lower than pine, mainly because oak allocates more resources to branches to achieve a larger crown width, making the trunk of oak less than pine. Despite the ability of mixing to increase the yields in mixed stands, oak yields prevented total yields from reaching the equivalent of the yields from pure pine stands.
Facilitation between pine and oak was the main reason for increases in yields in mixed stands in this region. Although it is difficult to quantify the facilitation in forests (Forrester and Bauhus Citation2016), we simulated the changes of light ecology in the mixed stands by investigating the crown shape and size in pure and mixed pine-oak stands, and compared the growth of different diameter class (age) to reflects whether this changed in light ecology has express facilitation. In this study, the volume during the early growth stage of mixed stands being much higher than it of pure stands, probably because the light ecology of understory in mixed forests was better to accelerate the growth of pine and oak in the understory.
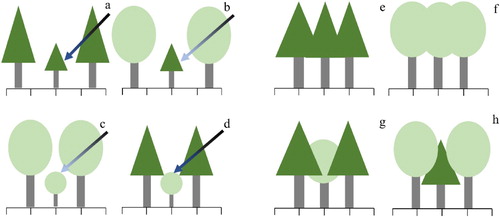
Although both pine and oak are light-demanding tree species (Wu Citation2010), in the early stage of growth, the two species have different strategies to cope with shadowing. Pine tolerates shading like a shade-tolerant species with low LUE, but its shade tolerance is relatively weak. The regeneration of Chinese pine is difficult, particular under closed canopies without management, the pine sapling could only appear in suitable condition with gaps (Han et al. Citation2012; Wang et al. Citation2017). However, the growth of young pine under direct light is lower than that under diffuse light (Zhen Citation2013). This is because direct light causes stomata closure, decreasing transpiration and photosynthesis. Suitable shade decreases the excessive transpiration of young trees and increases their water use and photosynthetic efficiencies. Compared with pine, mature oak trees have a larger crown width, and the light interception by the oak foliage is higher than pine foliage (Sonohat et al. Citation2004; Bristow et al. Citation2006). Compared with pure stands ((a,c)), mixed stands ((b)) could provide more shading for pine to regenerate in forest gaps and higher light availability for understory oak ((d)). Also, compared with the pure stands ((e,f)) with the same crown shape and space occupation, mixed stands with taller oaks ((h)) could occupy more space and provide less crown overlap, while taller pines ((g)) are not complementary. In mixed forests, oak provided more shade for pine ((b)), and the growth rate of pine in the early growth stage was much faster in the mixed stands than in pure pine stands. However, this effect disappeared when the pine saplings became mature trees, the competitive capacity was increased and there was no significant difference between mixed and pure stands when the intensity of competition was 0. The relatively higher mortality of oak than pine in the mixed stands made the number of forest gaps increase, which enabled the growth of pine and a higher ingrowth of pine than oak.
Figure 9. The effect of mixing pine (triangle crown) and oak (oval crown) trees (b, d, g, h) on canopy space and the availability of light (blue arrow) of different intensities (a darker arrow color indicates a higher intensity of light) compared with pure pine (a, e) and oak (c, f) stands.
On the contrary, in the early growth stage, oak avoids shading like a fast-growing species with high LUE (Yan et al. Citation2011), but the growth of oak is slower than pine, and the average height is lower than pine. The phytochrome system of oak is sensitive to changes in the proportion of red and far-red light caused by shading. When oak is shaded, it allocates its limited resources to vertical growth and survival while inhibiting radial growth of the trunk and branches (Whitelam et al. Citation1998). This strategy ensures that the tree reaches the main forest layer in the shortest time and occupies a dominant position to obtain enough light resources for radial growth and branch growth at a later stage (Yang et al. Citation2019). Therefore, the existence of pine in the mixed stands could provide better light conditions for oak and accelerate its growth rate in the early growth stage ((c)), and once in a dominant position, oak has a relatively high light saturation point and bigger tree crown, which ensures high LUE and the tree can quickly make up for growth inhibition during the early growth stage. In our study, the growth rate of oak in mixed and pure stands was not as stable as pine: it was faster (). However, after the rapid period of growth in tree height in the mixed stands, oak trees still did not reach the height of the pine in the main forest layer ((g)), and they were suppressed by the upper layer of pine in the middle and late growth stages, which means that oak is unable to obtain sufficient light resources during mixing with pine. Hence, in the later growth stage, the growth rate of oak in the pure stands is much higher than in the mixed stands, and the mortality rate in the mixed stands was also higher than pure stands () because of the lack of light.
On the other hand, the yield of large DBH class pines in mixed stands was higher than it in pure stands, which probably because the mixing with oak improved the soil water and nutrient condition. By accelerating the decomposition rate of litter, improve litter quality and forest floor conditions, mixed stands have better soil water and nutrient conditions (Perez-Suarez et al. Citation2009; Laganiere et al. Citation2010; Cheng et al. Citation2014; He et al. Citation2019), pine tends to associate more with fungi in the presence of oak (Suz et al. Citation2017) and these fungi facilitate tree water and nutrient uptake in exchange for photosynthetic carbon (Cornelissen et al. Citation1999). Also, mixing could improve the absorption of nitrogen by pines under low site quality, and leading the increase of pine yields (Zhang et al. Citation2018).
In our study, mixing did not significantly influence competition intensity, but its increased competition asymmetry. Having a bigger tree size, pine occupied the dominant position in the competition between the two species. The asymmetric competition in mixed stands also allowed the upper crown of pines to receive more light. However, it did not accelerate the growth rate of pine. This was probably because the relatively low LUE of pine made it difficult to uptake more sunlight. Also, the structure of mixed forests, with pine in the upper-story and oak in the understory layer ((g)), was not beneficial because the lower crowns of pine and the upper crowns of oak covered each other. Compared with pure stands ((e,f)), the lower crowns of pine did not receive more light, but the pine negatively influenced the light available to the upper crown of oak. Hence, if oak occupies a higher position in the main story ((h)), then the whole main story could occupy more space and have less crown overlap, thereby reducing competition and increasing the interception of light.
4.2. Factors affecting mixing effects
The effect of mixing on yield was also influenced by site quality and stand density. As the site quality improved, over-yielding was reduced, and in extremely high-quality sites, under-yielding was even found. This is not consistent with the conclusions of Forrester (Citation2014) and Forrester and Bauhus (Citation2016), who reported that over-yielding increased with an increase in site quality. Our results are more in line with the stress-gradient hypothesis, which suggests that competition and facilitation can switch with changes in the environment: facilitation increases and competition decreases when environmental conditions become harsher (Bertness and Yeh Citation1994; Brooker et al. Citation2007). However, our findings are not entirely explained by the stress-gradient hypothesis. In addition to the mutual transformation of competition and facilitation, there is also a phenomenon of weakening competition in the forest due to niche complementarity. With the increase in site quality, the importance of light resources gradually increased, and trees increased their crown width to increase light use. As such, above-ground competition became increasingly fierce, making the competition weakening effect brought about by crown complementarity more significant. Therefore, if over-yielding is mainly due to facilitation, then as the site quality improves, facilitation will gradually be transformed into competition, and the over-yielding effect will gradually weaken or turn to under-yielding. If the increase in production is mainly due to reduced competition, then as the site quality improves, the phenomenon of competition reduction will gradually increase, and the over-yielding effect will gradually increase too.
In addition, mixing effects are also related to stand density: with an increase in stand density, the benefits of mixing are gradually increased. This is consistent with many previous studies (Garber and Maguire Citation2004; Amoroso and Turnblom Citation2006; Condes et al. Citation2013), which indicated that as stand density increases, the interaction between species can become stronger in both positive and negative ways. Our results showed the positive effects of increasing stand density on yield in mixed pine-oak stands. However, there were thresholds associated with the positive effects: if the stand density was lower than the threshold value or site quality was higher than the threshold value, the competitive effects were larger than the complementary benefits, and there was a negative effect of mixing. Modeling indicated that this negative effect changed weakly with an increase in stand density. However, further studies are required to verify this result.
4.3. Management implications
Pure pine stands had the highest yields, but the BAI was lower than for oak stands, so the productivity of pine may not be higher than that of oak. However, for forest managers in the Loess Plateau, ecological benefits are the primary objective, and yields are only the secondary objective. Even though pure pine stands consistently produced the highest yields, mixed forests, which have better ecological benefits, are the direction of secondary forest transformation, but appropriate management of over-yielding is required. For future forest management, it would be beneficial for a large number of pure stands to be transformed to mixed forest while maintaining the structure of pine-oak mixed stands in regions with low-quality sites. However, the existing mixed secondary stands show some deficiencies. In particular, the proportion of oak is too low, with at least 40% of oak required to maintain the positive effects of mixing. For sites of high-quality, other tree species could be chosen for mixing. For example, Holm oak (Quercus acutissima) is a species with rapid growth, high stem quality and tree height, but the soil water and nutrient requirements for this species are concomitantly high. In mixed Chinese pine-Holm oak stands, oak is on the top and pine is beneath ((h)), which not only enables crown shape complementary but also produces higher yields.
In terms of stand density, most of the existing stand densities do not affect the normal growth of trees. Large-scale thinning is not needed for now, but small-scale thinning or proper pruning is still necessary to improve the light ecology of the forest, accelerate the growth of young trees and accelerate the regeneration of seedlings. In some stands, especially high-quality stands with low stand density, replanting is needed to increase yields.
For future thinning, large diameter classes of pine are recommended, not only because of the higher economic value of pine but also because it can improve the growth of oak that has previously been suppressed by pine. Mature oak in the top layer could also maintain the shading effect under the forest to ensure the quick growth of pine in the lower layer. However, because of the low natural regeneration rate of pine, replanting after thinning is recommended.
5. Conclusions
Facilitation among pine and oak improved the understory light conditions, which caused the over-yielding in mixed pine-oak stands in the Loess Plateau, but the interspecific competition did not decrease. In addition, the mixing effect is affected by site quality and stand density. In general, improvements in site quality reduce yields and increases in stand density increase yields. We also found that although pine had the highest yield, it might not be the most productive. Based on these findings we recommend the transformation of pure oak and pine forest stands in the Loess Plateau to mixed forest, for future thinning, large diameter classes of pine are recommended, the differential management of stands depending on the quality of the site. At low-quality sites, the structure of mixed pine-oak forests should be maintained, whereas at high-quality sites, density should be increased and other suitable species should be planted at sites that have the capacity for more trees.
Supplemental Material
Download MS Word (21 KB)Disclosure statement
No potential conflict of interest was reported by the author(s).
Additional information
Funding
Notes on contributors
Xiao-zhou Yang
Xiao-zhou Yang, 1990, is a doctor of Northwest A&F University, Shaanxi, China. The author is mainly engaged in research on silviculture and plant interactions.
Qiu-yue He
Qiu-yue He, 1991, is a doctor of Northwest A&F University, Shaanxi, China. The author is mainly engaged in research on watershed ecology and tree physiology.
Wen-hui Zhang
Wen-hui Zhang is a Professor of Northwest A&F University. The author is mainly engaged in the research of natural forest protection and secondary forest management.
References
- Amoroso MM, Turnblom EC. 2006. Comparing productivity of pure and mixed Douglas-fir and western hemlock plantations in the Pacific Northwest. Can J For Res. 36:1484–1496. doi:10.1139/x06-042.
- Assmann E. 1970. The principles of forest yield study. Oxford: Pergamon Press. doi:10.1016/B978-0-08-006658-5.50012-1.
- Augusto L, Ranger J, Binkley D, Rothe A. 2002. Impact of several common tree species of European temperate forests on soil fertility. Ann For Sci. 59:233–253. doi:10.1051/forest:2002020.
- Barnes BV, Pregitzer KS, Spies TA, Spooner VH. 1982. Ecological forest site classification. J For. 80:493–498.
- Bauhus J, Forrester DI, Pretzsch H. 2018. From observations to evidence about effects of mixed-species stands. In: Pretzsch H, Forrester D., Bauhus J, editors. Mixed species forests ecology and management. Berlin: Springer; p. 27–72. doi:10.1007/978-3-662-54553-9.
- Bauhus J, van Winden AP, Nicotra AB. 2004. Aboveground interactions and productivity in mixed-species plantations of Acacia mearnsii and Eucalyptus globulus. Can J For Res. 34:686–694. doi:10.1139/x03-243.
- Begon M, Harper JL, Townsend CR. 1986. Ecology: individuals, populations and communities. Oxford: Blackwell Scientific Publications. doi:10.2307/2807146.
- Bertness MD, Yeh SM. 1994. Cooperative and competitive interactions in the recruitment of marsh elders. Ecology. 75:2416–2429. doi:10.2307/1940895.
- Bravo-Oviedo A, Pretzsch H, Ammer C, Andenmatten E, Barbati A, Barreiro S, Brang P, Bravo F, Coll L, Coronal P, et al. 2014. European mixed forests: definition and research perspectives. For Syst. 23:518–533. doi:10.5424/fs/2014233-06256.
- Bristow M, Vanclay JK, Brooks L, Hunt M. 2006. Growth and species interactions of Eucalyptus pellita in a mixed and monoculture plantation in the humid tropics of north Queensland. For Ecol Manag. 233:285–294. doi:10.1016/j.foreco.2006.05.019.
- Brooker RW, Maestre FT, Callaway RM, Lortie CL, Cavieres LA, Kunstler G, Liancourt P, Tielboerger K, Travis JMJ, Anthelme F, et al. 2007. Facilitation in plant communities: the past, the present, and the future. J Ecol. 96:18–34. doi:10.1111/j.1365-2745.2007.01295.x.
- Cao JX, Wang XP, Tian Y, Wen ZY, Zha TS. 2012. Pattern of carbon allocation across three different stages of stand development of a Chinese pine (Pinus tabulaeformis) forest. Ecol Res. 27:883–892. doi:10.1007/s11284-012-0965-1.
- Cheng XQ, Han HR, Kang FF, Song YL, Liu K. 2014. Variation in biomass and carbon storage by stand age in pine (Pinus tabulaeformis) planted ecosystem in Mt. Taiyue, Shanxi, China. J Plant Interact. 9:521–528. doi:10.1080/17429145.2013.862360.
- Condes S, del Rio M. 2015. Climate modifies tree interactions in terms of basal area growth and mortality in monospecific and mixed Fagus sylvatica and Pinus sylvestris forests. Eur J For Res. 134:1095–1108. doi:10.1007/s10342-015-0912-0.
- Condes S, Del Rio M, Sterba H. 2013. Mixing effect on volume growth of Fagus sylvatica and Pinus sylvestris is modulated by stand density. For Ecol Manag. 292:86–95. doi:10.1016/j.foreco.2012.12.013.
- Cornelissen JHC, Perez-Harguindeguy N, Diaz S, Grime JP, Marzano B, Cabido M, Vendramini F, Cerabolini B. 1999. Leaf structure and defence control litter decomposition rate across species and life forms in regional floras on two continents. New Phytol. 143:191–200. doi:10.1046/j.1469-8137.1999.00430.x.
- Forrester DI. 2014. The spatial and temporal dynamics of species interactions in mixed-species forests: from pattern to process. For Ecol Manag. 312:282–292. doi:10.1016/j.foreco.2013.10.003.
- Forrester DI, Albrecht AT. 2014. Light absorption and light-use efficiency in mixtures of Abies alba and Picea abies along a productivity gradient. For Ecol Manag. 328:94–102. doi:10.1016/j.foreco.2014.05.026.
- Forrester DI, Bauhus J. 2016. A review of processes behind diversity-productivity relationships in forests. Current For Rep. 2:45–61. doi:10.1007/s40725-016-0031-2 doi: 10.1007/s40495-016-0048-z
- Forrester DI, Bauhus J, Cowie AL, Vanclay JK. 2006. Mixed-species plantations of Eucalyptus with nitrogen-fixing trees: a review. For Ecol Manag. 233:211–230. doi:10.1016/j.foreco.2006.05.012.
- Forrester DI, Kohnle U, Albrecht AT, Bauhus J. 2013. Complementarity in mixed-species stands of Abies alba and Picea abies varies with climate, site quality and stand density. For Ecol Manag. 304:233–242. doi:10.1016/j.foreco.2013.04.038.
- Frivold LH, Frank J. 2002. Growth of mixed birch-coniferous stands in relation to pure coniferous stands at similar sites in south-eastern Norway. Scand J For Res. 17:139–149. doi:10.1080/028275802753626782.
- Fu LY, Lei XD, Sharma RP, Li HK, Zhu GY, Hong LX, You L, Duan GS, Guo H, Lei YC, et al. 2018. Comparing height-age and height-diameter modelling approaches for estimating site productivity of natural uneven-aged forests. Forestry. 91:419–433. doi:10.1093/forestry/cpx049.
- Gamfeldt L, Snall T, Bagchi R, Jonsson M, Gustafsson L, Kjellander P, Ruiz-Jaen MC, Froberg M, Stendahl J, Philipson CD, et al. 2013. Higher levels of multiple ecosystem services are found in forests with more tree species. Nat Commun. 4:1340. doi:10.1038/ncomms2328.
- Garber SM, Maguire DA. 2004. Stand productivity and development in two mixed-species spacing trials in the central Oregon cascades. For Sci. 50:92–105.
- Griess VC, Knoke T. 2011. Growth performance, windthrow, and insects: meta-analyses of parameters influencing performance of mixed-species stands in boreal and northern temperate biomes. Can J For Res. 41:1141–1159. doi:10.1139/x11-042.
- Guo H, Wang B, Ma XQ, Zhao GD, Li SN. 2008. Evaluation of ecosystem services of Chinese pine forests in China. Sci China Ser C-Life Sci. 51:662–670. doi:10.1007/s11427-008-0083-z.
- Halty V, Valdes M, Tejera M, Picasso V, Fort H. 2017. Modeling plant interspecific interactions from experiments with perennial crop mixtures to predict optimal combinations. Ecol Appl. 27:2277–2289. doi:10.1002/eap.1605.
- Han WJ, Yuan XQ, Zhang WH. 2012. Effects of gap size on seedling natural regeneration in artificial Pinus tabulaeformis plantation. Chinese J Appl Ecol. 23:2940–2948. doi:10.13287/j.1001-9332.2012.0445.
- Hao H, Wang H. 2012. Shaanxi forest resources. Xi’an: Shaanxi Science and Technology Press.
- Hara T. 1992. Effects of the mode of competition on stationary size distribution in plant-populations. Ann Bot. 69:509–513. doi:10.1093/oxfordjournals.aob.a088380.
- Hara T. 1993. Effects of variation in individual growth on plant-species coexistence. J Veg Sci. 4:409–416. doi:10.2307/3235600.
- He W, Ma ZY, Pei J, Teng MJ, Zeng LX, Yan ZG, Huang ZL, Zhou ZX, Wang PC, Luo X, et al. 2019. Effects of predominant tree species mixing on lignin and cellulose degradation during leaf litter decomposition in the Three Gorges Reservoir, China. Forests. 10:360. doi:10.3390/f10040360.
- Huber MO, Sterba H, Bernhard L. 2014. Site conditions and definition of compositional proportion modify mixture effects in Picea abies - Abies alba stands. Can J For Res. 44:1281–1291. doi:10.1139/cjfr-2014-0188.
- Kelty MJ. 1992. Comparative productivity of monocultures and mixed-species stands. In: Kelty MJ, Larson BC, Oliver, CD, editors. The ecology and silviculture of mixed-species forests. Dordrecht: Kluwer Academic Publishers.
- Kelty MJ. 2006. The role of species mixtures in plantation forestry. For Ecol Manag. 233:195–204. doi:10.1016/j.foreco.2006.05.011.
- Kelty MJ, Cameron IR. 1995. Plot designs for the analysis of species interactions in mixed stands. Commonwealth For Rev. 74:322–332.
- Laganiere J, Pare D, Bradley RL. 2010. How does a tree species influence litter decomposition? Separating the relative contribution of litter quality, litter mixing, and forest floor conditions. Can J For Res. 40:465–475. doi:10.1139/x09-208.
- Langvall O. 2011. Impact of climate change, seedling type and provenance on the risk of damage to Norway spruce (Picea abies (L.) Karst.) seedlings in Sweden due to early summer frosts. Scand J For Res. 26:56–63. doi:10.1080/02827581.2011.564399.
- Long JN, Daniel TW. 1990. Assessment of growing stock in uneven-aged stands. West J Appl For. 5:93–96. doi: 10.1093/wjaf/5.3.93
- Manso R, Morneau F, Ningre F, Fortin M. 2015. Effect of climate and intra- and inter-specific competition on diameter increment in beech and oak stands. Forestry. 88:540–551. doi:10.1093/forestry/cpv020.
- Meng Q, Liu X, Lu G. 2013. Effects of artificial tending on growth of Quercus liaotungensis at different altitudinal gradient. J Central South Univ For Technol. 292:86–95.
- Perez-Suarez M, Arredondo-Moreno JT, Huber-Sannwald E, Vargas-Hernandez JJ. 2009. Production and quality of senesced and green litterfall in a pine-oak forest in central-northwest Mexico. For Ecol Manag. 258:1307–1315. doi:10.1016/j.foreco.2009.06.031.
- Piotto D. 2008. A meta-analysis comparing tree growth in monocultures and mixed plantations. For Ecol Manag. 255:781–786. doi:10.1016/j.foreco.2007.09.065.
- Pretzsch H. 2005. Stand density and growth of Norway spruce (Picea abies (L.) Karst.) and European beech (Fagus sylvatica L.): evidence from long-term experimental plots. Eur J For Res. 124:193–205. doi:10.1007/s10342-005-0068-4.
- Pretzsch H, Biber P. 2010. Size-symmetric versus size-asymmetric competition and growth partitioning among trees in forest stands along an ecological gradient in central Europe. Can J For Res. 40:370–384. doi:10.1139/x09-195.
- Pretzsch H, Bielak K, Block J, Bruchwald A, Dieler J, Ehrhart H-P, Kohnle U, Nagel J, Spellmann H, Zasada M, et al. 2013. Productivity of mixed versus pure stands of oak (Quercus petraea (Matt.) Liebl. and Quercus robur L.) and European beech (Fagus sylvatica L.) along an ecological gradient. Eur J For Res. 132:263–280. doi:10.1007/s10342-012-0673-y.
- Pretzsch H, Block J, Dieler J, Dong PH, Kohnle U, Nagel J, Spellmann H, Zingg A. 2010. Comparison between the productivity of pure and mixed stands of Norway spruce and European beech along an ecological gradient. Ann For Sci. 67(7):712. doi:10.1051/forest/2010037.
- Pretzsch H, Dieler J. 2012. Evidence of variant intra- and interspecific scaling of tree crown structure and relevance for allometric theory. Oecologia. 169:637–649. doi:10.1007/s00442-011-2240-5.
- Pretzsch H, Schuetze G, Biber P. 2016. On the effect of tree species mixing on the yield components at the stand level. Allgemeine Forst Und Jagdzeitung. 187:122–135.
- Reineke LH. 1933. Perfecting a stand-density index for even-aged forests. J Agric Res. 46:627–638.
- Richards F. 1959. A flexible growth function for empirical use. J Exp Bot. 10:290–301. doi: 10.1093/jxb/10.2.290
- Richards AE, Schmidt S. 2010. Complementary resource use by tree species in a rain forest tree plantation. Ecol Appl. 20:1237–1254. doi:10.1890/09-1180.1.
- Riofrio J, del Rio M, Bravo F. 2016. Mixing effects on growth efficiency in mixed pine forests. Forestry. 90:381–392. doi:10.1093/forestry/cpw056.
- Rosenfeld JS. 2002. Functional redundancy in ecology and conservation. Oikos. 98:156–162. doi:10.1034/j.1600-0706.2002.980116.x.
- Schwinning S, Weiner J. 1998. Mechanisms determining the degree of size asymmetry in competition among plants. Oecologia. 113:447–455. doi:10.2307/4221874 doi: 10.1007/s004420050397
- Shaw JD. 2000. Application of stand density index to irregularly structured stands. West J Appl For. 15:40–42. doi: 10.1093/wjaf/15.1.40
- Song BL, Yan MJ, Hou H, Guan JH, Shi WY, Li GQ, Du S. 2016. Distribution of soil carbon and nitrogen in two typical forests in the semiarid region of the Loess Plateau, China. Catena. 143:159–166. doi:10.1016/j.catena.2016.04.004.
- Sonohat G, Balandier P, Ruchaud F. 2004. Predicting solar radiation transmittance in the understory of even-aged coniferous stands in temperate forests. Ann For Sci. 61:629–641. doi:10.1051/forest:2004061.
- Stage AR. 1968. A tree-by-tree measure of site utilization for grand fir related to stand density index. U.S. Forest Service, Research Note INT-77.
- Sterba H, del Rio M, Brunner A, Condes S. 2014. Effect of species proportion definition on the evaluation of growth in pure vs. mixed stands. For Syst. 23:547–559. doi:10.5424/fs/2014233-06051.
- Sun S, Cao QV, Cao T. 2019. Evaluation of distance-independent competition indices in predicting tree survival and diameter growth. Can J For Res. 49:440–446. doi:10.1139/cjfr-2018-0344.
- Suz LM, Kallow S, Reed K, Bidartondo MI, Barsoum N. 2017. Pine mycorrhizal communities in pure and mixed pine-oak forests: abiotic environment trumps neighboring oak host effects. For Ecol Manag. 406:370–380. doi:10.1016/j.foreco.2017.09.030.
- Toigo M, Vallet P, Perot T, Bontemps J-D, Piedallu C, Courbaud B. 2015. Overyielding in mixed forests decreases with site productivity. J Ecol. 103:502–512. doi:10.1111/1365-2745.12353.
- Tsunekawa A, Liu G, Yamanaka N, Du S. 2014. Restoration and development of the degraded Loess Plateau, China. Tokyo: Springer.
- Vanclay JK, Herny NB. 1988. Assessing site productivity of indigenous cypress pine forest in southern Queensland. Commonw For Rev. 67:53–64.
- Vandermeer J. 1992. The ecology of intercropping. Cambridge: Cambridge University Press.
- Vila M, Carrillo-Gavilan A, Vayreda J, Bugmann H, Fridman J, Grodzki W, Haase J, Kunstler G, Schelhaas M, Trasobares A. 2013. Disentangling biodiversity and climatic determinants of wood production. PLoS One. 8:e53530. doi:10.1371/journal.pone.0053530.
- Wang L, Zhang Y. 2011. Discussion on the taxonomic position and nomenclature of liaodong oak (Fagaceae). Plant Science Journal. 29:749–754. doi:10.3724/sp.j.1142.2011.60749 doi: 10.3724/SP.J.1142.2011.10134
- Wang ZB, Yang HJ, Dong BQ, Zhou MM, Ma LY, Jia ZK, Duan J. 2017. Effects of canopy gap size on growth and spatial patterns of Chinese pine (Pinus tabulaeformis) regeneration. For Ecol Manag. 385:46–56. doi:10.1016/j.foreco.2016.11.022.
- Weiner J, Freckleton RP. 2010. Constant final yield. In: Futuyma DJ, Shafer HB, Simberloff D, editors. Annual review of ecology, evolution, and systematics. p. 173–192. doi:10.1146/annurev-ecolsys-102209-144642.
- Whitelam GC, Patel S, Devlin PF. 1998. Phytochromes and photomorphogenesis in Arabidopsis. Philos Trans R Soc London. 353:1445–1453. doi:10.1098/rstb.1998.0300.
- Wichmann L. 2001. Annual variations in competition symmetry in even-aged sitka spruce. Ann Bot. 88:145–151. doi:10.1006/anbo.2001.1445.
- Wilson KB, Hanson PJ, Mulholland PJ, Baldocchi DD, Wullschleger SD. 2001. A comparison of methods for determining forest evapotranspiration and its components: sap-flow, soil water budget, eddy covariance and catchment water balance. Agric For Meteorol. 106:153–168. doi:10.1016/s0168-1923(00)00199-4.
- Wu QX, Yang WZ. 1998. Forest and grassland vegetation construction and its sustainable development in Loess Plateau. Beijing: Science Press.
- Wu ZY. 2010. Flora of China. Beijing: Science Press.
- Wykoff WR. 1990. A basal area increment model for individual conifers in the northern Rocky Mountains. For Sci. 36:1077–1104.
- Yan XF, Wang JL, Zhou LB. 2011. Effects of light intensity on Quercus liaotungensis seed germination and seedling growth. Chin J Appl Ecol. 22:1682–1688.
- Yang C, Zhang J, Meng F. 2012. The study on dual volume table of pine tree for Shandong Province. Shandong For Sci Technol. 200:90–92.
- Yang XZ, Zhang WH, He QY. 2019. Effects of intraspecific competition on growth, architecture and biomass allocation of Quercus liaotungensis. J Plant Interact. 14:284–294. doi:10.1080/17429145.2019.1629656.
- Yokozawa M, Kubota Y, Hara T. 1998. Effects of competition mode on spatial pattern dynamics in plant communities. Ecol Modell. 106:1–16. doi:10.1016/s0304-3800(97)00181-6.
- Zapater M, Hossann C, Breda N, Brechet C, Bonal D, Granier A. 2011. Evidence of hydraulic lift in a young beech and oak mixed forest using O-18 soil water labelling. Trees. 25:885–894. doi:10.1007/s00468-011-0563-9.
- Zhang TZ, Li YN, Han FY, Zhang SZ, Zhou YB. 2018. C: N: P stoichiometry of Pinus tabuliformis leaf and soil in two mixed stands in western Liaoning Province. Chinese J Ecol. 37:3061–3067. doi:10.13292/j.1000-4890.201810.015.
- Zhao M, Zhou GS. 2006. Estimating net primary productivity of Chinese pine forests based on forest inventory data. Forestry. 79:231–239. doi:10.1093/forestry/cpl002.
- Zhen J. 2013. Effects of light intensity, nitrogen, water on carbon fixing capacity in Pinus Tabulaeformis. In: Ecology. Beijing Forestry University.