
ABSTRACT
Plant growth and crop productivity has been adversely affected by salt stress around the world. Arabidopsis root is an important model to demonstrate how the glycophyte adapts to salt stress. To better understand the salt-responsive genes in Arabidopsis root, a rank aggregation method has been applied to disclose 836 dysregulated genes including 449 upregulated and 387 down-regulated genes out of more than 20,000 genes in NaCl-treated Arabidopsis root from the Gene Expression Omnibus (GEO) database. Then, the integrated approaches of PANTHER, DAVID, KEGG, Cytoscape and STRING have been used for bioinformatic analysis. Our results showed that these salt-responsive genes were involved in various gene ontology enrichments (transcription, oxidative stress, cell wall organization), differential pathways (MAPK signaling pathway, hormone signal transduction), and complicated interactions (cross-talking with wounding stress, abscisic acid stress, heat stress, water deprivation stress, cold stress). Furthermore, the activities of the oxidative stress related gene, peroxidase, were determined under salt stress, cold stress and water deprivation stress, which validated the bioinformatic outcome of cross-tolerance to different stresses. Our work will throw new lights on the response of Arabidopsis roots to salt stress, and provide potential salt-targets to improve plant growth and increase crop output.
Introduction
Soil salinity is a risk factor threatening plant growth and crop output (Guo et al. Citation2012a). Plants have developed many approaches including sodium exclusion and sodium ion accumulation tolerance to adapt to salt stress (Guo et al. Citation2012b). In order to demonstrate the mechanisms of salt-response, many researches have been performed with the model plant Arabidopsis (Guo et al. Citation2019). Two-dimensional electrophoresis has been used to discover the differential Arabidopsis root proteins between wild type and salt-tolerance mutant, which identified 19 differential proteins related to signal transduction, redox homeostasis, and cell wall metabolism (Guo et al. Citation2014b). Furthermore, phosphorylation variations of proteins from Arabidopsis root under salt stress also have been determined by Pro-Q Diamond stain. Nonsynchronous differences between protein abundance and protein phosphorylation indicated the complicated mechanisms of root salt-responsive proteins. These altered proteins were associated with reactive oxygen species scavenging and metabolisms of the cell wall (Guo et al. Citation2014a). Compared with proteomic strategy, transcriptomic researches could provide complementary information in plant salt-response.
For the better understanding on salt-response in Arabidopsis root, differentially expressed genes (DEGs) in response to salt stress were retrieved from the gene expression omnibus database (GEO). Among more than 20,000 Arabidopsis genes, 836 dysregulated genes were screened based on a rank aggregation method, and further analyzed by the bioinformatic tools of PANTHER, DAVID, KEGG, Cytoscape, and STRING. The prediction of bioinformatic analysis was confirmed by experiment. The altered genes will facilitate the salt stress tolerance researches and provide new targets for the better explanation of the salt adaption in the plant root.
Materials and methods
Retrieval of salt-responsive DEGs in Arabidopsis roots from GEO database
Microarray data (GSM184831, GSM184832, GSM184839, GSM184840, GSM184833, GSM184834, GSM184841, GSM184842, GSM184835, GSM184836, GSM184843, GSM184844, GSM184837, GSM184838, GSM184845, GSM184846, GSM184889, GSM184890, GSM184891, GSM184907, GSM184908, GSM184909, GSM184892, GSM184893, GSM184894, GSM184910, GSM184911, GSM184912, GSM184895, GSM184896, GSM184897, GSM184913, GSM184914, GSM184915, GSM184898, GSM184899, GSM184900, GSM184916, GSM184917, GSM184918, GSM184901, GSM184902, GSM184903, GSM184919, GSM184920, GSM184921, GSM184904, GSM184905, GSM184906, GSM184922, GSM184923, GSM184924, GSM184925, GSM184926, GSM184929, GSM184930, GSM218283, GSM218284, GSM218285, GSM218286, GSM1126230, GSM1126231, GSM1126232, GSM1126236, GSM1126237, GSM1126238, GSM1126302, GSM1126303, GSM1126304, GSM1126308, GSM1126309, GSM1126310, GSM1126335, GSM1126336, GSM1126337, GSM1126338, GSM1824866, GSM1824867, GSM1824868, GSM1824869, GSM1824870, GSM1824871) related to salt-responsive gene expression profiling of Arabidopsis roots were downloaded from the GEO database (https://www.ncbi.nlm.nih.gov/geo/). Then, the data were calibrated by the online GEO tool of GEO2R (https://www.ncbi.nlm.nih.gov/geo/geo2r/). The integration of DEGs from different datasets were performed by the robust rank aggregation (RRA) software package (Niu et al. Citation2019).
Gene ontology classification
The online bioinformatic tools of DAVID (Database for annotation, visualization and integrated discovery, Version 6.8) (https://david.ncifcrf.gov/) was applied for gene ontology enrichment analysis of the recruited proteins.
Pathway analysis
The pathways of salt-responsive Arabidopsis root genes were analyzed by the online program of KEGG (Kyoto Encyclopedia of Genes and Genomes, Release 94.0, 1 April 2020) (http://www.kegg.jp).
PPI network
The PPI interaction networks were constructed by the software of STRING (search tool for recurring instances of neighboring genes) database (Version 11.0, released 19 January 2019) (http://string-db.org/), and Cytoscape (an open source platform for complex network analysis and visualization, Version 3.7.2) (https://cytoscape.org/).
Growth conditions and harvest of Arabidopsis root
According to the previous publication (Guo et al. Citation2014b), the ecotype Col-0 Arabidopsis thaliana seeds were germinated on the normal medium plate with 22/20 °C day/night, 8/16 h light/dark cycle, 60 μmol·m-2s-1 light intensity. After 7 days, the Arabidopsis seedlings were separately transferred into three stresses: cold-stress condition (8 °C), water-deprivation stress condition (200 mmol·L-1 mannitol), and salt stress condition (150 mmol·L-1 NaCl) for another 3 days growth. Then the Arabidopsis roots were harvested and stored at –80°C.
Enzyme activity assay
According to the previous method (Guo et al. Citation2019), peroxidase (POD) activity of Arabidopsis root was assayed using the kit (Nanjing Jiancheng Bioengineering Institute). Briefly, the POD activity was determined based on the catalyzing H2O2 of absorbance change at 420 nm. The plots were drawn with the software of Graphpad Prism 8 for windows (Version 8.0).
Results
Identification of salt-responsive DEGs in Arabidopsis root
In the present work, 16 salt-responsive experiments in Arabidopsis root were retrieved from the GEO database (). In the experiment of salt stress-1 (GSM184831, GSM184832, 107 GSM184839, GSM184840), 1437 down-regulated and 2033 up-regulated DEGs were screened in Arabidopsis root ((A)). In the experiment of salt stress-2 (GSM184833, GSM184834, GSM184841, GSM184842), 749 down-regulated and 1137 up-regulated DEGs were screened in Arabidopsis root ((B)). In the experiment of salt stress-3 (GSM184835, GSM184836, GSM184843, GSM184844), 1149 down-regulated and 1735 up-regulated DEGs were screened in Arabidopsis root ((C)). In the experiment of salt stress-4 (GSM184837, GSM184838, GSM184845, GSM184846), 1073 down-regulated and 929 up-regulated DEGs were screened in Arabidopsis root ((D)). In the experiment of salt stress-5 (GSM184889, GSM184890, GSM184891, GSM184907, GSM184908, GSM184909), 2251 down-regulated and 3558 up-regulated DEGs were screened in Arabidopsis root ((E)). In the experiment of salt stress-6 (GSM184892, GSM184893, GSM184894, GSM184910, GSM184911, GSM184912), 2506 down-regulated and 975 up-regulated DEGs were screened in Arabidopsis root ((F)). In the experiment of salt stress-7 (GSM184895, GSM184896, GSM184897, GSM184913, GSM184914, GSM184915), 2052 down-regulated and 6078 up-regulated DEGs were screened in Arabidopsis root ((G)). In the experiment of salt stress-8 (GSM184898, GSM184899, GSM184900, GSM184916, GSM184917, GSM184918), 815 down-regulated and 734 up-regulated DEGs were screened in Arabidopsis root ((H)). In the experiment of salt stress-9 (GSM184901, GSM184902, GSM184903, GSM184919, GSM184920, GSM184921), 3467 down-regulated and 1946 up-regulated DEGs were screened in Arabidopsis root ((I)). In the experiment of salt stress-10 (GSM184904, GSM184905, GSM184906, GSM184922, GSM184923, GSM184924), 2683 down-regulated and 1879 up-regulated DEGs were screened in Arabidopsis root ((J)). In the experiment of salt stress-11 (GSM184925, GSM184926, GSM184929, GSM184930), 738 down-regulated and 941 up-regulated DEGs were screened in Arabidopsis root ((K)). In the experiment of salt stress-12 (GSM218283, GSM218284, GSM218285, GSM218286), 876 down-regulated and 1212 up-regulated DEGs were screened in Arabidopsis root ((L)). In the experiment of salt stress-13 (GSM1126230, GSM1126231, GSM1126232, GSM1126236, GSM1126237, GSM1126238), 633 down-regulated and 774 up-regulated DEGs were screened in Arabidopsis root ((M)). In the experiment of salt stress-14 (GSM1126302, GSM1126303, GSM1126304, GSM1126308, GSM1126309, GSM1126310), 1409 down-regulated and 1026 up-regulated DEGs were screened in Arabidopsis root ((N)). In the experiment of salt stress-15 (GSM1126335, GSM1126336, GSM1126337, GSM1126338), 2034 down-regulated and 2284 up-regulated DEGs were screened in Arabidopsis root ((O)). In the experiment of salt stress-16 (GSM1824866, GSM1824867, GSM1824868, GSM1824869, GSM1824870, GSM1824871), 578 down-regulated and 595 up-regulated DEGs were screened in Arabidopsis root ((P)). Further, the RRA method was applied to integrate the above DEGs. As a result, 449 up-regulated and 387 down-regulated genes were screened as the salt-responsive DEGs of Arabidopsis root (, supplementary table 1).
Figure 1. Differential expression genes of Arabidopsis roots responding to salt stress. (A) GSM184831, GSM184832, GSM184839, GSM184840 data; (B) GSM184833, GSM184834, GSM184841, GSM184842 data; (C) GSM184835, GSM184836, GSM184843, GSM184844 data; (D) GSM184837, GSM184838, GSM184845, GSM184846 data; (E) GSM184889, GSM184890, GSM184891, GSM184907, GSM184908, GSM184909 data; (F) GSM184892, GSM184893, GSM184894, GSM184910, GSM184911, GSM184912; (G) GSM184895, GSM184896, GSM184897, GSM184913, GSM184914, GSM184915 data; (H) GSM184898, GSM184899, GSM184900, GSM184916, GSM184917, GSM184918 data; (I) GSM184901, GSM184902, GSM184903, GSM184919, GSM184920, GSM184921 data; (J) GSM184904, GSM184905, GSM184906, GSM184922, GSM184923, GSM184924 data; (K) GSM184925, GSM184926, GSM184929, GSM184930 data; (L) GSM218283, GSM218284, GSM218285, GSM218286 data; (M) GSM1126230, GSM1126231, GSM1126232, GSM1126236, GSM1126237, GSM1126238 data; (N) GSM1126302, GSM1126303, GSM1126304, GSM1126308, GSM1126309, GSM1126310 data; (O) GSM1126335, GSM1126336, GSM1126337, GSM1126338 data; (P) GSM1824866, GSM1824867, GSM1824868, GSM1824869, GSM1824870, GSM1824871 data. The red points represent up-regulated genes (fold change > 2.0, P-value < 0.05). The green points represent down-regulated genes (fold change < 0.5, P-value < 0.05). The black points represent unchanged genes difference.
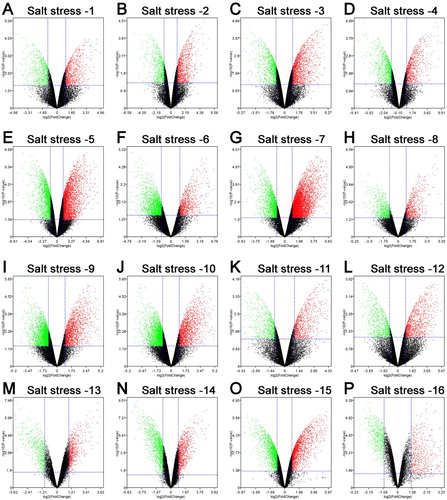
Figure 2. Hierarchial clustering of differential expression genes in Arabidopsis roots under salt stress. (A) GSM184831, GSM184832, GSM184839, GSM184840 data; (B) GSM184833, GSM184834, GSM184841, GSM184842 data; (C) GSM184835, GSM184836, GSM184843, GSM184844 data; (D) GSM184837, GSM184838, GSM184845, GSM184846 data; (E) GSM184889, GSM184890, GSM184891, GSM184907, GSM184908, GSM184909 data; (F) GSM184892, GSM184893, GSM184894, GSM184910, GSM184911, GSM184912; (G) GSM184895, GSM184896, GSM184897, GSM184913, GSM184914, GSM184915 data; (H) GSM184898, GSM184899, GSM184900, GSM184916, GSM184917, GSM184918 data; (I) GSM184901, GSM184902, GSM184903, GSM184919, GSM184920, GSM184921 data; (J) GSM184904, GSM184905, GSM184906, GSM184922, GSM184923, GSM184924 data; (K) GSM184925, GSM184926, GSM184929, GSM184930 data; (L) GSM218283, GSM218284, GSM218285, GSM218286 data; (M) GSM1126230, GSM1126231, GSM1126232, GSM1126236, GSM1126237, GSM1126238 data; (N) GSM1126302, GSM1126303, GSM1126304, GSM1126308, GSM1126309, GSM1126310 data; (O) GSM1126335, GSM1126336, GSM1126337, GSM1126338 data; (P) GSM1824866, GSM1824867, GSM1824868, GSM1824869, GSM1824870, GSM1824871 data.
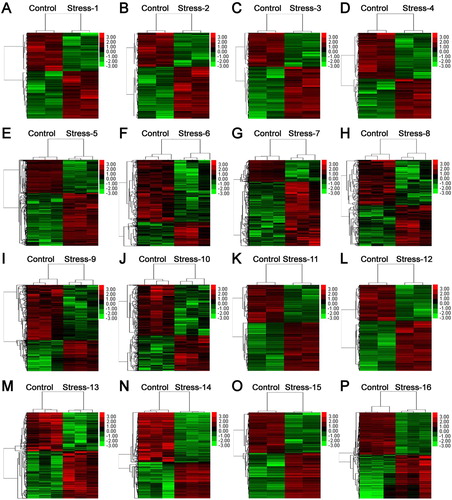
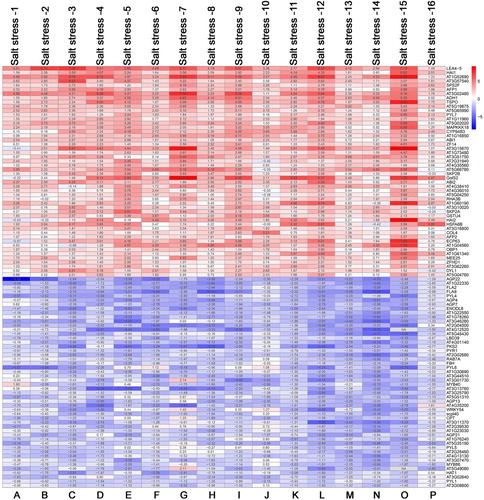
Figure 3. The LogFC heatmap image of representative differential salt-responding genes in Arabidopsis root. (A) GSM184831, GSM184832, GSM184839, GSM184840 data; (B) GSM184833, GSM184834, GSM184841, GSM184842 data; (C) GSM184835, GSM184836, GSM184843, GSM184844 data; (D) GSM184837, GSM184838, GSM184845, GSM184846 data; (E) GSM184889, GSM184890, GSM184891, GSM184907, GSM184908, GSM184909 data; (F) GSM184892, GSM184893, GSM184894, GSM184910, GSM184911, GSM184912; (G) GSM184895, GSM184896, GSM184897, GSM184913, GSM184914, GSM184915 data; (H) GSM184898, GSM184899, GSM184900, GSM184916, GSM184917, GSM184918 data; (I) GSM184901, GSM184902, GSM184903, GSM184919, GSM184920, GSM184921 data; (J) GSM184904, GSM184905, GSM184906, GSM184922, GSM184923, GSM184924 data; (K) GSM184925, GSM184926, GSM184929, GSM184930 data; (L) GSM218283, GSM218284, GSM218285, GSM218286 data; (M) GSM1126230, GSM1126231, GSM1126232, GSM1126236, GSM1126237, GSM1126238 data; (N) GSM1126302, GSM1126303, GSM1126304, GSM1126308, GSM1126309, GSM1126310 data; (O) GSM1126335, GSM1126336, GSM1126337, GSM1126338 data; (P) GSM1824866, GSM1824867, GSM1824868, GSM1824869, GSM1824870, GSM1824871 data. The value in the box is the logFC value, and ``NA'’ represent the P-value > 0.05.
Bioinformatics enrichment of salt-responsive DEGs in Arabidopsis root
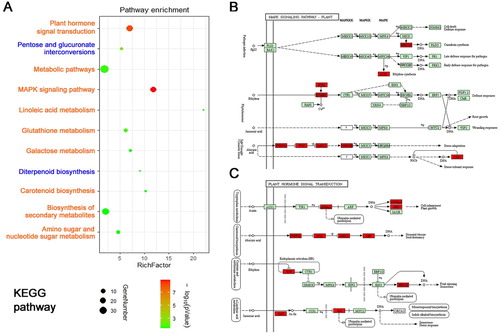
Bioinformatics tools were used to analyze the identified 449 up-regulated and 387 down-regulated genes. Regarding biological processes, the significantly enriched processes of up-regulated DEGs were related to regulation of transcription, protein dephosphorylation, response to oxidative stress ((A)), whereas, the significantly enriched processes of down-regulated DEGs were associated with cell wall organization, root hair elongation, sterol metabolic process ((B)). In terms of molecular function, the significantly enriched functions of up-regulated DEGs were related to transcription factor activity, glutathione transferase activity, kinase activity ((C)), whereas, the significantly enriched functions of down-regulated DEGs were associated with phosphatase inhibitor activity, pectinesterase inhibitor activity, heme binding ((D)). KEGG analysis indicated the up-regulated DEGs were involved in plant hormone signal transduction, metabolic pathways, MAPK signaling pathway, linoleic acid metabolism, glutathione metabolism, galactose metabolism, carotenoid biosynthesis, biosynthesis of secondary metabolites, amino sugar and nucleotide sugar metabolism, and the down-regulated DEGs mainly participated in pentose and glucoronate interconversions, and diterpenoid biosynthesis ().
Figure 4. GO classification of differential salt-responding genes in Arabidopsis root. (A) biological process classification of up-regulated salt-responsive genes, (B) biological process classification of down-regulated salt-responsive genes, (C) molecular functional classification of up-regulated salt-responsive genes, (D) molecular functional classification of down-regulated salt-responsive genes.
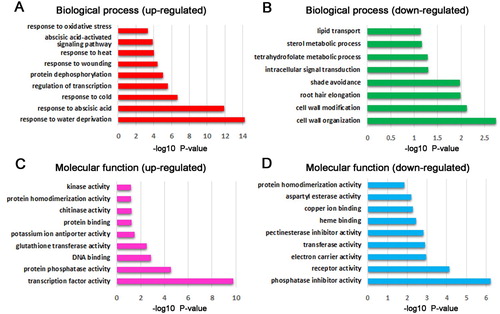
Figure 5. KEGG analysis of differential salt-responding genes in Arabidopsis root. (A) KEGG enrichment analysis of up-regulated genes (yellow colored) and down-regulated genes (blue colored) in Arabidopsis root. Circle size represents the number of genes, and circle color represents the P-value, (B) the representative up-regulated MAPK signaling pathway in Arabidopsis root, (C) the representative up-regulated hormone signal transduction pathway in Arabidopsis root.
PPI network and cross-talk of salt-responsive DEGs in Arabidopsis root
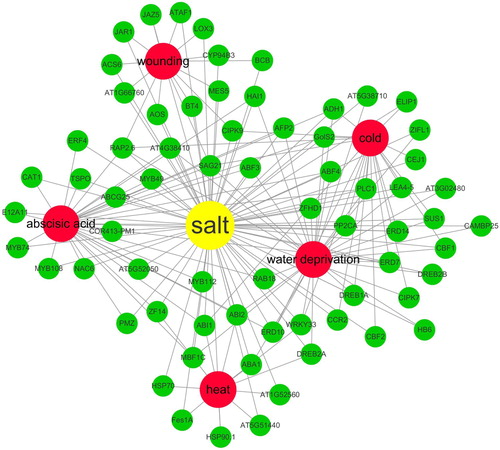
Totally, 449 up-regulated salt-responsive DEGs were connected with 879 edges (PPI enrichment p-value: < 1.0e-16) by STRING (). In addition, the complicated cross-talks of up-regulated salt-responsive genes with wounding stress, cold stress, abscisic acid stress, heat stress, and water deprivation stress in Arabidopsis root were shown with Cytoscape ().
Figure 6. PPI networks of the up-regulated salt-responsive genes in Arabidopsis root.
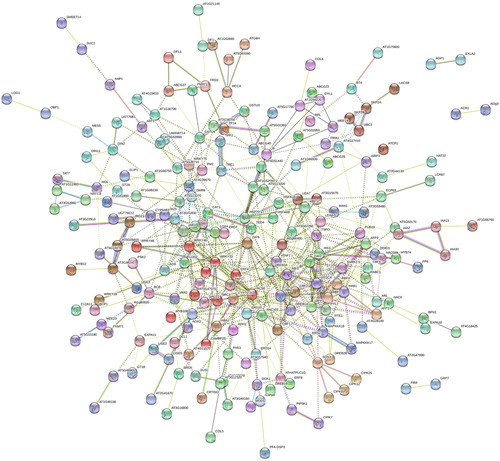
Figure 7. The cross-talks of salt-responsive genes with other stress-responsive proteins in Arabidopsis thaliana root. (The curated databases, experimentally determined, gene neighborhood, gene fusions, gene co-occurrence, textmining, co-expression, and protein homology).
POD activity determination in Arabidopsis root under salt, cold, and water deprivation stress
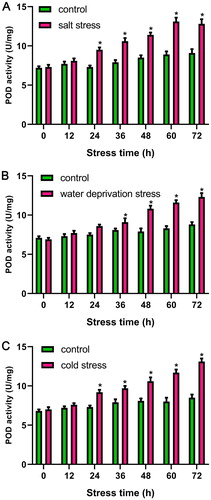
Our results showed POD was not only an up-regulated salt-responsive gene, but also was involved in other stresses. Therefore, POD activity of Arabidopsis root were determined under three stresses (salt, cold, and water deprivation stress) to confirm the confidence of bioinformatics prediction. The results indicated that compared with the stress-free control, POD activity was all increased at different time points (12, 24, 36, 48, 60, 72 h) under salt, cold, and water deprivation stresses ().
Figure 8. Antioxidative enzyme POD activity in Arabidopsis root under different stresses. (A) Salt stress, (B) cold stress, (C) water deprivation stress.
Discussion
Salt stress limits plant growth and decreases crop output on the earth. Many works have been done to improve the salt-tolerance of plants (Shah et al. Citation2018). Although several plants have been used as materials, Arabidopsis is the most ideal model to demonstrate the salt-response mechanisms (Zhang et al. Citation2018). The root of Arabidopsis was an organ dealing with salt stress directly. Therefore, many researches about salt adaption in the Arabidopsis root have been performed. For example, phosphorylation dynamics in Arabidopsis roots proteins have been detected, and 77 novel phosphorylated sites were found, which might be involved in lipid signaling under abiotic stress responses (Vialaret et al. Citation2014). Another experiment about the Arabidopsis root response to various long-term salt stress indicated that significant changes in both physiological and proteome level have occurred (Carrera et al. Citation2018).
Although some work has explored the molecular mechanisms of plant salt-tolerance, more researches are still needed to provide further information. In the present work, we used an integrated approach to disclose how the plant deals with salt at the transcription level. In comparison with the proteomic data, we considered the transcription data could give the complementary information to facilitate our better understanding on the plant salt-response.
Here, to overcome and minimize the heterogeneity of results caused by different experimental conditions, 16 salt-responsive experiments in Arabidopsis root were retrieved from GEO database. To integrate the DEGs results more efficiently, the RRA method has been used to screen the DEGs list. As the result, 836 dysregulated genes including 449 up-regulated and 387 down-regulated genes were defined as the salt-responsive DEGs in the Arabidopsis root.
Based on the analysis of bioinformatics tools, both up-regulated DEGs and down-regulated DEGs were involved in different biological process, molecular function and KEGG pathway. For example, in the up-regulated DEGs, response to oxidative stress was a significantly enriched biological process, and glutathione metabolism was a significantly enriched KEGG pathway. Usually, salt stress will attenuate the electron transport chain and produce excessive ROS, such as hydrogen peroxide, hydroxyl radicals, and superoxide radicals (Miller et al. Citation2010). ROS scavenging-related enzymes including glutathione S-transferase family (Chan and Lam Citation2014) and POD (Islam et al. Citation2015) were activated to maintain the balance of redox homeostasis in plant cells. In the present work, POD, glutathione S-transferase tau 2 (GSTU2), glutathione S-transferase tau 3 (GSTU3), glutathione S-transferase tau 4 (GSTU4), glutathione S-transferase tau 5 (GSTU5), glutathione S-transferase tau 6 (GSTU6), glutathione S-transferase tau 9 (GSTU9), Glutathione S-transferase family protein (ERD9) were all up-regulated in response to the salt stress.
Based on the annotation of PPI network, some DEGs were involved in several stresses, which was named stress cross-talk (Tuteja Citation2007). A previous work has reported that some salt-inducible genes were related to the cold stress (Seki et al. Citation2002). In the present work, the cross-talk of different stresses were more complicated than the previous finding. The salt-responsive DEGs were associated in wounding stress, cold stress, abscisic acid stress, heat stress, and water deprivation stress, which dramatically improved our understanding on salt-tolerance mechanisms in Arabidopsis root. To validate the cross-talk among different stresses, the enzyme activity of POD in root was assayed under salt stress, cold stress and water deprivation stress, individually. And the results agreed with the stress cross-talk prediction from the integrated bioinformatics analysis.
Conclusion
This work gave new light on the understanding of salt responses in Arabidopsis root. Those pathways, PPI networks, stress cross-talking would provide more important information to discover the potential salt-responsive biomarkers. In the future, more work is still needed to explore the functions of DEGs to better improve plant growth and crop output.
Supplemental Material
Download MS Excel (166.2 KB)Disclosure statement
No potential conflict of interest was reported by the author(s).
Additional information
Funding
Notes on contributors
Meili Guo
Meili Guo is an Associate Professor of Food and Biochemistry Engineering Department at Yantai Vocational College. Her research interest focuses on Arabidopsis growth and development, and the responses to abiotic stress responses.
Xin Liu
Dr Xin Liu is an Associate Professor of Central Laboratory at the Affiliated Yantai Yuhuangding Hospital of Qingdao University. His research interest focuses on genomics, proteomics and bioinformatics.
Lei Li
Lei Li is a lecturer of Medical Experiment and Test Center at Capital Medical University. Her research interest focuses on genomics, proteomics and bioinformatics.
Yusu Jiang
Yusu Jiang is a lecturer of Food and Biochemistry Engineering Department at Yantai Vocational College. Her work focuses on investigations of plant growth and development, and stress physiology in plants.
Xuejuan Yu
Xuejuan Yu is an Associate Professor of Food and Biochemistry Engineering Department at Yantai Vocational College. Her research interest focuses on plant physiology.
Tao Meng
Tao Meng is an assistant lecturer of Food and Biochemistry Engineering Department at Yantai Vocational College. His work focuses on plant physiology and plant abiotic stress responses.
Chunxi Zhou
Dr Chunxi Zhou is an Associate Professor of Beijing office at Bruker Daltonics Inc. His research interest focuses on genomics, proteomics and bioinformatics.
References
- Carrera DÁ, Oddsson S, Grossmann J, Trachsel C, Streb S. 2018. Comparative proteomic analysis of plant acclimation to six different long-term environmental changes. Plant Cell Physiol. 59(3):510–526. doi: 10.1093/pcp/pcx206
- Chan C, Lam HM. 2014. A putative lambda class glutathione S-transferase enhances plant survival under salinity stress. Plant Cell Physiol. 55(3):570–579. doi: 10.1093/pcp/pct201
- Guo M, Yang A, Zhou C, Liu X. 2012a. The new understanding of Arabidopsis thaliana proteins associated with salinity. J Plant Interact. 7(4):348–355. doi: 10.1080/17429145.2011.640438
- Guo ML, Gao WX, Li L, Li H, Xu YL, Zhou CX. 2014a. Proteomic and phosphoproteomic analyses of NaCl stress-responsive proteins in Arabidopsis roots. J Plant Interact. 9(1):396–401. doi: 10.1080/17429145.2013.845262
- Guo ML, Gao WX, Yu XJ, Zhou CX, Liu FJ, Liu X. 2012b. Data mining of Arabidopsis thaliana salt-response proteins based on bioinformatics analysis. Plant Omics. 5(2):75–78.
- Guo ML, Li H, Li L, Cheng XM, Gao WX, Xu YL, Zhou CX, Liu FJ, Liu X. 2014b. Comparative proteomic analysis of Arabidopsis thaliana roots between wild type and its salt-tolerant mutant. J Plant Interact. 9(1):330–337. doi: 10.1080/17429145.2013.833653
- Guo ML, Liu X, Wang JH, Li L, Zhang WD, Gong BJ, Zhang CL, Zhou CX. 2019. Investigation on salt-response mechanisms in Arabidopsis thaliana from UniProt protein knowledgebase. J Plant Interact. 14(1):21–29. doi: 10.1080/17429145.2018.1551581
- Islam T, Manna M, Reddy MK, Wu K. 2015. Glutathione peroxidase of Pennisetum glaucum (PgGPx) Is a functional Cd2+ dependent peroxiredoxin that enhances tolerance against salinity and drought stress. PLoS One. 10(11):e0143344. doi: 10.1371/journal.pone.0143344
- Miller G, Suzuki N, Ciftci-Yilmaz S, Mittler R. 2010. Reactive oxygen species homeostasis and signalling during drought and salinity stresses. Plant Cell Environ. 33(4):453–467. doi: 10.1111/j.1365-3040.2009.02041.x
- Niu C, Jiang M, Li N, Cao JG, Hou MF, Ni D, Chu ZQ. 2019. Integrated bioinformatics analysis of As, Au, Cd, Pb and Cu heavy metal responsive marker genes through Arabidopsis thaliana GEO datasets. Peer J. 7:e6495. doi: 10.7717/peerj.6495
- Seki M, Narusaka M, Ishida J, Nanjo T, Fujita M, Oono Y, Kamiya A, Nakajima M, Enju A, Sakurai T, et al. 2002. Monitoring the expression profiles of 7000 Arabidopsis genes under drought, cold and high-salinity stresses using a full-length cDNA microarray. Plant J. 31(3):279–292. doi: 10.1046/j.1365-313X.2002.01359.x
- Shah T, Xu J, Zou X, Cheng Y, Nasir M, Zhang X. 2018. Omics approaches for engineering wheat production under abiotic stresses. Int J Mol Sci. 19(8):2390. doi: 10.3390/ijms19082390
- Tuteja N. 2007. Mechanisms of high salinity tolerance in plants. Methods Enzymol. 428:419–438. doi: 10.1016/S0076-6879(07)28024-3
- Vialaret J, Di Pietro M, Hem S, Maurel C, Rossignol M, Santoni V. 2014. Phosphorylation dynamics of membrane proteins from Arabidopsis roots submitted to salt stress. Proteomics. 14(9):1058–1070. doi: 10.1002/pmic.201300443
- Zhang S, Yang R, Huo Y, Liu S, Yang G, Huang J, Zheng C, Wu C. 2018. Expression of cotton PLATZ1 in transgenic Arabidopsis reduces sensitivity to osmotic and salt stress for germination and seedling establishment associated with modification of the abscisic acid, gibberellin, and ethylene signalling pathways. BMC Plant Biol. 18(1):218. doi: 10.1186/s12870-018-1416-0