
 ?Mathematical formulae have been encoded as MathML and are displayed in this HTML version using MathJax in order to improve their display. Uncheck the box to turn MathJax off. This feature requires Javascript. Click on a formula to zoom.
ABSTRACT
Additive manufacturing is progressively paving the way for optimised lightweight components that, due to their typically complex shape, would hardly be feasible with traditional production methods. However, the peculiar mechanical properties of additively manufactured materials limit the accuracy of structural analyses. In this research, a strategy for the implementation of thickness dependent anisotropy into finite element shell models is developed by example of laser sintered polyamide. The material behaviour was modelled by fitting parametric functions to experimental data. Subsequently, a routine was developed to map the adaptive material properties into a finite element model of a complex component. Numeric simulations with standard and mapped properties were compared and validated via experiments. Results show that the proposed approach is superior to the conventional method in predicting the structural response. The method is not only applicable to laser sintered polymers but relevant for all structures, where anisotropy and thickness must be considered.
1. Introduction
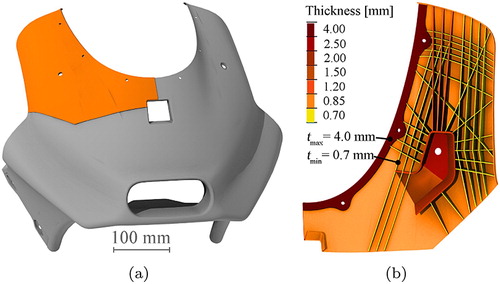
Additive manufacturing (AM) technologies yield the potential to produce rapid prototypes and even unique or small-series functional components of unprecedented complexity in short lead times (Wang et al. Citation2016, Citation2021). Industries like the automotive, aerospace and biomedical, where requirements for lightweight solutions often require intricate thin-walled shell structures, could profit from the design freedom offered by AM. Marschall et al. (Citation2020), who investigated polyamide 12 (Pa12) lattice structures, proposed that laser sintering (LS) of functional racing motorcycle front fairing prototypes, as visualised in (a), would allow immediate validation of the aerodynamically optimised and ergonomically customised designs on the race track, thereby significantly shortening the development process compared to conventional approaches using fibre reinforced plastics.
Figure 1. Illustration of (a) racing motorcycle front fairing as well as (b) considered segment in back view showing the socket for mounting on the vehicle and the ribbed reinforcement substructure with exemplary indication of wall thicknesses.
To qualify as functional prototypes, first, additively manufactured components have to fulfil dimensional accuracy criteria, which are often compromised by geometrical distortions as a consequence of residual stresses that can emerge during production. In order to overcome such issues, the field of process simulation in additive manufacturing has gained special attention in recent years (Lindgren et al. Citation2016; Ning et al. Citation2019, Citation2020a, Citation2020b).
In the present research, however, another topic is in focus. It concerns the requirement that the parts have to withstand the aerodynamic load occurring during racing situations without deforming excessively. Therefore, the structures must be assessed in terms of stiffness prior to production. This is typically performed using numeric finite element (FE) methods that, despite being more computationally expensive than for instance analytic approaches, enable analysis of geometries with highest complexity. In AM, however, FE simulations based on conventional material models fail to predict the structural response observed in experimental testing of components (Wang et al. Citation2020a), which can be traced back to the peculiar mechanical material behaviour inherent in additively manufactured structures.
Besides the dependency on production process parameters such as laser settings, chamber temperature or layer thickness (Wegner and Witt Citation2012; Stichel et al. Citation2018; Raja et al. Citation2019) and position within the build room (Cooke et al. Citation2011; Goodridge, Tuck, and Hague Citation2012; Tasch et al. Citation2018), the mechanical material properties are typically anisotropic and for thin structures furthermore severely dependent on the local thickness of the geometry. The latter being decisive for structural lightweight design, where often thin-walled members are employed (Pham et al. Citation2019).
Structural anisotropy is characteristic for additively manufactured parts and is believed to derive from the layer-wise build process that leads to an alignment of pores and un-molten particles in the layer interfaces (Dupin et al. Citation2012; Dewulf et al. Citation2016; Stichel et al. Citation2017; Wang et al. Citation2019a, Citation2019b; Bain et al. Citation2019; Sindinger et al. Citation2020). In , a volume element exhibiting such a layered composition is illustrated. In such a structure, a single axis of rotational symmetry exists, which coincides with the build direction (z) of the AM system (Amado-Becker et al. Citation2008; Zou et al. Citation2016; Lindberg et al. Citation2018; Zhao, Chen, and Zhou Citation2019). This axis is perpendicular to the layers, each lying in a plane of isotropy, parallel to the xy-oriented build platform. Based on these assumptions only two principal directions, namely parallel (∥) and orthogonal (⊥) to the layers, exist.
Figure 2. Volume element with principal material directions indicated via ∥- and ⊥-symbols.
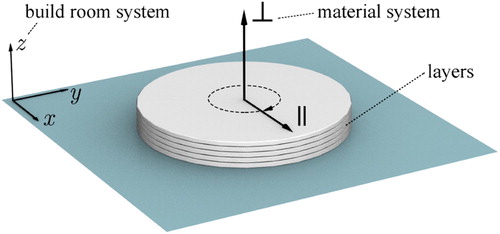
The aforementioned defect accumulations at the layer interfaces represent regions of poor bonding that in case of LS Pa12, result in a reduction (>11 %) of the mechanical material performance in ⊥-direction, including stiffness, strength and ductility, when compared to the in-plane loading case (Caulfield, McHugh, and Lohfeld Citation2007; Rüsenberg, Josupeit, and Schmid Citation2014; Ajoku et al. Citation2016; Lammens et al. Citation2017; Bain et al. Citation2019). Moreover, it was revealed that samples fabricated in different directions parallel to the build platform exhibit similar properties (Cooke et al. Citation2011), which is in synergy with the assumed existence of isotropic planes in the layered volume element.
So called, transverse isotropy is characteristic for various engineering materials, such as fibre-reinforced plastic uni-directional plies or fleece mat laminates (Schürmann Citation2007; Barbero Citation2017) and has already been proven to yield good results for modelling the linear elastic response in AM (Amado-Becker et al. Citation2008; Zou et al. Citation2016; Lindberg et al. Citation2018; Zhao, Chen, and Zhou Citation2019). In linear elasticity, the stresses and strains
are related by Hooke's law
=C
, where in transverse isotropy the number of independent constants in the stiffness matrix C is reduced from 21 for full (triclinic) anisotropy to 5. Thus for the additively manufactured volume element () the compliance matrix C
is given in engineering notation by Equation (Equation1
(1)
(1) ),
(1)
(1) with the engineering constants Young's modulus E, Poisson's ratio ν and shear modulus G. These govern the mechanical behaviour with indices denoting the previously defined directions in sequence of cause and effect. Thereby,
and
correspond to the intra-layer behaviour, while
and
are associated with loading perpendicular to the layers (i.e. inter-layer). Young's modulus as well as Poisson's ratio can be directly determined in uni-axial tensile tests and thereof, a reasonable approximation of the shear modulus
can be calculated (Faes et al. Citation2017; Lindberg et al. Citation2018) (see Section 2.4.2).
Another characteristic of additively manufactured structures is the drastic dependency on local part thickness, which was reported not only for LS (Tasch et al. Citation2018; Wörz and Drummer Citation2018; Sindinger et al. Citation2020) but also for other polymer-based processes (Bell and Siegmund Citation2018) and common metal-based AM technologies including selective laser melting (Brown, Everhart, and Dinardo Citation2016; Barba et al. Citation2020), electron beam melting (Algardh et al. Citation2016; Wang et al. Citation2020b) and laser powder bed fusion (Roach et al. Citation2020). Tasch et al. (Citation2018) disclosed a distinct drop of almost 40 % in Young's modulus () from a thickness of 2 to 0.6 mm in LS Pa12 tensile coupons built in z-direction. Between 2 and 4 mm Young's modulus registered a further increase but at a flatter slope, indicating a transition from thin-walled to bulk properties that is supported by findings of Majewski and Hopkinson (Citation2011), who reported a plateau between 4 and 6 mm. Sindinger et al. (Citation2020), who on coupon level investigated the effects of build orientation and part thicknesses on the mechanical material behaviour as well as their origin, did not only confirm this non-linear relation of Young's modulus and part thickness but furthermore revealed that the degree of anisotropy is not constant. In fact, the loading direction-dependent differences become more pronounced for thin specimens. The origins of the thickness dependency are more elusive than the ones for anisotropy mentioned above. Explanations have been contributed to effects that are more negligible for thick parts but become critical as the cross-section decreases. These, to a minor degree, were attributed to a reduction of effective load bearing area, due to surface roughness and internal voids, as well as process condition-induced inhomogeneous microstructure over the cross-section, which is stipulated to play the principal role (Algardh et al. Citation2016; Brown, Everhart, and Dinardo Citation2016; Wörz and Drummer Citation2018; Tasch et al. Citation2018; Bell and Siegmund Citation2018; Sindinger et al. Citation2020; Barba et al. Citation2020; Roach et al. Citation2020; Wang et al. Citation2020b).
As previously stated, in component development processes, simulations are indispensable to virtually asses the structural response of a part before its production in order to save time and resources. While material models capable to implement transverse isotropy (Lindberg et al. Citation2018) and other types of directional behaviour (Domingo-Espin et al. Citation2015) are standard in commercial FE simulation tools, the drastic thickness dependency of the elastic constants is not available. Consequently, the structural response prediction of additively manufactured lightweight components featuring thin structures deviates severely from the actual performance evaluated in physical experiments, as was recently concluded (Wang et al. Citation2020a).
Hence, it is the aim of the present study to develop and validate a novel material property mapping strategy that for the first time allows the implementation of thickness dependent anisotropy in FE analysis of thin-walled additively manufactured components. Therefore, elastic constants derived from uni-axial tensile tests of a preceding study by Sindinger et al. (Citation2020) serve as foundation for a new approach to model the characteristic material response. Subsequently, a routine is established that automatically maps adjusted material properties to an FE model that is used to analyse the load–displacement behaviour in the elastic regime. Within the scope of this research, models based on shell elements are considered, since these are typically used for structural simulation of thin-walled lightweight constructions. As demonstrator part, an unpublished section of a racing motorcycle front fairing depicted in (b) is chosen, which consists of a thin skin supported by a ribbed sub-structure featuring various wall thicknesses. Ultimately, the front fairing was manufactured and mechanically loaded to validate the proposed modelling approach on component level. Herein, the entire process is based on the LS technology using PA12. Nevertheless, the proposed strategy, encompassing extended experimental characterisation, material modelling and FE model property mapping, is applicable to all manufacturing processes and materials, where thin shells exhibit thickness-dependent anisotropy.
2. Materials and methods
2.1. Sample fabrication
Within the scope of this study, samples of two build jobs were considered featuring coupons for the determination of elastic material constants and components for the experimental validation of the numerical simulations, respectively. The build job comprising dog-bone shaped tensile bars constitutes the foundation of an ongoing research project investigating the structural response of additively manufactured structures. Thereof, data has already been published in a study by Sindinger et al. (Citation2020), where also the build layout is detailed. The present study builds upon tensile coupons that were produced in compliance with ISO 527 (Citation2012) in four different thicknesses (4.0, 2.0, 1.0, 0.6 mm), depicting the range apparent in the fairing component (b) as well as the minimum wall thickness achievable with the system. Per thickness, three build orientations (0, 45 and 90 ) were considered that correspond to the inclination angles ϕ between the principal coupon axis and the powder bed (xy-plane), as indicated in (a). Five samples per thickness and build orientation were considered in this research, summing up to a total of 60 specimens. Hereby, the considered thicknesses and orientations represent a fundamental selection given the available resources, rather than a comprehensive sample set.
Figure 3. Rendering of (a) coupon orientations (Sindinger et al. Citation2020) with ϕ indicating the inclination angle to the build layer plane (xy) and consequently the loading direction (red arrows) as well as (b) component build layout.
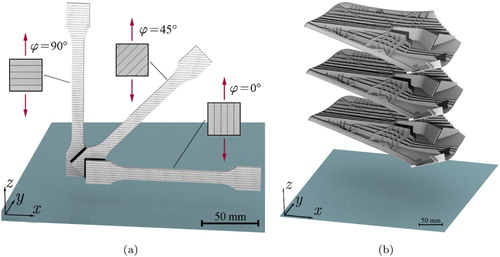
The build layout of the three component samples is illustrated in (b). Parts were stacked in vertical direction as well as oriented with the attachment hole axis parallel to the global z- and a straight longitudinal rib along the x-direction. Defining the build orientation of the components in a replicable manner is essential, as it subsequently determines the material coordinate system for the structural simulation. All samples were produced in a central region of the build room in order to avoid excessive scatter in the mechanical material properties that can occur close to the corners of the chamber (Tasch et al. Citation2018).
Both coupons and components were produced on an EOS P396 LS system (EOS GmbH, Munich, Germany) from EOS PA2200 PA12 powder which, according to the supplier, has a median particle size of 54.4 μm. As representative for industrial practice, a 50/50 mixing ratio of virgin and aged material was used. The melt volume flow rate of the powder mix was determined according to ISO 1133 (Citation2012) and VDI 3405 (Citation2019) using a ZwickRoell 4106 extrusion plastometer (ZwickRoell GmbH & Co. KG, Ulm, GER) at 235 C with a mass of 5 kg. It amounted to 43.5 cm
/10 min which indicates adequate powder quality for a 50/50 mixing ratio (Rüsenberg, Josupeit, and Schmid Citation2014; Wegner et al. Citation2014).
Standard system settings were used for the two build jobs comprising a powder layer thickness of 0.12 mm, a build chamber temperature of 173 C and an alternating xy-hatch grid with a single contour scan. For cross-sections close to the minimum achievable thickness, like the 0.6 mm coupons, solely a single scan line of the edge laser parameter set is used (for further details on the laser pattern of thin structures for the considered EOS system, see Sindinger et al. (Citation2020)). The laser characteristics employed for coupon as well as component fabrication are summarised in . After extraction of the samples from the machine, excess powder was removed using a brush and pressurised air. Subsequently, specimens were sealed in vacuum bags and stored at room temperature until experimental testing.
Table 1. Laser parameters.
2.2. 3D-scanning of components
Since geometrical distortions are common in AM and hence, constitute a potential source of variability in the experimental test results, the dimensional accuracy of the components was evaluated after fabrication. Therefore, 3D scans of the fairing surface, obtained at a resolution of 0.075 mm via an HP-L-20.8 laser scanning system (Hexagon, Stockholm, Sweden), were overlayed with the CAD models used for production and the deviations in mm recorded.
2.3. Physical experiments
2.3.1. Tensile coupon test
As aforementioned, the tensile test data is deduced from an ongoing research that, in part, was published in Sindinger et al. (Citation2020). Young's moduli, ,
and
, where the index corresponds to the loading direction with respect to the isotropic plane, were determined via uni-axial tensile tests in compliance with ISO 527 (Citation2012) at a test speed of 1 mm/min using a ZwickRoell Z100 testing machine. Therefore, the slopes of the stress–strain curves were evaluated by means of linear regression in the region until 0.25 % strain.
In addition to the tensile test data detailed in Sindinger et al. (Citation2020), the Poisson's ratio was evaluated and presented in the present research. Therefore, a stereo digital image correlation (DIC) system computed the strain fields in the gauge length of the specimens, by frame-wise comparison of an un-deformed reference image with the displacement in a speckle pattern that was applied to the coupon surface using an airbrush. This yields the strain in principal and traversal coupon axes
, which based on
allows a contactless evaluation of the Poisson's ratios ν for the different build angles (Faes et al. Citation2017; Lammens et al. Citation2017). The DIC setup consisted of two monochrome 5 MP cameras (Grasshopper3, FLIR Integrated Imaging Solutions, Inc., Wilsonsville, OR, USA), recording at a frame rate of 2 Hz in conjunction with the post-processing software Vic-3D 9 (Correlated Solutions Inc., Irmo, SC, USA). The pixel size for the region of interest amounted to 0.016 mm. The analysis was set up utilising a subset size of 29 × 29 pixels and a step size of 3, implying that every third pixel within the region of interest is considered for correlation. Per condition five samples were evaluated.
2.3.2. Component test
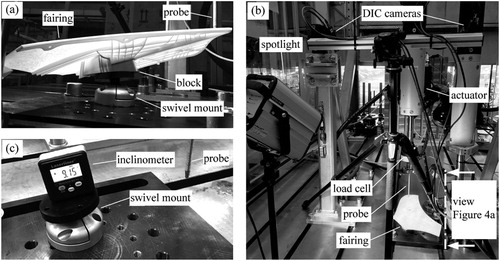
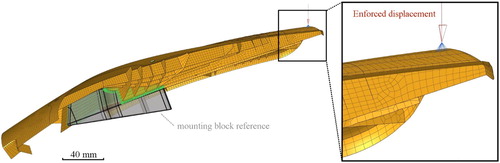
For component testing, each fairing was bonded to a machined aluminium block that resembled the attachment geometry of a racing motorcycle, using a two component epoxy-based adhesive (Loctite EA 9466; Henkel AG & Co. KGaA, Düsseldorf, GER) in order to ensure permanent surface contact and therefore, constant support conditions during loading. The block was screwed onto a swivel mount (GK12; MM Engineering GmbH, Baiern, GER) that itself was attached to the test bed, as displayed in (a). In this generic load case, the load was introduced via a steel probe with semi-spherical tip that was actuated by a 5 kN servo-hydraulic cylinder (ZwickRoell LH 5) featuring a 5 kN load cell (ZwickRoell DR-F). The load introduction point was chosen to be on the outer fairing surface close to the edge and above a central longitudinal rib. The displacement controlled test protocol consisted of a 1 mm/min ramp until a displacement of 5 mm, dwelling for 5 s and return to the initial position. During loading, the force at the steel probe was recorded via load cell in actuator displacement direction. For computation of strains on the fairing surface, a speckle pattern was applied and the stereo DIC system described in the previous section captured images at 2 Hz in a top down view, as can be seen in (b), where the test setup is displayed. The pixel size for the component setup that featured a larger area of interest amounted to 0.097 mm, the subset and step sizes were 21 and 3 pixels, respectively. Additionally, a camera (EOS 2000D, Canon Inc., Tokyo, JPN) was placed underneath the fairing and recorded a video of the sub-structure to monitor the structural response of the reinforcement ribs during loading. To enable comparability between experiment and subsequent FE analysis, the orientation of the swivel mount with respect to the test platform was recorded using a digital inclinometer (Laseriner; UMAREX GmbH & Co. KG, Arnsberg, GER) ( c). This information is later on used to define the load direction in the numerical simulation. All samples were tested in as-built condition at room temperature in the testing facilities of the Institute of Structural Lightweight Design at Johannes Kepler University Linz.
Figure 4. Depiction of (a) fixture with sample glued onto a machined aluminium block that is screwed onto a swivel mount and loaded via indenter probe. (b) Entire setup with servo-hydraulic actuator, DIC cameras and spotlight. (c) Inclinometer for recording the swivel mount orientation.
2.4. Numerical investigation
2.4.1. Finite element model setup
Discretisation of the thin-walled fairing section was performed in the commercial FE pre-processor HyperMeshTM 2019 (Altair Engineering, Inc., Troy, USA). Therefore, the CAD geometry was imported and the global coordinate system defined according to the build orientation during the AM process. Subsequently, its middle surface was extracted and a mesh generated using 2D first-order quadrilateral elements. These automatically contain the thickness of the shell structure, which is convenient as it would be a non-trivial task to obtain this information for 3D element-based models.
The boundary conditions were set up according to the experimental component test setup. Fairing nodes were constrained by degrees of freedom 1 to 6 in the area where the attachment socket was bonded to the mounting block, as indicated by the green icons in . The load was modelled as an enforced displacement of 5 mm that was introduced via a set of one-dimensional (RBE3) elements (, blue) and applied incrementally. The direction of the load was defined based on the angles acquired via inclinometer during the physical experiments. As output, the magnitude of the 3D displacement D and reaction force F vectors at the load introduction point as well as the von Mises strain at the fairing skin surface were defined. To be able to run an analysis, the material properties must be assigned, which will be elaborated in-depth in the next section. A non-linear analysis was set up that accounts for geometric non-linearities, due to potential buckling of the ribs in the reinforcement substructure of the fairing. The solutions were computed using the OptistructTM solver.
Figure 5. FE model with 2 mm mesh size, constrained nodes at block contact in green and detail enforced displacement direction indicated by red arrow with corresponding multi-point constraints in blue.
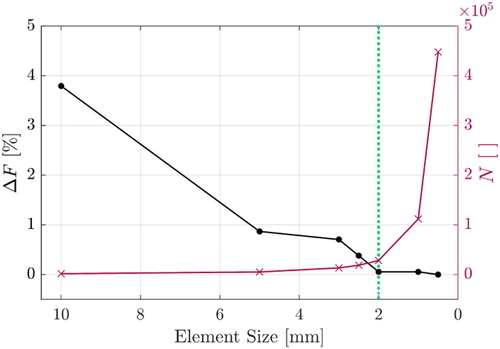
It is known that in FE analysis, the mesh can affect the solution accuracy. Hence, a mesh convergence study in the linear elastic regime was performed by varying the element size as shown in . The graph shows that below element sizes of 2 mm only a marginal change in the structural response prevails, that however, comes with a drastically increased number of elements. For the present investigation, an element size of 2 mm was chosen, as it yields high precision at a reasonable number of elements (i.e. 28,244).
Figure 6. Mesh convergence with normalised deviation of reaction force for 1.5 mm displacement at load location on the left and number of elements (N) on the right axis with chosen size (dotted line).
2.4.2. Material modelling and mapping
As Schürmann (Citation2007) and Barbero (Citation2017) elaborate, stresses in thin shells become negligibly small in thickness direction, yielding that solely in-plane engineering constants are needed to describe the macroscopic linear elastic response. According to this simplification, a transversal isotropic material for a shell element can be formulated based on the inverse of the reduced stiffness matrix given for local element 1,2,3-coordinates in Equation (Equation2
(2)
(2) ),
(2)
(2) which requires only four independent variables for its definition. For elements where the local 1-direction is parallel to global z, the parameters
and
are equal to
and
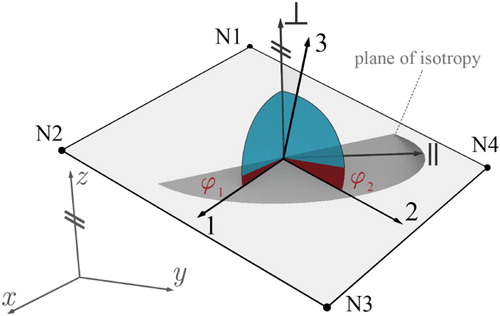
, respectively. The illustration in , however, indicates that in an arbitrarily oriented element the local 1,2,3-coordinate system, which is defined based on the element normal (3-axis) and the direction from first to second node, does not coincide with the global x,y,z-axes. Consequently, the element system is also not aligned with the principal directions ∥ and ⊥ of the transversely isotropic material.
Figure 7. Schematic of shell element with nodes N1-4, local 1,2,3-, global x,y,z- and axisymmetric material -coordinate system as well as out-of-plane angles ϕ for the respective element directions.
This entails that for instance for a shell element's not the in-plane Young's modulus of the material
, which corresponds to the global xy-plane can be used, but it has to be transformed based on the out-of-plane angle ϕ. Due to the assumption of transverse isotropy, only ϕ for the 1- and 2-direction needs to be considered, while rotations about the z-axis can be disregarded.
Since the material properties are not only dependent on ϕ but additionally non-linearly on element thickness, a model is developed that reflects this thickness-dependent directional elastic response. For approximation of the dependency of Young's modulus and Poisson's ratio on thickness, parametric functions were fitted to the experimental data obtained in the coupon tests using the non-linear least squares method in the curve fitting toolbox of MATLAB 2018b (The MathWorks, Inc., Natick, USA). Out of various investigated variants, one function per elastic material parameter was selected based on complexity and goodness of fit, with corresponding coefficient of determination data given in (Section 3.2). The ultimately employed functions are detailed in the subsequent paragraphs. For merging the thickness and directional dependency into a single model, a polynomial-based interpolation approach was pursued, as described further below.
Table 2. Coefficient of determination  .
.
In LS Pa12, the characteristic thickness dependency of Young's modulus for thin-walled coupons of an inclination was disclosed by Tasch et al. (Citation2018), who reported rapid growth as specimen thickness increases, before levelling off towards 4 mm. Sindinger et al. (Citation2020) revealed similar progressions for other build orientations as well. The upper asymptote can be interpreted as bulk Young's modulus since it was shown for LS Pa12 that a further increase in thickness does not lead to a considerable deviation (Majewski and Hopkinson Citation2011). In the present research, to model the relation of Young's modulus E and section thickness t a Weibull growth function of the form
(3)
(3) was selected that is dependent on the maximum asymptote a (i.e. bulk Young's modulus in MPa), Euler's number e as well as the two shape parameters b in 1/mm
and c (dimensionless). For the three coupon build orientations (
and
), three corresponding growth functions
,
and were obtained. The experimental data for the dependency of Poisson's ratio thickness revealed a non-monotonic progression (see Section 3.2) and therefore, a two term exponential function rendered to be a suitable model. It is given in Equation (Equation4
(4)
(4) ),
(4)
(4) yielding the initial values k and m as well as, depending on the sign, the growth or decay constants (l and n) of the respective term. Again, for the considered build orientations the corresponding functions
,
and
were determined.
The additional directional dependency of E and ν on ϕ was modelled in the polar domain using a polynomial interpolant of degree 4:
(5)
(5) with the five thickness-dependent coefficients
to
. As the interpolation approach was the same for both ν and E, in this section only equations based on the latter are given exemplarily, while functions
are omitted to avoid redundancy. Considering boundary conditions that the slope of the curve shall be zero at the start and end points (i.e.
, with respect to ϕ, for
and
) as well as
for
,
for
and
for
, yields the five equations for the determination of
to
. These are given exemplarily for
below:
(6)
(6)
(7)
(7)
(8)
(8)
(9)
(9)
(10)
(10) The constructed material model now is dependent on t and ϕ and is rooted in the cartesian and polar domains, respectively (see Section 3.2). To map the adaptive material properties according to element thickness and orientation onto the FE model, a script was developed in tool command language (tcl). By a single command, the routine iterates over each element, extracts its thickness and calculates the out-of-plane angles
and
for the 1- and 2-directions, respectively (). The gathered information yields as input for the functions described above, which are employed to approximate
and
. The remaining necessary material parameter to define the transversely isotropic behaviour is
. It is approximated using Equation (Equation11
(11)
(11) ),
(11)
(11) an approach proposed by Huber (Citation1923) that was shown to be an adequate estimate in additively manufactured PA12 (Faes et al. Citation2017; Lindberg et al. Citation2018). Ultimately, the tcl-application automatically generates independent material properties and maps them to the respective elements. After discretisation, the definition of boundary conditions and specification of material properties, the FE model is ready to be solved.
3. Results
3.1. Dimensional accuracy of components
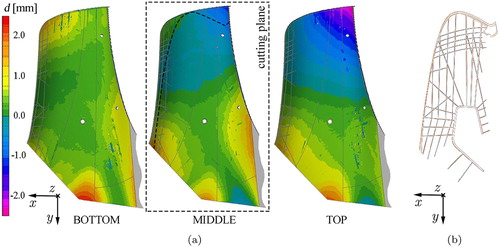
(a) shows the deviations of the produced fairings from the CAD model. In the area between the mounting hole and the load introduction point, the contour plots for the three samples reveal distortions in the range of approximately to 1 mm, which were lowest for the BOTTOM and highest for the TOP specimen. These results indicate that the dimensional accuracy decreases with build height in the production chamber. Such effects may be related to the thermal history of the parts. For instance, the BOTTOM sample was exposed to the heat of the build chamber substantially longer than the TOP part, which was fabricated last but extracted from the machine at first. Based on (b), where a cut through the sub-structure of the overlayed CAD and 3D-scan models is depicted, the ribs of the produced part appear to be straight and in line with the CAD data. Merely towards the top, where the cut passes through the outer skin, a deviation is noticeable that derives from the aforementioned distortion in z-direction. Additionally, rib thicknesses were investigated using a caliper. Based on 15 measurements the average error from the nominal thickness was small (
mm).
Figure 8. (a) 3D scan-based contour plot showing deviation d of the produced part to the CAD model in z-direction with cutting plane indicated via dashed lines and (b) cut view of overlayed CAD (black) and scan reconstruction (orange).
3.2. Elastic material properties and prediction model
In , the top row comprises the tensile test results as markers with the regressed parametric functions for the thickness dependency of Young's modulus and Poisson's ratio in the three build orientations (0 , 45
, 90
). The bottom row yields the full material parameter function
for the dependency of Young's modulus E and Poisson's ratio ν on material thickness t and build orientation angle ϕ, represented as polar diagram in the range of
that is expanded in a third dimension for the thickness effect.
Figure 9. Visualisation of the curve fitting result (top) and the full material model approximating the dependency on orientation in the polar domain from 0 to 90 and thickness (bottom), with markers indicating tensile test data and coloured lines the fitted functions for (a) Young's modulus and (b) Poisson's ratio.
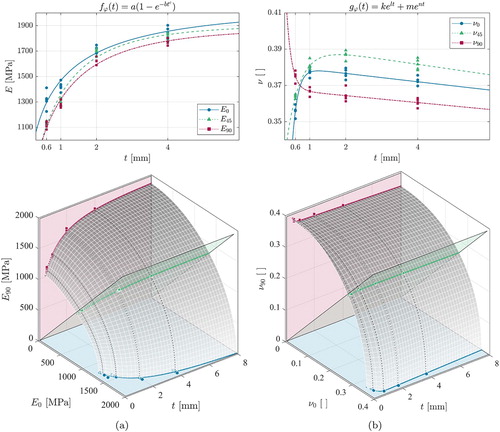
The fitted curves used to derive the three-dimensional models are plotted in the respective colours ()). Hereto, it is worth mentioning that the data in
and
correspond to the principal ∥- and ⊥-directions of the transversely isotropic material.
Since the thickness-dependent anisotropy of the mechanical properties and its origins were elaborated in detail elsewhere (Sindinger et al. Citation2020), only a brief description will be given within the scope of the present study, that is focused on the validation of the property mapping strategy. In (a), the graph depicts a non-linear monotonic degradation of the Young's moduli with decreasing part thickness that is characterised by a moderate slope between 4 and 2 mm, followed by a steeper progression towards the thinnest specimens in LS PA12 (Tasch et al. Citation2018; Sindinger et al. Citation2020). On average, mean values of (i.e.
) scored highest and
(i.e.
) lowest for each thickness, which is in line with the typical findings reported in the literature (Caulfield, McHugh, and Lohfeld Citation2007; Rüsenberg, Josupeit, and Schmid Citation2014; Ajoku et al. Citation2016; Lammens et al. Citation2017).
While Young's moduli decay monotonically for all orientations, a non-monotonic progression is disclosed for and
, which increase gradually towards a local maximum at 1 and 2 mm, respectively, before displaying a sharp drop until 0.6 mm ( b). In contrast, for
an indirect proportional relation to t is apparent. The magnitude as well as the finding that
exceeds
for bulk specimens, is supported by recent research (Lammens et al. Citation2017; Faes et al. Citation2017). While no explanation was stated in the previous studies, the differences in Poisson's ratio between orientations are likely related to the orientation of sintered layers that restrict transversal contraction to different extents. Why the
led to the highest and not to intermediate values for
1 mm, can at this point not be explained and is left for future research.
For quantification of the goodness of fit, the coefficient of determination was computed for the regressed models shown in the top row of and is comprised in . This statistic implies that the fit functions account for >95 % and >92 % of the total variation in the empiric data, indicating a satisfactory fit result for the dependency of the engineering constants on thickness.
When the modelled curves are observed, it is apparent that in both, Young's modulus and Poisson's ratio, the slope of the function is steep below 0.6 mm. This may cause unrealistic over- or underestimation of the response variable for thicknesses smaller than the thinnest experimentally determined data point. In the present study, the issue can be neglected since the 0.6 mm specimen were close to the minimum thickness achievable by the manufacturing system.
3.3. Finite element-based structural response prediction
To allow comparisons between conventional simulation approaches and the herein developed property mapping strategy (FEA), three additional models with homogeneous Young's modulus and Poisson's ratio were analysed. One variant (FEA data) featured properties according to the data sheet of the material supplier, where a constant elastic response is indicated. The second (FEA
) and third alternatives (FEA
) were also defined without thickness dependency, but were based on the experimental data of the
and t = 4 mm as well as t = 0.6 mm specimen, resembling bulk and conservative minimum properties, respectively.
(a) depicts the reaction force F plotted over the displacement D at the load introduction point, for the experiments and the numerical simulation variants. In case of the test data, the mean of the three evaluated fairing samples is displayed with standard deviation (SD) indicated by the shaded blue area. The curve of the test result shows a linear progression until about 2.6 mm, after which the slope decreases and SD increases gradually. Nevertheless, the variability in measured data is small, indicating minor scatter in material behaviour on the one hand and high reproducibility of the test setup on the other. Video stills that were captured of the reinforcement sub-structure during the tests revealed that the longitudinal ribs started to buckle at approximately D = 2.6 mm, which explains the stiffness decrease. The consecutive post-buckling regime is displayed as shaded grey area (a). The curves of Test and FEA are almost congruent until the end of the pre-buckling regime, where a marginal deviation
of less than 1 % was found (b). At this displacement,
for the conventional simulation approaches was orders of magnitude higher. Thereby, the conservative FEA
variant led to a considerable underestimation (> 20 %), while the other two variants were too stiff, lying almost 25 % above the experimental value in the worst case.
Figure 10. (a) Reaction force–displacement curves of the averaged physical test in blue (SD indicated by shaded region) and the different FE simulation results for homogeneous and mapped material properties. Markers show onset of buckling during the test at D = 2.6 mm and the maximum displacement (D = 5.0 mm), with corresponding extracted video stills (blue frame). For comparison, also the buckled shell element mesh is shown (red frame). (b) Error in percent with respect to the experimental mean value for the marker locations.
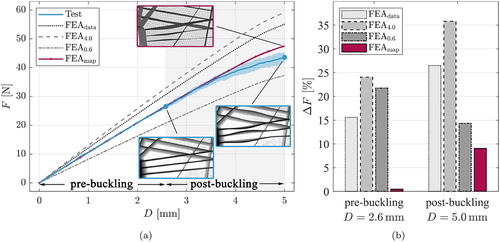
Similar to the physical parts, the ribbed sub-structure of the shell mesh models buckled as exemplarily shown in the red frame of (a). Nevertheless, all FE models exhibited a stiffness decrease that towards larger displacements differed noticeably from the experimentally measured progression, despite the geometrically non-linear analysis setup. Computing the first derivate of the Test and FEA curves revealed that the drop in slope is similar between the variants but that in the simulation it occurs approximately 20% after the experiment, indicating delayed onset of buckling. Consequently, at displacement maximum D=5 mm, FEA and FEA
registered an increased
of > 35 % and > 25 %. The error for FEA
appears to have decreased, which is misleading as it merely derives from the fact that the earlier initiation of stiffness decrease in the experiment (Test) brings the two curves closer together in the post buckling regime. Also at maximum displacement, the developed mapping approach performed considerably better than the other methods, scoring a
below 10 %, which is a satisfactory deviation considering the geometric non-linearity inherent in the model.
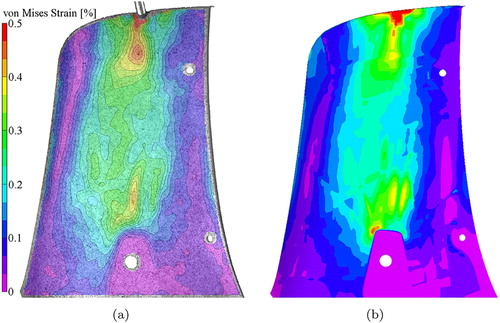
In , the von Mises strain at displacement D = 5 mm computed from DIC data of one of the physical component tests is exemplarily compared to the outcome of the FE analysis with mapped material properties. Overall, for experiment and simulation, the strain distribution on the outer skin of the fairing is very similar and inhomogeneous, exhibiting regions of close to 0 % strain and other local areas of strains up to approximately 0.5 %. The low strains at the attachment socket are attributed to the fact that in that area the fairing was adhesively bonded in the experiment and displacements constrained in the FE model. The highest strains of around 0.5 % occurred where the load was introduced, which led to local deformations of the thin shell surface. The remaining discontinuities in the contour plots are attributed to the interaction of the ribbed sub-structure underneath the thin skin.
Figure 11. Von Mises strain at displacement D = 5 mm for (a) DIC data obtained during experiments and (b) FE simulation considering anisotropic thickness dependency of material properties.
4. Discussion
Out of the need for a more precise structural simulation approach for thin-walled additively manufactured components exhibiting thickness dependent anisotropy, in the current study, a novel strategy was proposed. It involved experimental determination of fundamental material parameters, construction of prediction models, the development of a script for the automatic property mapping in FE shell models and the numerical simulation of a demonstrator component with mapped and homogeneous properties. Ultimately, parts were produced and the simulation results validated via physical tests.
The findings disclosed that in the linear regime (a), the routine developed herein, highly improved the structural response prediction accuracy for the considered complex thin-walled component, showing a deviation less than 1 % compared to the physical tests. This constitutes an improvement by 2 orders of magnitude compared to data sheet values or empiric properties that do not incorporate the thickness effect. The findings highlight the absolute necessity to implement this peculiar material behaviour in structural simulations in order to achieve meaningful estimates for thin-walled components. Based on the outcome, the utilisation of material data sheet values or properties determined on tests of a single specimen thickness and build orientation cannot be recommended, since they are prone to lead to elevated stiffness or overly conservative predictions, when bulk or thin-walled coupons are used, respectively.
At larger displacements, the reinforcement ribs of the fairing started to buckle, which led to a reduction in stiffness in the experiments. This decrease in stiffness was also apparent in the numerical simulations but occurred later. In the post-buckling regime, still the model with the mapped material properties was superior to the other variants. However, accurate prediction of the post-buckling behaviour of mechanical structures is rather challenging, as it is highly affected by the definition of boundary conditions and further aspects that will be detailed in the following.
One reason for the delayed onset of buckling in the simulation is likely rooted in the known sensitivity of the buckling behaviour to imperfections. While the virtual model is flawless, slight geometrical distortions in the physical part could lead to premature buckling, as was observed in the test results ( a). In fact, the investigation of the dimensional accuracy revealed that all produced fairing samples slightly deviate from the CAD geometry. Moreover, the 3D scans of the outer skin indicated that the magnitude of distortions differs between samples, which would explain the slight increase in scatter apparent in the measured reaction force after onset of buckling.
Besides such macroscopic deviations, also microscopic defects may attribute to the differences in the post-buckling regime. Sindinger et al. (Citation2020) reported that the porosity distribution over the cross-section is inhomogeneous in LS Pa12. Furthermore, their findings suggested that the stiffness is inconsistent with a softer skin layer encompassing an inner core material. This more compliant skin region could be another reason for the differences in the post-buckling regime, considering that the buckling behaviour of the fairing's reinforcement ribs is dependent on the bending stiffness of the shell elements. Within the present study, the material properties varied between elements, however, were homogeneous over the element thickness. To account for the aforementioned microstructural heterogeneity, multi-scale material modelling tools appear as promising option, which will be focus of future research.
Another reason related to the later onset of buckling in the simulation could be an artificially induced higher out-of-plane bending stiffness of the ribs, due to a small number of elements over the sub-structure height (minimum three elements). Since the investigation of slopes indicated that the stiffness decrease was similar after onset of buckling for both, simulation and experiment, the influence of the mesh size is seen as minor issue, however, cannot be ruled out based on the present convergence study that was performed using linear analysis and small displacements.
The last aspect that was identified as potential origin for the differences between component test and simulations is related to non-linearity, not deriving from the geometry but from the material itself. In the present study, the entries of the material model are based on the standard for the determination of mechanical properties in thermoplastics (ISO 527 Citation2012), which for instance recommends that the Young's modulus should be determined using linear regression in the range of 0.05–0.25 % strain in the stress–strain plot obtained in tensile tests. However, in semi-crystalline polymers the initially close to linear curve typically changes in a degressive manner, marking the transition into the non-linear viscoelastic regime, before high strains lead to plastic deformation. This progression is also characteristic for LS Pa12, as can be seen in numerous stress–strain diagrams reported in the literature (Caulfield, McHugh, and Lohfeld Citation2007; Cooke et al. Citation2011; Lammens et al. Citation2017). While no visible plastic deformations remained after unloading of the fairing components, still higher strains were present in the structure (a) than the ones the constants for the utilised linear elastic material model were derived of. Hence, besides geometrical imperfections and microstructural inhomogeneity of the additively manufactured structure, the herein neglected non-linear material behaviour appears as plausible explanation for the observed later onset of buckling in the virtual model. Therefore, despite the substantial improvement disclosed in the post-buckling regime, the remaining discrepancies between simulation and experiment limit the applicability of the proposed approach for large displacement analysis.
The high precision in the linear elastic regime as well as the high degree of automation in the FE pre-processor make the property mapping strategy far superior to models with constant properties. Nevertheless, it is noteworthy that the vast improvement comes at a cost. The basis of a successful implementation of the mapping strategy is the thorough characterisation of the material behaviour for the specific process parameters used during fabrication of the considered structural component. If these parameters change, the material characterisation has to be regenerated. Furthermore, by considering the thickness-dependent anisotropy of the mechanical material properties, the experimental complexity is increased significantly compared to basic test regimes, where solely one thickness and orientation is evaluated. Hence, it should be assessed beforehand if the increased efforts are justified for the targeted application. In many cases, as also in this research, the selection of specimen variants is not exhaustive but rather a trade-off between aspired modelling detail and available resources. If for instance more build orientations would have been available, more substantiated parametric functions could have been employed to model the directional dependencies, instead of the basic polynomial approach pursued in the present study.
Another aspect that adds complexity to the proposed strategy was previously stated at the end of Section 2.4.2 and concerns that the mapping procedure generates an individual property for each material. Since the material is dependent on element orientation and slight differences between and
persist for almost all elements, the number of property definitions is close to the total number of elements in the model. Thus, for the considered fairing, the number of defined properties in the mapped model exceeded 20 000, as can be deduced from . Despite the fact that the mapped model has over 2000 times the number of properties compared to the conventional constant alternative, it took only 10 % longer to compute the solution. The finding that a relatively low increase in computational time yields a substantial improvement in the structural response prediction indicates the computational efficiency and relevancy of the novel approach for industrial practice.
Table 3. Comparison of computational efficiency for constant and mapped models.
Nevertheless, it should be kept in mind that while solving times are similar between the models, for the mapped variant also the script-based automatic generation and assignment of properties should be considered. With 6078 s (), the time to automatically generate and map the vast number of properties in the pre-processing of the model is over four times longer than the actual time to compute the solution. Consequently, the question arises if such a detailed degree of differentiation is actually necessary to achieve satisfactory results. Therefore in a subsequent study, the efficiency of the material mapping routine will be optimised towards a minimum number of property definitions at a sufficiently precise response. Succeeding research should also be conducted to extend the 2D element-based method for property mapping in volume FE meshes.
5. Conclusion
In this work, a novel material property mapping approach of thickness-dependent anisotropy in structural FE analysis for thin-walled additively manufactured components was developed and validated via experiments. Based on the findings, the following conclusion can be drawn:
The identified parametric functions rendered suitable to model the thickness dependency of Young's modulus and Poisson's ratio in LS PA12.
The constructed thickness and orientation-dependent material model proved suitable for the implementation in FE software tools.
Using the proposed material mapping strategy led to an improvement of the simulation accuracy by 2 orders of magnitude in the linear elastic regime compared to models with constant material behaviour.
The thickness dependency and directional elastic response characteristic to thin-walled additively manufactured parts must be considered for meaningful numerical simulation results. Assigning constant material properties deduced of material data sheets or experiments proved to be insufficient for shell geometries.
Taking into account the outcome, the objective of this research to improve the accuracy of structural FE simulations for thin-walled additively manufactured structures is seen as fulfilled. For the investigated process conditions, it is now possible to more precisely assess the linear elastic load–displacement behaviour numerically prior to part production, which saves time and resources in the development phase. In fact, the routine has successfully been employed for other thin-walled structures as well which, however, could not be released for publication by our industry partners. While the current investigation focused on linear elastic material behaviour, questions arise if the proposed approach can effectively be extended for the consideration of material non-linearity. Likewise, the transferability of the elaborated methodology from component stiffness to strength assessment will be addressed in subsequent research. Another highly relevant topic left for future studies is the extension of the current mapping strategy for the aforementioned effect on the mechanical properties of the part position within the build chamber.
Ultimately, it can be stated that the applicability of the research findings go far beyond the described structural assessment of rapid racing motorcycle front fairing prototypes. The proposed mapping approach can not only be employed to assess existing designs, but furthermore, to the design process itself. By considering not only anisotropy (Zhang, Liu, and To Citation2017; Dapogny et al. Citation2019) but also the severe non-linear thickness dependency in size optimisations for reinforcement ribs or other shell structures, the potential of AM for lightweight constructions can be exploited in unprecedented ways. This challenge will be targeted in future research.
Acknowledgments
The financial support of the Christian Doppler Association, the Austrian Federal Ministry of Digital and Economic Affairs and the National Foundation for Research, Technology and Development is gratefully acknowledged, as well as sample fabrication by KTM Technologies GmbH.
Disclosure statement
No potential conflict of interest was reported by the author(s).
Additional information
Funding
Notes on contributors
Sigfrid-Laurin Sindinger
Sigfrid-Laurin Sindinger is PhD student at the Institute of Structural Lightweight Design at the Johannes Kepler University Linz, Austria.
David Marschall
David Marschall is PhD student at the Institute of Structural Lightweight Design at the Johannes Kepler University Linz as well as Group Leader of Structure and Optimization at KTM Technologies GmbH, Austria.
Christoph Kralovec
Christoph Kralovec is assistant professor of machinery and plant engineering design at the Johannes Kepler University Linz, Austria.
Martin Schagerl
Martin Schagerl is professor of structural lightweight design at the Johannes Kepler University Linz, Austria.
References
- Ajoku, U., N. Saleh, N. Hopkinson, R. Hague, and P. Erasenthiran. 2016. “Investigating Mechanical Anisotropy and End-of-Vector Effect in Laser-Sintered Nylon Parts.” Proceedings of the Institution of Mechanical Engineers, Part B: Journal of Engineering Manufacture 220 (7): 1077–1086. doi: 10.1243/09544054JEM537
- Algardh, J. K., T. Horn, H. West, R. Aman, A. Snis, H. Engqvist, J. Lausmaa, and O. Harrysson. 2016. “Thickness Dependency of Mechanical Properties for Thin-Walled Titanium Parts Manufactured by Electron Beam Melting (EBM).” Additive Manufacturing 12: 45–50. doi: 10.1016/j.addma.2016.06.009
- Amado-Becker, A., J. Ramos-Grez, M. J. Yañez, Y. Vargas, and L. Gaete. 2008. “Elastic Tensor Stiffness Coefficients for SLS Nylon 12 Under Different Degrees of Densification as Measured by Ultrasonic Technique.” Rapid Prototyping Journal 14 (5): 260–270. doi: 10.1108/13552540810907929
- Bain, E. D., E. J. Garboczi, J. E. Seppala, T. C. Parker, and K. B. Migler. 2019. “AMB2018-04: Benchmark Physical Property Measurements for Powder Bed Fusion Additive Manufacturing of Polyamide 12.” Integrating Materials and Manufacturing Innovation 8 (3): 335–361. doi: 10.1007/s40192-019-00146-3
- Barba, D., C. Alabort, Y. T. Tang, M. J. Viscasillas, R. C. Reed, and E. Alabort. 2020. “On the Size and Orientation Effect in Additive Manufactured Ti–6Al–4V.” Materials & Design 186: 108235. doi: 10.1016/j.matdes.2019.108235
- Barbero, E. J.. 2017. Introduction to Composite Materials Design. 3rd ed. Boca Raton: CRC Press.
- Bell, D., and T. Siegmund. 2018. “3D-Printed Polymers Exhibit a Strength Size Effect.” Additive Manufacturing 21: 658–665. doi: 10.1016/j.addma.2018.04.013
- Brown, B., W. Everhart, and J. Dinardo. 2016. “Characterization of Bulk to Thin Wall Mechanical Response Transition in Powder Bed AM.” Rapid Prototyping Journal 22 (5): 801–809. doi: 10.1108/RPJ-10-2015-0146
- Caulfield, B., P. E. McHugh, and S. Lohfeld. 2007. “Dependence of Mechanical Properties of Polyamide Components on Build Parameters in The SLS Process.” Journal of Materials Processing Technology182 (1-3): 477–488. doi: 10.1016/j.jmatprotec.2006.09.007
- Cooke, W., R. A. Tomlinson, R. Burguete, D. Johns, and G. Vanard. 2011. “Anisotropy, Homogeneity and Ageing in an SLS Polymer.” Rapid Prototyping Journal 17 (4): 269–279. doi: 10.1108/13552541111138397
- Dapogny, C., R. Estevez, A. Faure, and G. Michailidis. 2019. “Shape and Topology Optimization Considering Anisotropic Features Induced by Additive Manufacturing Processes.” Computer Methods in Applied Mechanics and Engineering 344: 626–665. doi: 10.1016/j.cma.2018.09.036
- Dewulf, W., M. Pavan, T. Craeghs, and J. P. Kruth. 2016. “Using X-ray Computed Tomography to Improve The Porosity Level of Polyamide-12 Laser Sintered Parts.” Cirp Annals 65 (1): 205–208. doi: 10.1016/j.cirp.2016.04.056
- Domingo-Espin, M., J. M. Puigoriol-Forcada, A. A. Garcia-Granada, J. Llumà, S. Borros, and G. Reyes. 2015. “Mechanical Property Characterization and Simulation of Fused Deposition Modeling Polycarbonate Parts.” Materials & Design 83: 670–677. doi: 10.1016/j.matdes.2015.06.074
- Dupin, S., O. Lame, C. Barrès, and J. Y. Charmeau. 2012. “Microstructural Origin of Physical and Mechanical Properties of Polyamide 12 Processed by Laser Sintering.” European Polymer Journal 48 (9): 1611–1621. doi: 10.1016/j.eurpolymj.2012.06.007
- Faes, M., Y. Wang, P. Lava, and D. Moens. 2017. “Variability, Heterogeneity, and Anisotropy in the Quasi-Static Response of Laser Sintered Pa12 Components.” Strain 53 (2): e12219. doi: 10.1111/str.12219
- Goodridge, R. D., C. J. Tuck, and R. Hague. 2012. “Laser Sintering of Polyamides and Other Polymers.” Progress in Materials Science 57 (2): 229–267. doi: 10.1016/j.pmatsci.2011.04.001
- Huber, M.. 1923. “The Theory of Crosswise Reinforced Ferroconcrete Slabs and Its Application to Various Important Constructional Problems Involving Rectangular Slabs.” Der Bauingenieur 4 (12): 354–360.
- ISO 1133. 2012. “Plastics – Determination of The Melt Mass-Flow Rate (MFR) and Melt Volume-Flow Rate (MVR) of Thermoplastics.”
- ISO 527. 2012. “Plastics – determination of tensile properties.”
- Raja, K. B., R. J. P. Raja, K. Karan, R. Soundararajan, and P. Ashokavarthanan. 2019. Parameter Optimization for Polyamide in Selective Laser Sintering Based on Mechanical Behavior. 217–231.Singapore: Springer Singapore.
- Lammens, N., M. Kersemans, I. De Baere, and W. Van Paepegem. 2017. “On the Visco-Elasto-Plastic Response of Additively Manufactured Polyamide-12 (PA-12) Through Selective Laser Sintering.” Polymer Testing 57: 149–155. doi: 10.1016/j.polymertesting.2016.11.032
- Lindberg, A., J. Alfthan, H. Pettersson, G. Flodberg, and L. Yang. 2018. “Mechanical Performance of Polymer Powder Bed Fused Objects–FEM Simulation and Verification.” Additive Manufacturing 24: 577–586. doi: 10.1016/j.addma.2018.10.009
- Lindgren, L. E., A. Lundbäck, M. Fisk, R. Pederson, and J. Andersson. 2016. “Simulation of Additive Manufacturing Using Coupled Constitutive and Microstructure Models.” Additive Manufacturing 12: 144–158. Special Issue on Modeling & Simulation for Additive Manufacturing. doi: 10.1016/j.addma.2016.05.005
- Majewski, C., and N. Hopkinson. 2011. “Effect of Section Thickness and Build Orientation on Tensile Properties and Material Characteristics of Laser Sintered Nylon–12 Parts.” Rapid Prototyping Journal17 (3): 176–180. doi: 10.1108/13552541111124743
- Marschall, D., H. Rippl, F. Ehrhart, and M. Schagerl. 2020. “Boundary Conformal Design of Laser Sintered Sandwich Cores and Simulation of Graded Lattice Cells Using a Forward Homogenization Approach.” Materials & Design 190: 108539. doi: 10.1016/j.matdes.2020.108539
- Ning, J., M. Praniewicz, W. Wang, J. R. Dobbs, and S. Y. Liang. 2020a. “Analytical Modeling of Part Distortion in Metal Additive Manufacturing.” The International Journal of Advanced Manufacturing Technology 107 (1-2): 49–57. doi: 10.1007/s00170-020-05065-8
- Ning, J., D. E. Sievers, H. Garmestani, and S. Y. Liang. 2019. “Analytical Modeling of In-Process Temperature in Powder Bed Additive Manufacturing Considering Laser Power Absorption, Latent Heat, Scanning Strategy, and Powder Packing.” Materials (Basel, Switzerland) 12 (5): 808. doi: 10.3390/ma12050808
- Ning, J., D. E. Sievers, H. Garmestani, and S. Y. Liang. 2020b. “Analytical Modeling of In-Situ Deformation of Part and Substrate in Laser Cladding Additive Manufacturing of Inconel 625.” Journal of Manufacturing Processes 49: 135–140. doi: 10.1016/j.jmapro.2019.11.013
- Pham, M. T., S. H. Yeo, T. J. Teo, P. Wang, and M. L. S. Nai. 2019. “Design and Optimization of a Three Degrees-of-Freedom Spatial Motion Compliant Parallel Mechanism with Fully Decoupled Motion Characteristics.” Journal of Mechanisms and Robotics 11 (5). doi: 10.1115/1.4043925
- Roach, A. M., B. C. White, A. Garland, B. H. Jared, J. D. Carroll, and B. L. Boyce. 2020. “Size-Dependent Stochastic Tensile Properties in Additively Manufactured 316L Stainless Steel.” Additive Manufacturing32: 101090. doi: 10.1016/j.addma.2020.101090
- Rüsenberg, S., S. Josupeit, and H. J. Schmid. 2014. “A Method to Characterize the Quality of a Polymer Laser Sintering Process.” Advances in Mechanical Engineering 6: 185374. doi: 10.1155/2014/185374
- Schürmann, H.. 2007. Konstruieren Mit Faser-Kunststoff-Verbunden. 2nd ed. Berlin, Heidelberg: Springer Berlin Heidelberg.
- Sindinger, S. L., C. Kralovec, D. Tasch, and M. Schagerl. 2020. “Thickness Dependent Anisotropy of Mechanical Properties and Inhomogeneous Porosity Characteristics in Laser-Sintered Polyamide 12 Specimens.” Additive Manufacturing 33: 101141. doi: 10.1016/j.addma.2020.101141
- Stichel, T., T. Frick, T. Laumer, F. Tenner, T. Hausotte, M. Merklein, and M. Schmidt. 2017. “A Round Robin Study for Selective Laser Sintering of Polyamide 12: Microstructural Origin of the Mechanical Properties.” Optics & Laser Technology 89: 31–40. doi: 10.1016/j.optlastec.2016.09.042
- Stichel, T., T. Frick, T. Laumer, F. Tenner, T. Hausotte, M. Merklein, and M. Schmidt. 2018. “A Round Robin Study for Selective Laser Sintering of Polymers: Back Tracing of the Pore Morphology to the Process Parameters.” Journal of Materials Processing Technology 252: 537–545. doi: 10.1016/j.jmatprotec.2017.10.013
- Tasch, D., A. Mad, R. Stadlbauer, and M. Schagerl. 2018. “Thickness Dependency of Mechanical Properties of Laser-Sintered Polyamide Lightweight Structures.” Additive Manufacturing 23: 25–33. doi: 10.1016/j.addma.2018.06.018
- VDI 3405. 2019. “Additive Manufacturing Processes – Laser Sintering of Polymer Parts – Quality Control.”
- Wang, P., M. H. Goh, Q. Li, M. L. S. Nai, and J. Wei. 2020a. “Effect of Defects and Specimen Size with Rectangular Cross-Section on The Tensile Properties of Additively Manufactured Components.” Virtual and Physical Prototyping 112 (13): 1–14. doi: 10.1080/17452759.2020.1823116
- Wang, P., P. Huang, F. L. Ng, W. J. Sin, S. Lu, M. L. S. Nai, Z. Dong, and J. Wei. 2019a. “Additively Manufactured CoCrFeNiMn High-Entropy Alloy Via Pre-Alloyed Powder.” Materials & Design 168: 107576.
- Wang, P., X. Li, S. Luo, M. L. S. Nai, J. Ding, and J. Wei. 2021. “Additively Manufactured Heterogeneously Porous Metallic Bone with Biostructural Functions and Bone-Like Mechanical Properties.” Journal of Materials Science & Technology 62: 173–179. doi: 10.1016/j.jmst.2020.05.056
- Wang, P., M. L. S. Nai, W. J. Sin, S. Lu, B. Zhang, J. Bai, J. Song, and J. Wei. 2019b. “Effect of Overlap Distance on the Microstructure and Mechanical Properties of In Situ Welded Parts Built by Electron Beam Melting Process.” Journal of Alloys and Compounds 772: 247–255. doi: 10.1016/j.jallcom.2018.09.093
- Wang, P., J. Song, M. L. S. Nai, and J. Wei. 2020b. “Experimental Analysis of Additively Manufactured Component and Design Guidelines for Lightweight Structures: A Case Study Using Electron Beam Melting.” Additive Manufacturing 33: 101088.
- Wang, P., X. Tan, M. L. S. Nai, S. B. Tor, and J. Wei. 2016. “Spatial and Geometrical-Based Characterization of Microstructure and Microhardness for An Electron Beam Melted Ti–6Al–4V Component.” Materials & Design 95: 287–295. doi: 10.1016/j.matdes.2016.01.093
- Wegner, A., C. Mielicki, T. Grimm, B. Gronhoff, G. Witt, and J. Wortberg. 2014. “Determination of Robust Material Qualities and Processing Conditions for Laser Sintering of Polyamide 12.” Polymer Engineering & Science 54 (7): 1540–1554. doi: 10.1002/pen.23696
- Wegner, A., and G. Witt. 2012. “Correlation of Process Parameters and Part Properties in Laser Sintering Using Response Surface Modeling.” Physics Procedia 39: 480–490. Laser Assisted Net shape Engineering 7 (LANE 2012). doi: 10.1016/j.phpro.2012.10.064
- Wörz, A., and D. Drummer. 2018. “Understanding Hatch-Dependent Part Properties in SLS. In Proceeding of the Solid Freeform Fabrication Symposium. 1360–1369.
- Zhang, P., J. Liu, and A. C. To. 2017. “Role of Anisotropic Properties on Topology Optimization of Additive Manufactured Load Bearing Structures.” Scripta Materialia 135: 148–152. doi: 10.1016/j.scriptamat.2016.10.021
- Zhao, Y., Y. Chen, and Y. Zhou. 2019. “Novel Mechanical Models of Tensile Strength and Elastic Property of FDM AM PLA Materials: Experimental and Theoretical Analyses.” Materials & Design 181: 108089. doi: 10.1016/j.matdes.2019.108089
- Zou, R., Y. Xia, S. Liu, P. Hu, W. Hou, Q. Hu, and C. Shan. 2016. “Isotropic and Anisotropic Elasticity and Yielding of 3D Printed Material.” Composites Part B: Engineering 99: 506–513. doi: 10.1016/j.compositesb.2016.06.009