
 ?Mathematical formulae have been encoded as MathML and are displayed in this HTML version using MathJax in order to improve their display. Uncheck the box to turn MathJax off. This feature requires Javascript. Click on a formula to zoom.
ABSTRACT
Avoiding cracking defects is crucial to ensuring processability in the laser powder bed fusion (LPBF) of metallic materials. In this study, a crack-free Ni-based superalloy with a high volume fraction of the γ′ phase was designed for the LPBF process using the thermodynamic approach. The results indicate that the designed SD01 Ni-based alloy was crack-free and over 21% of the spherical γ′ phase was uniformly distributed in the matrix after heat treatment. In addition, 1 wt.% TiB2 particles were introduced into the SD01 alloy to further enhance high-temperature mechanical performance. It was found that the morphology of the γ′ phase was altered from spherical to cubic structures, and its volume fraction increased from 21% to 40% after the TiB2 addition. The SD01-TiB2 composite exhibited an excellent combination of tensile strength (437.43 MPa) and elongation (7.71%) at 900 °C compared with the SD01 alloy (252.03 MPa, 3.02%). These findings provide a new metallic material design method for the LPBF of crack-free high-performance Ni-based materials.
1. Introduction
Nickel-based superalloys have been extensively used in the aviation, aerospace and transportation fields because of their remarkable tensile strength, creep properties and superior oxidation resistance under elevated temperature conditions (Fan et al. Citation2021; Grilli et al. Citation2017; Tan et al. Citation2020). For instance, the turbine discs and blades made of Ni-based superalloys typically operate at temperatures exceeding 900°C (Furrer and Fecht Citation1999; Singh Citation2014). Traditionally, Ni-based superalloys were manufactured mainly by casting, forging and powder metallurgy methods, but these were limited by their high-costs, long lead times and geometric constraints (Reed Citation2008; Selvaraj et al. Citation2021). Recent advances in laser powder bed fusion (LPBF) have provided a new method for the fabrication of Ni-based superalloys (Haines et al. Citation2022; Liu et al. Citation2022). The LPBF process could form complex structural parts with its natural digital characteristics, thus simplifying the manufacturing process and shortening the manufacturing chain (Narasimharaju et al. Citation2022). Nevertheless, Ni-based superalloys are sensitive to cracking, which is highly related to their rapid cooling rates, spatially variable temperature gradients and intrinsic thermal cycling induced by the LPBF process (Guo et al. Citation2023; Tang et al. Citation2021; Zhao et al. Citation2023). These non-uniform cooling rates and large thermal gradients typically generate high levels of residual stress in additively manufactured materials, inducing the formation of micro-cracks and delamination. Recent studies (Tang et al. Citation2021; Yu et al. Citation2022) have highlighted the following modes of crack formation in the LPBF of Ni-based superalloys:
Solid-state cracking. Solid-state cracks are induced by residual stress from precipitation (γ′ phase), resulting in a strain exceeding the limited ductility of the matrix (Yu et al. Citation2022). Solid-state cracks are characterised by parallel straight sides, generally showing a sharp kink close to 90° but without the presence of dendrite arms or liquid film traces.
Liquation cracking. Liquation cracks are generated in the thermal cycle stage, which is inherent in the LPBF process. Some low-melting precipitates are re-heated multiple times and melted as the laser heats up to a nearby area. The liquid phase acts as a crack initiation point for the influence of residual stress (Tang et al. Citation2021; Zhou et al. Citation2022). Eutectic phases with low melting points generally precipitate around the liquation cracks.
Solidification cracking. These cracks occur in the solidification stage of the LPBF process. Dendrite arms and liquid films are along the cracks, indicating that the cracks initiate from the residual liquid between dendrite arms and that insufficient feeding is provided by the residual liquid to accommodate the solidification shrinkage strain (Tang et al. Citation2021).
Recently, the addition of ceramic particles has proven to be a feasible approach for eliminating cracks and improving the tensile strength of solid-solution-strengthened Ni-based superalloys. For instance, Zhang et al. added 1wt.% TiB2 particles into GH3230 to eliminate cracks and achieve better strength and elongation than pure GH3230 (Zhang et al. Citation2021); Han et al. found that TiC nanoparticles played a positive role in cracking elimination and tensile performance enhancement of LPBF-fabricated Hastelloy X (HX) nanocomposites (Han et al. Citation2020). Meanwhile, TiB2, Y2O3 and WC particles were also introduced into HX to fabricate high-strength and defect-free HX composites (Cheng et al. Citation2021; Han et al. Citation2021; Yang et al. Citation2021). Notably, the above researchers all reported that the addition of reinforcing particles could inhibit the initiation and propagation of cracks, reducing the fraction of the defects and improving mechanical properties. Nevertheless, it is still a challenge for these composites to meet strength requirements under elevated temperature conditions, mainly because of their relatively weak matrix materials.
Compared with the solid-solution-strengthened Ni-based alloys, precipitation-strengthened Ni-based alloys exhibit outstanding high-temperature strength because of the enhancement of the γ′ phase (Takahashi, Kawanabe, and Ghoniem Citation2010). However, the precipitation of the γ’ phase also increases the generation of residual stress, which in turn increases cracking susceptibility (Xu et al. Citation2022). Lv et al. proposed a method to decrease the cracking susceptibility of CM247LC superalloy by adding nanoscale TiC particles. The results showed that the fraction of cracks in CM247LC alloy could be reduced but not eliminated (Lv et al. Citation2022). This finding indicated that the addition of nucleation agents is not an effective approach to heal cracking within the LPBF of precipitation Ni-based alloys, although it has been proven feasible in the elimination of hot cracking during the LPBF of solid-solution-strengthened nickel alloys (Zhang et al. Citation2022).
One of the feasible solutions to the LPBF of Ni-based superalloys is to optimise the contents of the Al, Ti, Nb and Ta elements in order to achieve proper LPBF processability while maintaining the volume fraction of the γ′ phase. Tang et al. designed two novel crack-free superalloys, named ABD-850AM and ABD-900AM, by calculating crack susceptibility and avoiding defect formation using thermodynamic simulations (Tang et al. Citation2021). The properties of the alloys, however, were found to be reduced because of the loss of γ’ phase volume fraction, although the cracks were eliminated by changing the element content. Ji-Un Park et al. used the René 80 composition as a baseline to obtain a crack-free selective electron beam melting superalloy (AM80) with a high γ′ volume fraction by reducing Ti (5→3 wt. %) but adding 2.5 wt. % Ta and 1.0 wt. % Hf (Park et al. Citation2022). The designed AM80 alloy exhibited superior tensile properties (805 ± 6 MPa) at 870 °C without any cracks being formed. Zhu et al. investigated the effect of Nb and Ta in a Ni-Co-based superalloy, showing that the alloying effects of Nb and Ta on γ′ phase could strengthen stability (Zhu et al. Citation2023). Therefore, increasing Nb and Ta elements is highly recommended to improve mechanical performance in next-generation Ni-based superalloys. Nonetheless, designing a perfect Ni-based superalloy with excellent high-temperature properties is difficult because of γ′ redissolution into the matrix at high temperatures.
In this study, thermodynamic calculations were performed to design a crack-free Ni-based superalloy for the LPBF process by considering the solidification crack index (SCI), the freezing range (FR) and the strain-age crack (SAC) index while maintaining a high volume fraction of the γ′ phase. Response surface methodology (RSM) was applied to optimise the Ni-based superalloy (SD01) by fully considering cracking susceptibility and the γ’ phase fraction. The influence of TiB2 addition and heat treatment (HT) on microstructures, precipitation and mechanical properties was also discussed. The various possible strengthening mechanisms of the SD01 and SD01 composite (SD01-C) were also described in this study.
2. Design methodology and experimental procedure
2.1. The alloy design methodology
The mechanical behaviour of precipitation-strengthened Ni-based alloys fabricated with the LPBF process is influenced by various factors, including cracking susceptibility, γ′ phase properties (volume fraction, size and shape) and LPBF process parameters (Sanchez et al. Citation2021; Shahwaz, Nath, and Sen Citation2022). Cracking susceptibility and γ′ phase volume fraction were chosen in this study as the primary considerations for the alloy design. The SCI, FR and SAC indicators were used to measure the cracking susceptibility using the following equations (Kou Citation2015; Tang et al. Citation2021):
(1)
(1) where
is the solid fraction. The SCI value is the average value when the value range of solid fraction is between 0.9 and 0.99. A high SCI value indicates a slow growth rate of columnar grains, meaning that the liquid channel of neighbouring columnar grains is difficult to fill, leading a long sharp notch to promote crack initiation (Chauvet et al. Citation2018).
(2)
(2) where
is the liquidus temperature and
is the solidus temperature. A wide freezing range generally indicates a high crack susceptibility (Dupont, Lippold, and Kiser Citation2011).
(3)
(3) where
is the volume fraction of γ phase, and
is the critical temperature of 0.7
. A high SAC value indicates a high crack sensitivity brought by the volume change of precipitations (Yu et al. Citation2022b).
These data were calculated with Thermo-Calc software with the TCNI9 database by using the Scheil–Gulliver solidification module and the equilibrium solidification module, with a temperature step size of 1 K. The weight fractions of Al, Ti, Nb, and Ta were selected as significant indicators because they were the main components for the γ’ phase, and they played an important role in reducing cracking susceptibility. The optimum alloy composition was determined using RSM, which allowed for the multi-objective optimisation of various index trade-offs (Şimşek, Tansel İç, and Şimşek Citation2016).
A total of 30 element combinations were carried out in this study, and the ranges of the volume fractions of Al, Ti, Nb and Ta were selected based on the ABD-850AM reference alloy (Tang et al. Citation2021). shows the experimental codes and factors.
Table 1. Correspondence table of experimental codes and factors.
The alloy design approach aims to increase LPBF processability while maintaining the high-temperature strength of the superalloy by holding a high γ’ volume fraction. The increase in γ’ phase fraction has a strong positive correlation with the addition of Al, Ti, Nb and Ta, which, in turn, increases cracking susceptibility (Henderson et al. Citation2004). Therefore, the cracking susceptibility and γ’ volume fraction were the two primary factors for optimisation in this study. The optimisation could be formulated in the standard mathematical format as follows:
Find:
(4)
(4) Minimise:
(5)
(5) Maximise:
(6)
(6) Within the following ranges:
where ωAl, ωTi, ωNb and ωTa are the weight fractions of Al, Ti, Nb and Ta, respectively.
Afterward, a total of 30 variants were set to determine four regression models (RSAC, RSCI, RFR and Rγ’) between the four elements and four dependent variables by regression fitting, according to the central composite design method. The equations are as follows:
Regression Equations
(7)
(7)
(8)
(8)
(9)
(9)
(10)
(10) where (Al), (Ti), (Nb), and (Ta) are the weight fractions of the four elements, respectively. The candidate compositions were screened based on the lowest cracking susceptibility and the highest γ’ volume fraction within the design ranges.
2.2. The feedstock
In this study, the designed SD01 spherical powder was produced by Avimetal Powder Metallurgy Technology (Beijing, China) and the sub-micrometre TiB2 powder was supplied by CWnano (Shanghai, China). To produce the SD01 spherical powder, the alloy ingot was obtained using vacuum melting according to the designed composition of the SD01 alloy, followed by argon atomisation. A high-speed mixer (SpeedMixer DAC 800.1 FVZ, Nordrhein-Westfalen, Germany) was used to prepare the composite feedstock. During the mixing procedure, the weight ratio of SD01 and TiB2 was set to 99:1. The experiments were carried out at a mixing speed of 1,200 rpm and a mixing time of 1.5 min, followed by cooling to room temperature (RT). This process was repeated three times.
2.3. The LPBF process and heat treatment
The LPBF process was carried out in a 100 × 100 × 200 mm3 build volume under argon atmosphere protection using a Concept Laser Mlab cusing 200R (GE, Lichtenfels, Germany) equipped with a modulated 200 W ytterbium fibre laser (wavelength = 1,070 nm). The laser scanning speed and hatch spacing parameters were optimised to obtain high-density specimens, while the laser power was fixed at 190 W, and the powder thickness was set to 40 μm. The island scanning strategy with 67° rotation between subsequent layers was used to minimise porosity (e). Cubic specimens with dimensions of 7 × 7 × 8 mm3 were fabricated to optimise the process parameters and analyse microstructural evolution.
Figure 1. Schematic diagram: (a) the solution and ageing HT, (b) the equilibrium solidification phase diagram of the Ni-based superalloy, (c) geometric schematic of as-fabricated tensile and cubic specimens, (d) dimensions of the tensile specimens and (e) the used scanning strategy.
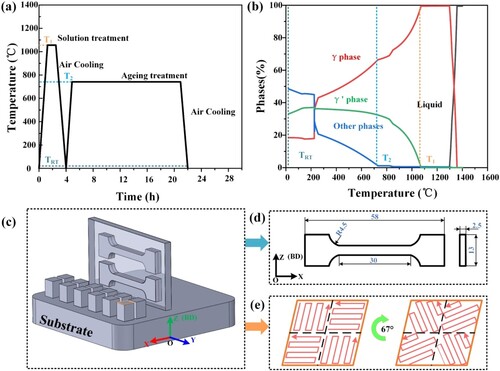
To explore the effects of HT on the microstructure and mechanical properties, a sintering furnace (SX-G20133, China) protected by argon cover gas flowing was used. The equilibrium solidification phase diagram was calculated using JMatPro 7.0 software (Sente Software Ltd, UK) with the TTNi8 database. a shows that the HT strategy consisted of two parts: the solution treatment and the ageing treatment. All as-fabricated (AB) specimens were heated to temperature T1 for 2 h, followed by air cooling to homogenise the microstructure and dissolve the harmful phases in the AB specimens (Harte et al. Citation2020). The ageing treatment was performed at T2 for 16 h to precipitate the γ’ phase. Solution temperature T1 and ageing temperature T2 were determined using the equilibrium solidification phase diagram (b). To isolate the effect of TiB2 on strength improvement, all specimens were heat treated under the same conditions (1050°C /2 h + 750°C /16 h), followed by air cooling.
2.4. Mechanical and microstructural characterisation
As c shows, the tensile specimens were horizontally sectioned perpendicular to the build direction from both the as-fabricated and heat-treated plates with a dimension of 70 × 30 × 2.5 mm (length x width x thickness). The dimensions of the tensile specimens are shown in d. The tensile tests were performed at RT using a microcomputer-controlled electronic universal testing machine (FBS-100KNW, FBS, Shenzhen, China) with a constant extension rate of 0.03 min−1. The QJ212 (Shanghai, China) uniaxial tensile testing system was used to perform elevated-temperature (900°C and 1,000°C) tensile testing with strain rates of 0.014 and 0.07 min−1 before and after the yield stage, respectively. The microstructure was examined using an optical microscope and a field-emission scanning electron microscope. Grain orientation and grain boundary distribution were analysed using electron backscatter diffraction (EBSD) with a step of 1 μm. An X-ray diffraction (XRD) instrument (Smart Lab 3 kW, Japan) equipped with Cu-Kα radiation was used to detect the phase composition in the 2θ range of 30°–100°, with a step size of 3°.
3. Results
3.1. The designed alloy composition and feedstock
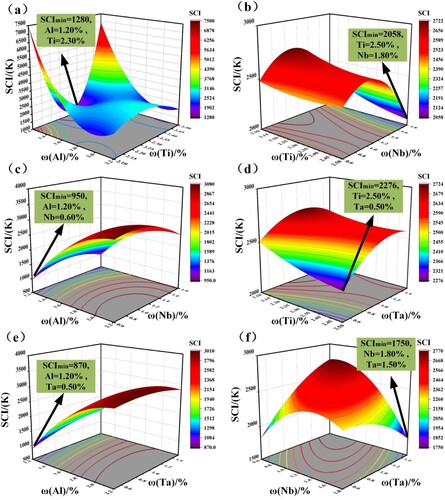
The 3D graphs of the RSCI response surface were built from a regression model to minimise the SCI indicator (). The purple-coloured portion of the graph indicates lower SCI values. When only 2 chemical components are graphed for 3D response plots in and , the other chemical components’ values are fixed at the middle values of the original range (). The surface shows that a reduction in Al contributed the most to the reduction in SCI value; the minimum values were 1280, 950, and 870 from the a, c and e, respectively, and the content of Al was minimum during this time (1.2%). However, the interaction of Al and Ti2 played a significant effect on the SCI when the Ti content was lower or higher than 2.30% and two peaks were generated (a). b and d show that the contribution of Ti was second only to the contribution of Al and that increasing the Ti content reduced the SCI when the Al content was fixed at 1.7%. Furthermore, the combination of increasing Ta and decreasing Nb was found to reduce the SCI value, as shown in f. Based on the simulation, the optimum combination of Al, Ti, Nb and Ta to achieve a minimum SCI was 1.2%, 2.3%, 1.1% and 0.6%, respectively.
Figure 2. 3D response surface graphs showing the optimal region of the solidification crack index (SCI) in terms of elements combinations: (a) Al and Ti, (b) Ti and Nb, (c) Al and Nb, (d) Ti and Ta, (e) Al and Ta and (f) Nb and Ta.
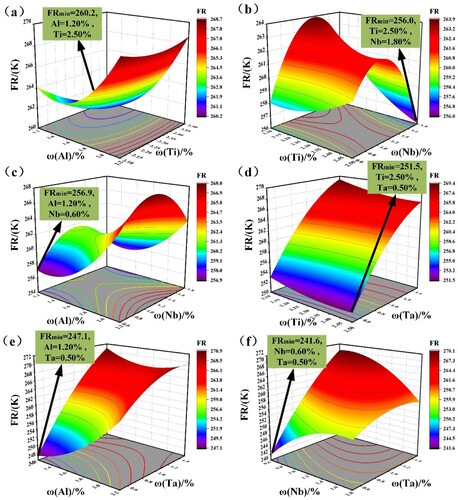
shows the surface diagrams of the FR depending on the fractions of Al, Ti, Nb and Ta. It was found that the Al and Ta contents affected the FR indicator more than did the Ti and Nb contents. Furthermore, the FR value decreased with a decrease in the Al content. The surface diagrams show that increasing Ta significantly enhanced the FR value. It should be noted that the combination of Al 1.2%, Ti 2.5%, Nb 1.8% and Ta 0.6% was optimal in decreasing the FR value.
Figure 3. 3D response surface graphs showing the optimal region of the freezing range (FR) in terms of element combinations: (a) Al and Ti, (b) Ti and Nb, (c) Al and Nb, (d) Ti and Ta, (e) Al and Ta and (f) Nb and Ta.
Generally, the volume fraction of the γ’ phase increased with an increase in the Al, Ti, Nb and Ta elements, whereas the SAC presented an opposite tendency compared to the increase in the γ’ phase based on the simulation obtained in Equations Equation9(9)
(9) and Equation1
(1)
(1) 0. In this study, a multi-objective optimisation (Equations 4-6) was carried out using a desirability function to optimise the contents of Al, Ti, Nb and Ta in terms of minimising the SCI, FR and SAC indicators while maximising the value of the γ’ phase volume fraction at 900°C. The solution with the highest desirability among 97 solutions suggested by the regression models (Equations 7-10) was selected as our optimal solution. The chosen solution showed that the second-order RSM regression models predicted that the value of the γ’ phase volume fraction at 900°C, the SCI, the SAC and the FR were optimal when the values of the material composition parameters were 1.94% Al, 2.4% Ti, 1.5% Nb and 1.25% Ta. The chemical composition of the designed Ni-based alloy (SD01) and the atomised powder are presented in .
Table 2. Designed composition and chemical composition of SD01 powder (wt.%).
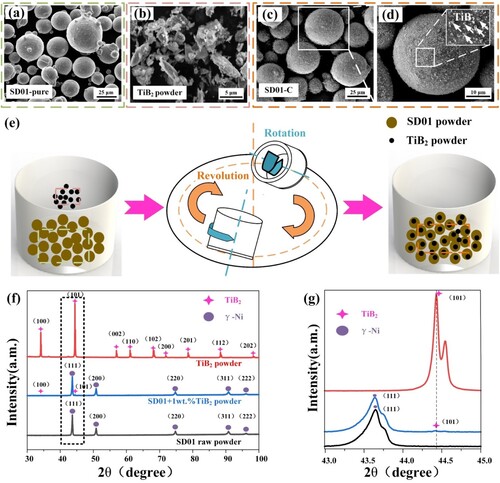
a and b show the morphologies of the spherical SD01 powder and the irregular-shaped TiB2 powder, respectively. The particle distributions of spherical SD01 powder were examined at D10 = 19.35 μm, D50 = 33.85 μm, and D90 = 55.52 μm, while the irregular-shaped TiB2 powder had a mean size of 500 nm. The schematic diagram of the planetary mixture is shown in e. After the high-speed mixture, the TiB2 powder uniformly adhered to the SD01 surface, and no apparent clusters were formed (c-d). The XRD spectra of the TiB2 submicron particles, SD01 raw powders and SD01 composite (SD01-C) powders are shown in f. Note that the addition of 1 wt.% TiB2 submicron particles and the planetary powder mixture process did not influence the main diffraction peak of SD01. Furthermore, g shows the TiB2 peaks in the SD01-C powder, suggesting that the TiB2 submicron particles remained stable in the composite powder during the entire mixture process.
Figure 4. Surface morphology of powders: (a) for SD01 powder, (b) for TiB2 powder, (c) and (d) for SD01-C. The mixture process is shown in (e). X-ray diffraction (XRD) results of the powder specimens: (f) 30°–100° scan pattern and (g) 43°–45° local scan pattern.
shows the comparison between the designed SD01 and typical precipitation-strengthened alloys (ABD-850 and IN738LC alloys) in terms of the FR, SCI and γ’ volume fraction indicators using Scheil non-equilibrium solidification analysis and equilibrium solidification analysis. The FR (Fs = 0 – Fs = 0.99) values of ABD-850, SD01 and IN738LC are 249.52, 261.63 and 268.40 K, respectively. Generally, the last stage of solidification (Fs = 0.9 – Fs = 0.99) was considered the crucial period for crack initiation. A higher FR (Fs = 0.9 – Fs = 0.99) value implied that the incomplete bridging grain may cause residual liquid to remain on the boundaries, further causing hot cracking as a result of the residual stresses generated during the rapid cooling. As shown in b, the critical FR (Fs = 0.9 – Fs = 0.99) values of ABD-850, SD01 and IN738LC were 80.82, 80.35 and 131.06 K, respectively, indicating that SD01 may offer the best LPBF processability. The SCI was also used to measure hot cracking behaviour. A higher SCI value indicated that more phases, such as Ni3Ti and MC, could be precipitated from the matrix, leading to the release of residual stress (Cai et al. Citation2006; Ding et al. Citation2019). c and d reveal that SD01 exhibited a lower SCI (Fs = 0.9 – Fs = 0.99) value (∼2,212.8 K) compared to IN738LC (∼3,673.2 K), but this value was slightly higher than the ABD-850 (∼2,173.8 K). A lower SCI value generally presented a stronger resistance to hot cracking during LPBF process (Tang et al. Citation2021), suggesting that the SD01 might exhibit similar LPBF processability with ABD-850 but much better than the IN738LC.
Figure 5. Scheil solidification curves of various alloys using Thermo-Calc with the TCNI9 database: (a) over the full range of solid fraction and (b) in the range of 0.9–0.99, (c) and (d) are the SCI values calculated based on (a) and (b), and (e) and (f) are the γ and γ’ volume fractions versus temperature, respectively.
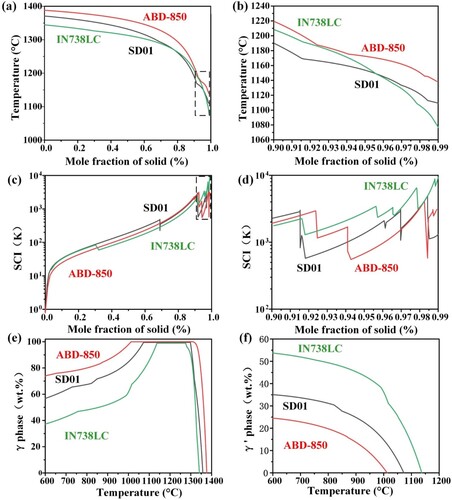
Soild-state cracking was typically attributed to the residual stresses induced by solidification shrinkage coupled with the formation of the γ’ phase during HT (Yu et al. Citation2022); γ matrix ductility became most vulnerable at 0.5–0.8 Tsolidus (Singh and Andersson Citation2018). Generally, the increase in the fraction of the γ’ phase resulted in an increase in the risk of solid-state cracking. e and f show the variation of the γ matrix fraction and the γ’ phase fraction, respectively, with regard to temperature. Note that the γ’ phase volume fraction of SD01 was lower than that of IN738LC but higher than that of ABD-850 within the entire temperature range, implying that solid-state cracking may occur during the LPBF of SD01 under the non-optimal LPBF conditions, a topic which is further investigated in the next section.
3.2. Microstructure of the as-fabricated specimens
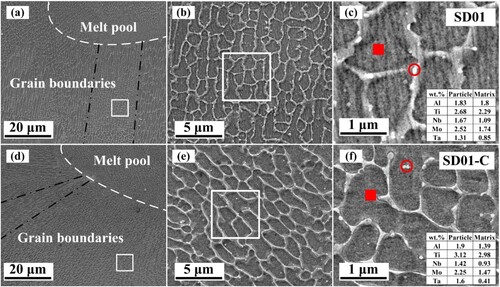
The microstructures of the SD01 and SD01-C under the scanning electron microscope (SEM) inspection are shown in . The SD01 (a-b) and SD01-C (d-e) were mainly characterised by cellular structures, while TiB2 addition promoted sub-grain boundary formation, as smaller cellular structures were formed in SD01-C. A number of white particles were found in the sub-grain boundaries and cells from SD01 (b). The energy dispersive spectrometry (EDS) analysis of the particles and the matrix of SD01 is shown in c, which demonstrates the higher contents of Ti, Nb, Mo and Ta in the particles, indicating that they are MC-type carbonitrides; this finding shows agreement with the literature (Donachie and Donachie Citation2002). In addition, based on the Scheil non-equilibrium simulation, the SD01 alloy may have a 0.4% mole volume fraction of carbonitride and a 3.3% mole volume fraction of Ni3Ti in the LPBF as-fabricated specimen. The EDS analysis of SD01-C in f suggests that the white particles were mainly rich in Al, Ti, Nb, Mo and Ta elements. It is worth noting that the Al element was precipitated from the γ phase, indicating that the addition of TiB2 promoted the precipitation of the main components of γ’, which may have affected the mechanical performance of the SD01-C composite.
Figure 6. Scanning electron microscope (SEM) microstructure and energy dispersive spectrometry (EDS) analysis of the SD01 and SD01-C. (a)–(b) and (d)–(e) are the SEM morphologies of the specimens under different magnifications, (c) and (f) show the EDS analysis of the matrix and the particles from the SD01 and SD01-C specimens.
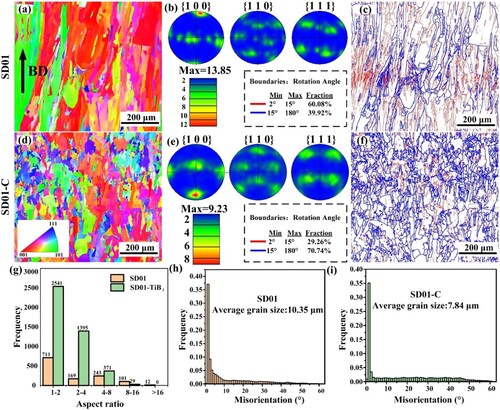
shows the crystal orientation, grain morphology and grain boundary of the SD01 and SD01-C based on the EBSD inspection. Most of the grains in SD01 exhibited typical columnar structures parallel to the build direction (a). The grains of SD01-C were more refined, and the average equivalent grain size was 7.84 μm, which was smaller than that of SD01 (10.35 μm), implying the grain refinement induced by the addition of 1 wt.% TiB2. The low maximum multiple of the uniform density of the SD01 and SD01-C in the pole figure (PF) maps were determined to be 13.85 and 9.23, respectively, indicating that TiB2 addition also contributed to weakening the grain texture (Deng et al. Citation2018). The aspect ratio (AR) obtained from the inverse pole figure (IPF) orientation diagram is shown in g. The total grain numbers of SD01 and SD01-C in the IPF region were found to 1,236 and 4,336, respectively, confirming that TiB2 addition had a significant effect on grain refinement. In the range of 1–4 AR, the frequency of SD01 (3936) was higher than that of SD01-C (880). The frequencies of SD01 and SD01-C in the range of 4–8 AR were 243 and 371, respectively. Grain refinement could promote significant transformations of the grain boundary (c and f). The fraction of high-angle grain boundaries (HAGBs) in the SD01 was 39.92%, while the value increased to 70.74% in the SD01-C. In general, HAGBs contain more dislocations (Tan et al. Citation2022b; Yang et al. Citation2021), and this might be caused by the introduction of TiB2 particles. The increased dislocations and fine grains might have a significant impact on the mechanical performance improvement of the composite, which will be studied in the next section.
Figure 7. Inverse pole figure (IPF) maps of (a) SD01 and (d) SD01-C, pole figure (PF) maps of (b) SD01 and (e) SD01-C, and (c) and (f) grain boundary map. Red lines represent low-angle grain boundaries (LAGBs, 5°−15°), while blue lines are high-angle grain boundaries (HAGBs, > 15°) in (c) and (f). (g) Grain aspect ratio distribution of SD01 and SD01-C. Grain boundary length density as a function of misorientation angle of (h) SD01 and (i) SD01-C.
3.3. Characteristics of phase transformation after heat treatment
a and d show that the sub-grain boundaries were dissolved compared to the as-fabricated specimens (a), which were replaced by many net-structured spherical γ’ particles. The EDS results (e) show that the contents of Al, Ti, Nb and Ta in the precipitated phase were higher than those in the matrix, suggesting that the spherical precipitates were γ′ phase. Previous studies (Reed Citation2006) have proven that the γ′ phase is a FCC-like L12 ordered phase of composition Ni3X, where X is Al, while Ti, Nb and Ta could replace the Al in γ′ phase (Jena and Chaturvedi Citation1984; Tang et al. Citation2021). Also, the spherical precipitate morphology is a typical feature of γ′ phase in nickel-based superalloys (Haines et al. Citation2022; Reed Citation2006). Generally, a spherical morphology of γ′ precipitates indicates a near-zero γ-γ′ lattice misfit (Yoo Citation2005). It is worth noting that the precipitates were spatially aligned along the network of ablated sub-grain boundaries, suggesting that elastic energy played a significant role in controlling the microstructure and that γ′ phase nucleation sites would preferentially appear at grain boundaries (Seitz and De Fontaine Citation1978; Su and Voorhees Citation1996). b presents the SEM image of SD01-C after HT, in which sub-grain boundaries disappeared, but the morphology of the precipitated phase was cubic in shape and irregular. Compared to the γ matrix, the EDS analysis indicates that the Al, Ti, Nb, Ta contents were higher in the cubic precipitates (c/e), especially Nb and Ta, while the Cr, Mo and W contents were higher in the irregular precipitates, which might be related to the precipitation of M23C6. Moreover, the γ’ precipitates were formed and examined at the grain boundaries as well as within the grains in SD01-C, suggesting that the addition of TiB2 may provide intragranular nucleation sites.
Figure 8. SEM microstructure, EDS analysis and EBSD analysis of the SD01 and SD01-C after HT. (a)–(d) SEM morphologies of the specimens at different magnifications; (e) EDS analysis of the matrix and the precipitation of SD01 and SD01-C; (g) and (h) the inverse pole figure (IPF) maps of SD01 and SD01-C; (f) and (i) the grain boundary map of SD01 and SD01-C.
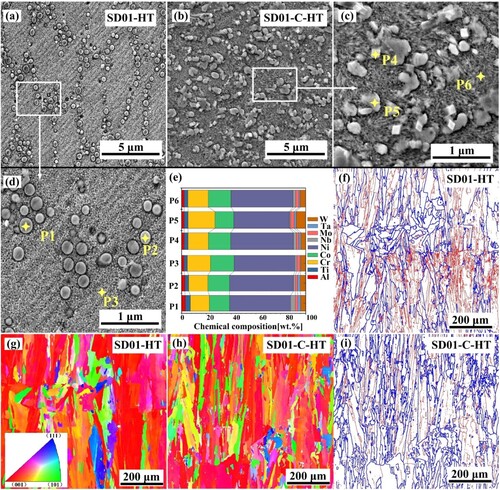
The fraction and average size of the γ′ phase were calculated using the ImageJ Software. The γ′ phase fractions of SD01 and SD01-C were 21% and 40.2%, respectively. The spherical γ′ phase was 166 nm in diameter and the average length of the cubic and irregular precipitates was 332 nm. The SEM images showed the γ′ particles with spherical shapes in SD01, while TiB2 addition promoted M23C6 precipitation and irregularity of the cubic γ′ phase.
g and h show the IPF maps of the SD01 and SD01 -C. After HT, the average grain sizes of SD01 and SD01-C increased by 44% and 17%, respectively, indicating that TiB2 addition could hinder the growth of grains during HT. Moreover, the fraction of low-angle grain boundaries in the SD01 increased from 60.08% to 63.85% after HT (c/f), while the value in the SD01-C increased from 29.26% to 32.78% after HT (f/i), suggesting that low-angle grain boundaries could make grain boundaries more tortuous, leading to the grains slip difficulties (Birosca, Gioacchino, and Stekovic Citation2014; Wei et al. Citation2021).
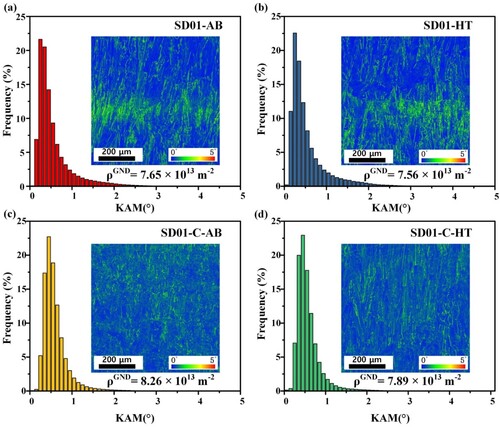
shows the kernel average misorientation (KAM) maps of SD01 and SD01-C, offering a qualitative indication of the degree of plastic deformation of these specimens (Brewer, Field, and Merriman Citation2009). The average KAM values of SD01-AB and SD01-HT were calculated to be 0.55° and 0.54°, while the average KAM values of SD01-C-AB and SD01-C-HT were calculated to be 0.59° and 0.57°, indicating a reduction in the plastic deformation regions within the material due to the release of residual stress after HT. The dislocation densities of the four specimens were calculated using the KAM data via the formula (Wong, Hadadzadeh, and Wells Citation2018): , where KAMav is the average KAM value, μ is the step of EBSD (1 μm in this work) and b is the Burgers vector (0.25 nm in Ni-based superalloys (Konijnenberg, Zaefferer, and Raabe Citation2015; Zhang et al. Citation2021)). The geometrically necessary dislocation density of the four specimens were 7.65 × 10¹³ m−2 (SD01-AB), 7.56 × 10¹³ m−2 (SD01-HT), 8.26 × 10¹³ m−2 (SD01-C-AB) and 7.89 × 10¹³ m−2 (SD01-C-HT), respectively.
Figure 9. Kernel average misorientation (KAM) maps and calculation of: (a) SD01-AB; (b) SD01-HT; (c) SD01-C-AB; (d) SD01-C-HT.
3.4. Mechanical properties
The engineering stress–strain curves for the SD01 and SD01-C at RT, 900°C and 1000°C are shown in a–c, respectively. The ultimate tensile strength (UTS) of the SD01-AB at RT was determined to be 954.31 ± 19.03 MPa and its elongation was 29.98 ± 1.14% (a). In comparison, the SD01-HT was found to possess an ultrahigh UTS (1505.17 ± 34.39 MPa), and its elongation reached 20.08 ± 1.02% because of the precipitation of the γ′ phase. Moreover, the UTS values of SD01-C-AB and SD01-C-HT at RT are 1117.15 ± 36.72 MPa and 1327.75 ± 53.05 MPa, respectively (a). Compared to the SD01, the UTS values of SD01-C-AB was improved by 14.58%, while the UTS values of SD01-C-HT was reduced by 13.36%. The elongation of SD01-C-AB and SD01-C-HT decreased because of the formation of brittle phases, such as the γ′ phase, M23C6 and the added TiB2 particles. It is worth noting that the yield strength values of SD01-C-AB and SD01-C-HT were 883.76 ± 29.04 MPa and 1244.97 ± 49.74 MPa, respectively, which were 16.75% and 6.7% higher than SD01-AB (883.76 ± 29.04 MPa) and SD01-HT (883.76 ± 29.04 MPa). The results indicate that adding TiB2 particles offer a beneficial effect on the yield strength of the designed SD01 alloy under room-temperature condition.
Figure 10. Engineering stress-strain curves of the as-fabricated and heat-treated original and SD01-C: (a) at room temperature, (b) at 900°C, and (c) at 1,000°C; (d) a summary of the ultimate tensile strength (UTS) versus elongation at room temperature and at 900°C between the designed materials in this study and the literature (Chen et al. Citation2020; Chen et al. Citation2022; Marchese et al. Citation2018; Sun et al. Citation2021; Tang et al. Citation2020; Wang et al. Citation2012; Yang et al. Citation2021; Zhang et al. Citation2022a; Zhang et al. Citation2022b; Zhou et al. Citation2020).
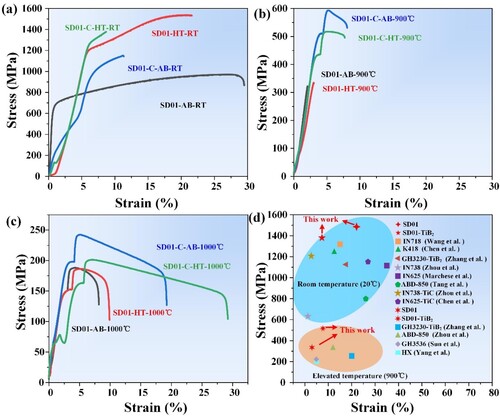
The UTS values of the SD01-C and SD01 at 900°C were found to be 593.45 and 328.82 MPa, respectively (b). After HT, the UTS and elongation of SD01-C were found to drop to 469.06 MPa and 7.71%, respectively, because of the dissolution of dislocations, while the UTS of the SD01 also dropped to 315.04 MPa, but elongation increased to 3.02%. In addition, the SD01-C exhibited a notable improvement in strength and elongation at 1,000°C. The UTS of the SD01-C-AB at 1,000°C was significantly enhanced to 242.2 MPa, showing a significant improvement compared with the SD01-C-HT. However, the improvement was not obvious between SD01-AB and SD01-HT at 1,000°C, indicating that the majority of the γ′ phase in SD01 might be dissolved into the matrix under the 1,000°C condition.
The mechanical properties of the designed Ni-based superalloy and composite were compared with those of a wide range of typical Ni-based superalloys processed by LPBF, as summarised in d. Among the superalloys, SD01 achieved the highest strength at RT, whereas among many ceramic-reinforced alloys, SD01-C achieved the highest strength at 900°C. This finding indicates that the addition of 1 wt.% TiB2 was more beneficial in improving the elevated temperature strengths of the materials.
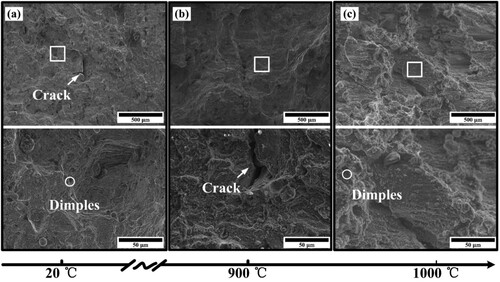
and show the varying fracture morphologies of the different specimens after HT. The SD01 fracture at RT was ductile filled with dimples and accompanied by secondary cracks (a). Many tearing steps were formed on the fractured surface of SD01 at an elevated temperature (b and c), and the surface featured a flat breaking plane, although the fractured surface was coated with oxide layers (b and c); this indicated that the fracture form was brittle. During elevated-temperature stretching, thermal stress promoted SD01 grain boundary oxidation and embrittlement, resulting in tearing steps (Fang et al. Citation2022). In the fracture morphologies (a) of SD01-C, both dimples and tear features were formed and inspected, and they showed a ductile–brittle integrated fracture. Compared with those of SD01, the tearing steps of SD01-C decreased at elevated temperatures, as evidenced by the large fibre area (b and c).
Figure 11. Fracture morphologies of the heat treated SD01 alloy: (a) at room temperature, (b) at 900°C and (c) at 1,000°C.
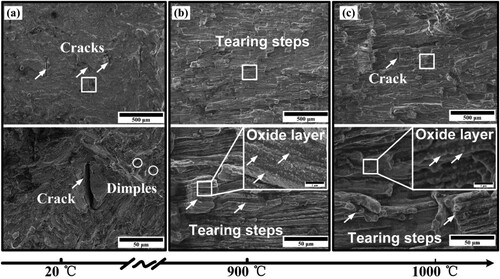
Figure 12. Fracture morphologies of heat-treated SD01-C: (a) at room temperature, (b) at 900°C and (c) at 1000°C.
4. Discussion
4.1. Effects of TiB2 on microstructure and precipitation behaviour
Section 3.3 has shown that with an increase in the fraction of the γ′ phase, the spherical γ′ phase became cubic shaped and the M23C6 phases precipitated from the γ matrix after TiB2 addition, suggesting that the addition of TiB2 affected the ageing behaviour of SD01-C (Fang et al. Citation2022; Tan et al. Citation2022a).
The γ′ phase fractions of SD01 and SD01-C were examined to 21% and 40.2%, respectively (c-d). The variation in γ′ phase fraction can be explained as follows. First, the TiB2 particles provided more nucleation sites for the γ′ phase, promoting the formation of precipitate nuclei via heterogeneous nucleation (Zhang et al. Citation2021). Second, the mismatch in physical property between TiB2 and the γ matrix increased the dislocation density (as demonstrated by EBSD in g), which could reduce the growth activation energy energy (Tan et al. Citation2022a), providing more channels for the diffusion of solute atoms, accelerating the diffusion rate, and thus increasing the nucleation rate (He et al. Citation2021; Ma et al. Citation2020). Therefore, the precipitation behaviour is enhanced, and the aging strengthening process is accelerated, forming a large number of γ′ phase precipitates.
Note that the shape of γ′ precipitates was related to the γ-γ′ mismatch. It was known that the γ′ precipitates occurred as spheres at 0-0.2% lattice mismatch, became cubes at mismatches around 0.5-1%, and then became plates at mismatches above about 1.25% (Sims, Stoloff, and Hagel Citation1987). In this study, the lattice mismatch of γ-γ′ in SD01 was calculated to be 0.3% using the JMat Pro Software, suggesting that the formed γ′ precipitates were more in spherical shape. Previous studies have revealed that coherent strain energy has a significant effect on the evolution of γ′ phase shape (Li and Chen Citation1998; Zhao et al. Citation2013). The γ′ phases are mainly spherical because the anisotropic coherent strain energy could be negligible when the lattice misfit is small (Liu et al. Citation1998). When the γ′ phases become coarse, the coherent strain energy increases and the γ′ phases are transformed into cubic and irregular (Yu et al. Citation2021). It may be concluded that the addition of 1 wt.% TiB2 increased the lattice misfit and thus reduced the coherent strain energy, promoting the change in morphology of the γ′ phases.
Previous studies have demonstrated the classical reaction in Ni-based superalloy: MC + γ → M23C6 + γ′ (Fang et al. Citation2022; Yang et al. Citation2006). The thermal stability of primary MC carbide decreases significantly with a decrease in thermal exposure temperature and Al also promotes the formation of γ′ (Sundararaman, Mukhopadhyay, and Banerjee Citation1988). In our study, MC phases distributed on sub-grain boundaries in the as-fabricated specimens were found to be rich in Ti, Nb, Mo and Ta (c and f). After HT, the MC in SD01 and SD01-C was diffused to the matrix, while the γ′ phase was precipitated from the matrix. Notably, M23C6 was observed only in the SD01-C, not in SD01. The reaction of MC carbides with the matrix to form M23C6 carbide is an element diffusion-controlled process in which Nb diffuses to the matrix, and Cr diffuses to the carbide (Liu et al. Citation2023). During HT, the Ti, Nb and Ta elements diffuse to the γ′ phase to replace the Al elements so that the formation of Ni3(Al, Ti, Nb, Ta) is easier compared to that of Ni3Al because of the lower required formation energy (Park et al. Citation2022). Furthermore, the addition of TiB2 promoted the precipitation of MC and M23C6, as well as lowered the transformation temperature, confirming that the M23C6 phase could be formed only in SD01.
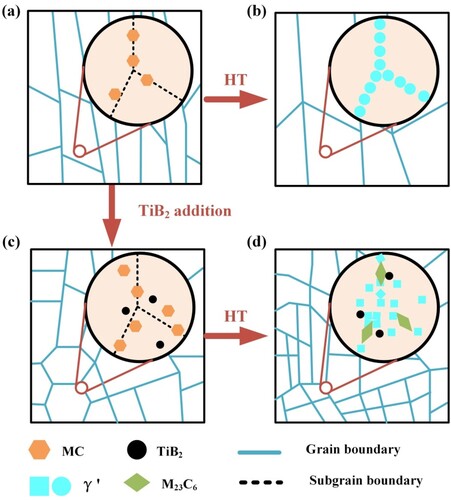
In addition, the EBSD (g and h) analyses demonstrate that the grain became coarse after HT, while TiB2 addition refine the grain size before and after HT. shows the effects of the TiB2 particles on promoting grain nucleation during the LPBF process. A large number of sub-grains were formed during the ageing HT, while M23C6 type carbides and the γ′ phase precipitated at the sub-grain boundaries to inhibit sub-grain growth, resulting in a decrease in grain size after HT.
Figure 13. Schematic diagram of the precipitation behaviour of SD01 and SD01-C at different conditions: (a) as-fabricated SD01; (b) SD01 after HT, (c) as-fabricated SD01-C and (d) SD01-C after HT.
4.2. Possible strengthening mechanisms
The tensile test demonstrates that the yield strength of SD01-C was improved compared with that of the original SD01 at RT and at elevated temperatures. The improvement in mechanical performance might be attributed to various strengthening mechanisms, which primarily include the following: (1) grain boundary strengthening, induced by the grain refinement, which follows the Hall–Petch relationship (); (2) second-phase strengthening induced by TiB2 addition and γ′ phase precipitation (
); (3) solid-solution strengthening (
), determined by the modulus mismatch and lattice mismatch between solute atoms and solvent atoms; (4) dislocation strengthening (
) induced by increased dislocation density; and (5) load-bearing strengthening (
) caused by the stress redistribution between the reinforced particles and the matrix.
The yield strength of SD01 Ni-based superalloys at RT was estimated using the following equation (Goodfellow Citation2018; Kozar et al. Citation2009; et al. Citation2022):
(11)
(11) where
is the lattice friction stress of Ni-based superalloys, which is 37.0 MPa at RT (Roth, Davis, and Thomson Citation1997). As the HAGBs suppressed dislocation movement, the average grain size had a significant influence on yield strength. Grain boundary strengthening can be expressed using the Hall–Petch equation as follows (Weertman Citation1993):
(12)
(12) where k is the Hall-Petch constant, which, in Ni-based superalloys is generally 710–750 MPa/μm1/2 (Kozar et al. Citation2009), and d is the average grain size. The average sizes of SD01-AB, SD01-HT, SD01-C-AB and SD01-C-HT measured using EBSD were 10.35, 14.91, 7.84 and 6.49 μm, respectively. With this,
was calculated as 233.13, 194.23, 267.86 and 294.40 MPa, respectively.
Another strengthening mechanism, dislocation strengthening, can be expressed using Taylor’s equation as follows (Kim, Choe, and Lee Citation2019):
(13)
(13) where M is the Taylor factor (3.06), a is the constant (0.33), G is the shear modulus (85.3MPA), b is the magnitude of the Burgers vector of dislocation (0.25 nm), and ρ is the dislocation density (Carter Citation2013; Mughrabi Citation1987; Rajendran, Petley, and Rehmer Citation2013). The geometrically necessary dislocation density of the four specimens were 7.65 × 10¹³ m−2 (SD01-AB), 7.56 × 10¹³ m−2 (SD01-HT), 8.26 × 10¹³ m−2 (SD01-C-AB) and 7.89 × 10¹³ m−2 (SD01-C-HT), respectively (Section 3.3).
was calculated as 184.65, 183.56, 191.87 and 187.53 MPa, respectively.
The solid solution hardening of the Ni-based superalloy matrix is determined by the effect and concentration of each element as follows (Xu et al. Citation2020):
(14)
(14) in which ci is the degree of solubility of atomic species and is substituted using the data from the EDS of the γ-Ni matrix, and ki is the strengthening index of each element (Roth, Davis, and Thomson Citation1997). The
of the SD01-AB, SD01-HT, SD01-C-AB, and SD01-C-HT was calculated as 286.08, 297.68, 262.23 and 296.04 MPa, respectively.
The contribution of the γ’ phase through HT and ageing may be expressed as follows (McLean Citation1985; Xu et al. Citation2020):
(15)
(15) where M is the Taylor factor, G is the shear modulus, b is the Burgers vector, and Ls is the spacing between the precipitates, which is determined by
, the volume fraction of γ’, and
, the size of γ’, using the following equation (Goodfellow Citation2018):
(16)
(16) where the Ls of the SD01 and TiB2 modified SD01 was calculated as 167.74 and 135.83 nm, respectively. Therefore, the contribution of γ’ to strength was calculated as 385 and 476 MPa.
In addition, from the TiB2 particles formed by the matrix is expected, consistent with the Ashby-Orowan relationship (Shang et al. Citation2019):
(17)
(17) where G is the shear modulus of the Ni-based alloy matrix, b is the Burgers vectors, f is the volume fraction of the TiB2 particle and X is the average diameter of the TiB2 particle. In this study, f is 1% and X is 600 nm. Hence, the increase in the yield strength of SD01 as a result of the TiB2 particles was calculated as 132 MPa.
Finally, load-bearing strengthening can be estimated as follows (Chen et al. Citation2015):
(18)
(18) where
is the yield strength of the SD01 matrix (721 MPa), and
is the volume fraction of the reinforcing particles, so
is 10.8 MPa.
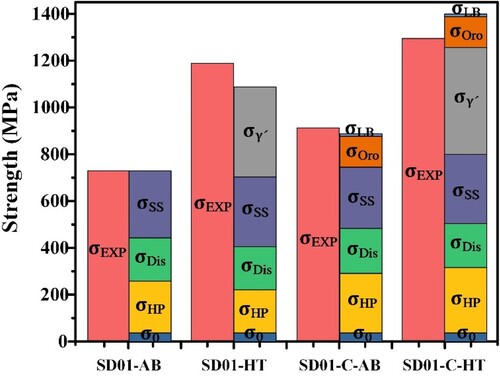
summarised the calculated strengthening contributions from different mechanisms compared to the experimental results; the calculated yield strength values of the SD01-AB, SD01-HT, SD01-C-AB and SD01-C-HT were 728.42, 1087.11, 852.26 and 1313.52 MPa, respectively. The calculated results of AB specimens were close to the actual experimental results. The calculated yield strength of SD01-HT was slightly lower than the experimental value, while the calculated value of SD01-C-HT was slightly higher than the experimental value, which might be attributed to the regional locality of the precipitates, the size of the precipitates examined in the calculation and the formed metallurgical defects, which can also affect the calculated values (Gao et al. Citation2022; Lee et al. Citation2022). Based on the theoretical calculation of yield strength in , the deviation induced by TiB2 addition in the AB specimens may be attributed to Orowan strengthening and load-bearing strengthening. In addition, γ’ phase precipitation played an important role in improving the yield strength of the heated specimens. Note that the contribution of dislocation strengthening in SD01-C-HT was obviously higher than that in SD01 after HT, indicating that TiB2 addition was more effective in promoting the formation of recrystallisation than the role of grain growth in the HT process.
Figure 14. The calculated and experimentally obtained strengthening contributions of the SD01-AB and SD01-C before and after HT.
The elevated-temperature tensile tests presented in section 3.4 confirmed that TiB2 addition significantly improved the material’s elevated temperature strength and elongation. The yield strengths of SD01 before and after HT were similar under 900°C and 1,000°C, indicating that the spherical γ’ phase gradually dissolved with an increase in temperature. EquationEquation 1(1)
(1) 4 shows that the addition of 1 wt.% TiB2 contributed to strengthening the 142.8 MPa stresses. Notably, M23C6-type carbides induced by HT were relatively less unstable at high temperatures, which cannot provide sufficient reinforcing effects (Zhang et al. Citation2021). However, the high-temperature tensile testing revealed that MC-type carbides were excellent reinforcing phases at high temperatures. The deviation between SD01 and SD01-C can thus be expressed as follows:
(19)
(19) where the solution strengthening deviations of the AB and HT are −23.85 MPa and −1.64 MPa, respectively, and the yield strength can be found in b. Therefore, the contribution of carbides to strength of SD01 and SD01-C was calculated to be 44.24 and 124.21 MPa, respectively, confirming that carbides play an important role in improving the elevated strength of SD01-C material.
4. Conclusion
In this study, a novel crack-free precipitation strengthened Ni-based superalloy was designed to improve both LPBF processability and mechanical performance. The effects of 1 wt.% TiB2 particle addition on strength were also systematically investigated in an SD01 composite (SD01-C). The following conclusions were drawn from this study:
The elements Al, Ti, Nb and Ta were optimised to prevent crack formation in designing the precipitation-strengthened Ni-based superalloy using RSM. The contents of the Al, Ti, Nb and Ta elements for the designed crack-free SD01 alloy were 1.94%, 2.4%, 1.5% and 1.25%, respectively.
The added 1 wt.% TiB2 played a significant role in microstructure evolution, in which the grain morphology was altered from columnar to cellular structures in the SD01-C material. Furthermore, a large number of in-situ precipitates (e.g. γ′ and M23C6) were formed in the heated SD01-C because of the heterogeneous nucleation. The morphology of the γ′ phase was altered from spherical to cubic structures, primarily induced by the TiB2 addition, which decreased the Gibbs energy change from γ to γ′.
The elevated temperature strength of SD01-C increased with the addition of TiB2 particles. Compared to SD01-AB, the added 1 wt.% TiB2 contributed to over 90% improvement in the UTS values from 266.35 MPa to 509.51 MPa under the 900°C condition. After HT, the UTS values of SD01 and SD01-C were found to be 252.03 and 437.43 MPa, respectively, as a result of recrystallisation and grain growth. These findings indicate that TiB2 played an important role in enhancing high-temperature properties.
Credit authorship contribution statement
Zhongyi Liu: Conceptualisation, Methodology, Investigation, Writing – original draft. Quanquan Han: Conceptualisation, Investigation, Writing – original draft, Funding acquisition. Zhenhua Zhang: Investigation, Validation. Liqiao Wang: Resources, Visualisation. Teng Ma: Writing – review & editing. Zhengjiang Gao: Software. Bo Song: Resources. Hanlian Liu: Methodology. Chuanzhen Huang: Methodology. Rossitza Setchi: Methodology, Project administration.
Data availability
Data will be made available on request.
Disclosure statement
No potential conflict of interest was reported by the author(s).
Additional information
Funding
References
- Birosca, S., F. D. Gioacchino, and S. Stekovic. 2014. “A Quantitative Approach to Study the Effect of Local Texture and heterogeneous Plastic Strain on the Deformation Micromechanism in RR1000 Nickel-based Superalloy.” Acta Materialia 74: 110–124. https://doi.org/10.1016/j.actamat.2014.04.039.
- Brewer, L. N., D. P. Field, and C. C. Merriman. 2009. “Mapping and Assessing Plastic Deformation Using EBSD.” In Electron Backscatter Diffraction in Materials Science, edited by A. Schwartz, M. Kumar, B. Adams, and D. Field. Boston, MA: Springer. https://doi.org/10.1007/978-0-387-88136-2_18.
- Cai, Dayong, Pulin Nie, Jiaping Shan, Wenchang Liu, Yukui Gao, and Mei Yao. 2006. “Precipitation and Residual Stress Relaxation Kinetics in Shot-Peened Inconel 718.” Journal of Materials Engineering and Performance 15 (5): 614–617. https://doi.org/10.1361/105994906X124613.
- Carter, Luke Nelson. 2013. “Selective Laser Melting of Nickel Superalloys for High Temperature Applications.” (PhD dissertation). University of Birmingham.
- Chauvet, E., P. Kontis, E. Jgle, B. Gault, D. Raabe, C. Tassin, J. J. Blandin, R. Dendievel, B. Vayre, and S. Abed. 2018. “Hot Cracking Mechanism Affecting a non-Weldable Ni-Based Superalloy Produced by Selective Electron Beam Melting.” Acta Materialia 142: 82–94. https://doi.org/10.1016/j.actamat.2017.09.047.
- Chen, Zhen, Yongxin Lu, Fan Luo, Shuzhe Zhang, Pei Wei, Sen Yao, and Yongxin Wang. 2022. “Effect of Laser Scanning Speed on the Microstructure and Mechanical Properties of Laser-Powder-Bed-Fused K418 Nickel-Based Alloy.” Materials 15 (9): 3045. https://doi.org/10.3390/ma15093045.
- Chen, L., Y. Sun, L. Li, and X. Ren. 2020. “Microstructure Evolution, Mechanical Properties, and Strengthening Mechanism of TiC Reinforced Inconel 625 Nanocomposites Fabricated by Selective Laser Melting.” Materials Science & Engineering, A. Structural Materials: Properties, Misrostructure and Processing 792: 792. https://doi.org/10.1016/j.msea.2020.139655.
- Chen, Lian-Yi, Jia-Quan Xu, Hongseok Choi, Marta Pozuelo, Xiaolong Ma, Sanjit Bhowmick, Jenn-Ming Yang, Suveen Mathaudhu, and Xiao-Chun Li. 2015. “Processing and Properties of Magnesium Containing a Dense Uniform Dispersion of Nanoparticles.” Nature 528 (7583): 539–543. https://doi.org/10.1038/nature16445.
- Cheng, Xiaopeng, Yanan Zhao, Zhu Qian, Jin Wu, Ji Dong, Zongqing Ma, and Yongchang Liu. 2021. “Crack Elimination and Mechanical Properties Enhancement in Additive Manufactured Hastelloy X via in-Situ Chemical Doping of Y2O3.” Materials Science and Engineering: A 824, https://doi.org/10.1016/j.msea.2021.141867.
- Deng, D., L. P. Ru, Hakan Brodin, and J. Moverare. 2018. “Microstructure and Mechanical Properties of Inconel 718 Produced by Selective Laser Melting: Sample Orientation Dependence and Effects of Post Heat Treatments.” Materials Science and Engineering: A 713 (JAN.24): 294. https://doi.org/10.1016/j.msea.2017.12.043.
- Ding, Wenhong, Yazheng Liu, Jianxin Xie, Li Sun, Tianwu Liu, Fei Yuan, and Jin Pan. 2019. “Effect of Carbide Precipitation on the Evolution of Residual Stress During Tempering.” Metals 9 (6), https://doi.org/10.3390/met9060709.
- Donachie, Matthew J, and Stephen J Donachie. 2002. Superalloys: A Technical Guide. ASM International.
- Dupont, J. N., J. C. Lippold, and S. D. Kiser. 2011. Welding Metallurgy and Weldability of Nickel-Base Alloys. Welding Metallurgy and Weldability of Nickel-Base Alloys. Wiley.
- Fan, Junxiang, Lei Zhang, Shuaishuai Wei, Zhi Zhang, Seung-Kyum Choi, Bo Song, and Yusheng Shi. 2021. “A Review of Additive Manufacturing of Metamaterials and developing Trends.” Materials Today 50: 303–328. https://doi.org/10.1016/j.mattod.2021.04.019.
- Fang, C. Z., H. C. Basoalto, M. J. Anderson, H. Y. Li, S. J. Williams, and P. Bowen. 2022. “A Numerical Study on the Influence of Grain Boundary Oxides on Dwell Fatigue Crack Growth of a Nickel-based superalloy.” Journal of Materials Science & Technology 104: 224–235. https://doi.org/10.1016/j.jmst.2021.06.045.
- Furrer, David, and Hans Fecht. 1999. “Ni-based Superalloys for Turbine Discs.” JOM Journal of the Minerals Metals and Materials Society 51 (1): 14–17. https://doi.org/10.1007/s11837-999-0005-y.
- Gao, Jian, Quanquan Han, Liqiao Wang, Zhongyi Liu, Shwe Soe, Zhenhua Zhang, and Yuchen Gu. 2022. “Laser Powder bed Fusion of TiB2-Modified Cu15Ni8Sn Alloy: Processability, Microstructure and Mechanical Performance.” Materials Science and Engineering: A 855: 143879. https://doi.org/10.1016/j.msea.2022.143879.
- Goodfellow, A. J. 2018. “Strengthening Mechanisms in Polycrystalline Nickel-Based Superalloys.” Materials Science and Technology 34 (15): 1793–1808. https://doi.org/10.1080/02670836.2018.1461594.
- Grilli, M. L., T. Bellezze, E. Gamsjager, A. Rinaldi, P. Novak, S. Balos, R. R. Piticescu, and M. L. Ruello. 2017. “Solutions for Critical Raw Materials Under Extreme Conditions: A Review.” Materials 10 (3), https://doi.org/10.3390/ma10030285.
- Guo, Chuan, Gan Li, Sheng Li, Xiaogang Hu, Hongxing Lu, Xinggang Li, Zhen Xu, et al. 2023. “Additive Manufacturing of Ni-Based Superalloys: Residual Stress, Mechanisms of Crack Formation and Strategies for Crack Inhibition.” Nano Materials Science, https://doi.org/10.1016/j.nanoms.2022.08.001.
- Haines, Michael P., Vitor V. Rielli, Sophie Primig, and Nima Haghdadi. 2022. “Powder bed Fusion Additive Manufacturing of Ni-Based Superalloys: A Review of the Main Microstructural Constituents and Characterization Techniques.” Journal of Materials Science 57 (30): 14135–14187. https://doi.org/10.1007/s10853-022-07501-4.
- Han, Quanquan, Yuchen Gu, Heng Gu, Yingyue Yin, Jun Song, Zhenhua Zhang, and Shwe Soe. 2021. “Laser Powder bed Fusion of WC-Reinforced Hastelloy-X Composite: Microstructure and Mechanical Properties.” Journal of Materials Science 56 (2): 1768–1782. https://doi.org/10.1007/s10853-020-05327-6.
- Han, Quanquan, Yuchen Gu, Jun Huang, Liqiao Wang, Kenny W. Q. Low, Qixiang Feng, Yingyue Yin, and Rossitza Setchi. 2020. “Selective Laser Melting of Hastelloy X Nanocomposite: Effects of TiC Reinforcement on Crack Elimination and Strength Improvement.” Composites Part B: Engineering, https://doi.org/10.1016/j.compositesb.2020.108442.
- Harte, Allan, Michael Atkinson, Albert Smith, Carsten Drouven, Stefan Zaefferer, João Quinta da Fonseca, and Michael Preuss. 2020. “The Effect of Solid Solution and Gamma Prime on the Deformation Modes in Ni-Based Superalloys.” Acta Materialia 194: 257–275. https://doi.org/10.1016/j.actamat.2020.04.004.
- He, Chuang, Lin Liu, Taiwen Huang, Wenchao Yang, Xiaojuan Wang, Jun Zhang, Min Guo, and Hengzhi Fu. 2021. “The Effects of Misfit and Diffusivity on γʹ Rafting in Re and Ru Containing Nickel Based Single Crystal Superalloys—Details in Thermodynamics and Dynamics.” Vacuum 183, https://doi.org/10.1016/j.vacuum.2020.109839.
- Henderson, M. B., D. Arrell, R. Larsson, M. Heobel, and G. Marchant. 2004. “Nickel Based Superalloy Welding Practices for Industrial gas Turbine Applications.” Science and Technology of Welding and Joining 9 (1): 13–21. https://doi.org/10.1179/136217104225017099.
- Jena, A. K., and M. C. Chaturvedi. 1984. “The Role of Alloying Elements in the Design of Nickel-Base Superalloys.” Journal of Materials Science 19 (10): 3121–3139. https://doi.org/10.1007/BF00549796.
- Kim, Young-Kyun, Jungho Choe, and Kee-Ahn Lee. 2019. “Selective Laser Melted Equiatomic CoCrFeMnNi High-Entropy Alloy: Microstructure, Anisotropic Mechanical Response, and Multiple Strengthening Mechanism.” Journal of Alloys and Compounds 805: 680–691. https://doi.org/10.1016/j.jallcom.2019.07.106.
- Konijnenberg, P., S. Zaefferer, and D. Raabe. 2015. “Assessment of Geometrically Necessary Dislocation Levels Derived by 3D EBSD.” Acta Materialia 99: 402–414. https://doi.org/10.1016/j.actamat.2015.06.051.
- Kou, Sindo. 2015. “A Criterion for Cracking During Solidification.” Acta Materialia 88: 366–374. https://doi.org/10.1016/j.actamat.2015.01.034.
- Kozar, R. W., A. Suzuki, W. W. Milligan, J. J. Schirra, M. F. Savage, and T. M. Pollock. 2009. “Strengthening Mechanisms in Polycrystalline Multimodal Nickel-Base Superalloys.” Metallurgical and Materials Transactions A 40: 1588–1603. https://doi.org/10.1007/s11661-009-9858-5.
- Lee, Jung-Uk, Young-Kyun Kim, Seong-Moon Seo, and Kee-Ahn Lee. 2022. “Effects of hot Isostatic Pressing Treatment on the Microstructure and Tensile Properties of Ni-Based Superalloy CM247LC Manufactured by Selective Laser Melting.” Materials Science and Engineering: A 841: 143083. https://doi.org/10.1016/j.msea.2022.143083.
- Li, D. Y., and L. Q. Chen. 1998. “Shape Evolution and Splitting of Coherent Particles Under Applied Stresses.” Acta Materialia 47 (1): 247–257. https://doi.org/10.1016/S1359-6454(98)00323-1.
- Liu, Xudong, Jiangkun Fan, Peizhe Zhang, Kai Cao, Zixiao Wang, Fulong Chen, Degui Liu, Bin Tang, Hongchao Kou, and Jinshan Li. 2023. “Influence of Heat Treatment on Inconel 625 Superalloy Sheet: Carbides, γ'’, δ Phase Precipitation and Tensile Deformation Behavior.” Journal of Alloys and Compounds 930, https://doi.org/10.1016/j.jallcom.2022.167522.
- Liu, Ming, Ljuba Kerschhofer, Jed L Mosenfelder, and David C Rubie. 1998. “The Effect of Strain Energy on Growth Rates During the Olivine-Spinel Transformation and Implications for Olivine Metastability in Subducting Slabs.” Journal of Geophysical Research: Solid Earth 103 (B10): 23897–23909. https://doi.org/10.1029/98JB00794.
- Liu, Feng, Zexin Wang, Zi Wang, Jing Zhong, Lei Zhao, Liang Jiang, Runhua Zhou, et al. 2022. “High-Throughput Method–Accelerated Design of Ni-Based Superalloys.” Advanced Functional Materials 32 (28): 2109367. https://doi.org/10.1002/adfm.202109367.
- Lv, Yuting, Zhe Zhang, Qiang Zhang, Rui Wang, Guangbao Sun, Xizhen Chen, Hongyao Yu, Zhongnan Bi, Jinli Xie, and Guijiang Wei. 2022. “Cracking Inhibition Behavior and the Strengthening Effect of TiC Particles on the CM247LC Superalloy Prepared by Selective Laser Melting.” Materials Science and Engineering: A 858, https://doi.org/10.1016/j.msea.2022.144119.
- Ma, Yu, Ahmed Addad, Gang Ji, Ming-Xing Zhang, Williams Lefebvre, Zhe Chen, and Vincent Ji. 2020. “Atomic-scale Investigation of the Interface Precipitation in a TiB2 Nanoparticles Reinforced Al–Zn–Mg–Cu Matrix Composite.” Acta Materialia 185: 287–299. https://doi.org/10.1016/j.actamat.2019.11.068.
- Marchese, G., M. Lorusso, S. Parizia, E. Bassini, and S. Biamino. 2018. “Influence of Heat Treatments on Microstructure Evolution and Mechanical Properties of Inconel 625 Processed by Laser Powder bed Fusion.” Materials Science and Engineering: A 729: 64–75. https://doi.org/10.1016/j.msea.2018.05.044.
- McLean, M. 1985. “On the Threshold Stress for Dislocation Creep in Particle Strengthened Alloys.” Acta Metallurgica 33 (4): 545–556. https://doi.org/10.1016/0001-6160(85)90018-5.
- Mughrabi, H. J. M. S. 1987. “A two-Parameter Description of Heterogeneous Dislocation Distributions in Deformed Metal Crystals.” Materials Science and Engineering 85: 15–31. https://doi.org/10.1016/0025-5416(87)90463-0.
- Narasimharaju, Shubhavardhan Ramadurga, Wenhan Zeng, Tian Long See, Zicheng Zhu, Paul Scott, Xiangqian Jiang, and Shan Lou. 2022. “A Comprehensive Review on Laser Powder bed Fusion of Steels: Processing, Microstructure, Defects and Control Methods, Mechanical Properties, Current Challenges and Future Trends.” Journal of Manufacturing Processes 75: 375–414. https://doi.org/10.1016/j.jmapro.2021.12.033.
- Park, Ji-Un, Sun-Young Jun, Bong Ho Lee, Jae Hoon Jang, Byoung-Soo Lee, Hae-Jin Lee, Je-Hyun Lee, and Hyun-Uk Hong. 2022. “Alloy Design of Ni-Based Superalloy with High γ′ Volume Fraction Suitable for Additive Manufacturing and its Deformation Behavior.” Additive Manufacturing 52, https://doi.org/10.1016/j.addma.2022.102680.
- Rajendran, R., Vijay Petley, and Birgit Rehmer. 2013. “Dynamic Elastic Properties of Aero-Engine Metallic Isotropic Materials.” Proceedings of the Institution of Mechanical Engineers, Part L: Journal of Materials: Design and Applications 227 (3): 243–249. https://doi.org/10.1177/1464420712454071.
- Reed, R. 2006. The Superalloys: Fundamentals and Applications. Cambridge University Press.
- Reed, Roger C. 2008. The Superalloys: Fundamentals and Applications. Cambridge University Press.
- Roth, H. A., C. L. Davis, and R. C. Thomson. 1997. “Modeling Solid Solution Strengthening in Nickel Alloys.” Metallurgical and Materials Transactions A 28: 1329–1335. https://doi.org/10.1007/s11661-997-0268-2.
- Sanchez, Salomé, Peter Smith, Zhengkai Xu, Gabriele Gaspard, Christopher J. Hyde, Wessel W. Wits, Ian A. Ashcroft, Hao Chen, and Adam T. Clare. 2021. “Powder Bed Fusion of Nickel-Based Superalloys: A Review.” International Journal of Machine Tools and Manufacture 165, https://doi.org/10.1016/j.ijmachtools.2021.103729.
- Seitz, E., and D. De Fontaine. 1978. “Elastic Interaction Energy Calculations for Guinier-Preston Zones in -Cu and -Be.” Acta Metallurgica 26 (11): 1671–1679. https://doi.org/10.1016/0001-6160(78)90077-9.
- Selvaraj, Senthil Kumaran, G. Sundaramali, S. Jithin Dev, R. Srii Swathish, Rahul Karthikeyan, K. E. Vijay Vishaal, Velmurugan Paramasivam, and Fuat Kara. 2021. “Recent Advancements in the Field of Ni-Based Superalloys.” Advances in Materials Science and Engineering 2021: 1–60. https://doi.org/10.1155/2021/9723450.
- Shahwaz, M., Prekshya Nath, and Indrani Sen. 2022. “A Critical Review on the Microstructure and Mechanical Properties Correlation of Additively Manufactured Nickel-Based Superalloys.” Journal of Alloys and Compounds 907, https://doi.org/10.1016/j.jallcom.2022.164530.
- Shang, Z., Jie Ding, C. Fan, M. Song, Jin Li, Q. Li, S. Xue, K. T. Hartwig, and X. Zhang. 2019. “Tailoring the Strength and Ductility of T91 Steel by Partial Tempering Treatment.” Acta Materialia 169: 209–224. https://doi.org/10.1016/j.actamat.2019.02.043.
- Sims, C. T., N. S. Stoloff, and W. C. Hagel. 1987. Superalloys II. Vol. 8. Wiley New York.
- Şimşek, Barış, Yusuf Tansel İç, and Emir H. Şimşek. 2016. “A RSM-Based Multi-Response Optimization Application for Determining Optimal Mix Proportions of Standard Ready-Mixed Concrete.” Arabian Journal for Science and Engineering 41 (4): 1435–1450. https://doi.org/10.1007/s13369-015-1987-0.
- Singh, Kulvir. 2014. “Advanced Materials for Land Based Gas Turbines.” Transactions of the Indian Institute of Metals 67 (5): 601–615. https://doi.org/10.1007/s12666-014-0398-3.
- Singh, Sukhdeep, and Joel Andersson. 2018. “Hot Cracking in Cast Alloy 718.” Science and Technology of Welding and Joining 23 (7): 568–574. https://doi.org/10.1080/13621718.2018.1429238.
- Su, C. H., and P. W. Voorhees. 1996. “The Dynamics of Precipitate Evolution in Elastically Stressed Solids—II. Particle Alignment.” Acta Materialia 44 (5): 2001–2016. https://doi.org/10.1016/1359-6454(95)00285-5.
- Sun, S., Q. Teng, Y. Xie, T. Liu, and Q. Wei. 2021. “Two-step Heat Treatment for Laser Powder bed Fusion of a Nickel-Based Superalloy with Simultaneously Enhanced Tensile Strength and Ductility.” Additive Manufacturing 46 (1): 102168. https://doi.org/10.1016/j.addma.2021.102168.
- Sundararaman, M., P. Mukhopadhyay, and S. Banerjee. 1988. “Precipitation of the δ-Ni3Nb Phase in two Nickel Base Superalloys.” Metallurgical Transactions A 19: 453–465. https://doi.org/10.1007/BF02649259.
- Takahashi, Akiyuki, Mitsuru Kawanabe, and Nasr M. Ghoniem. 2010. “γ-precipitate Strengthening in Nickel-Based Superalloys.” Philosophical Magazine 90 (27-28): 3767–3786. https://doi.org/10.1080/14786435.2010.497470.
- Tan, Liming, Guowei Wang, Yu Guo, Qihong Fang, Zecheng Liu, Xiangyou Xiao, Wuqiang He, et al. 2020. “Additively Manufactured Oxide Dispersion Strengthened Nickel-Based Superalloy with Superior High Temperature Properties.” Virtual and Physical Prototyping 15 (sup1): 555–569. https://doi.org/10.1080/17452759.2020.1848283.
- Tan, Chaolin, Ji Zou, Di Wang, Wenyou Ma, and Kesong Zhou. 2022. “Duplex Strengthening via SiC Addition and in-Situ Precipitation in Additively Manufactured Composite Materials.” Composites Part B: Engineering 236, https://doi.org/10.1016/j.compositesb.2022.109820.
- Tan, C., J. Zou, D. Wang, W. Ma, and K. Zhou. 2022a. “Duplex Strengthening via SiC Addition and in-Situ Precipitation in Additively Manufactured Composite Materials.” Composites Part B: Engineering 236: 109820. https://doi.org/10.1016/j.compositesb.2022.109820.
- Tang, Y. T., C. Panwisawas, J. N. Ghoussoub, Y. Gong, J. W. Clark, A. A. Németh, D. G. McCartney, and R. C. Reed. 2021. “Alloys-by-design: Application to new Superalloys for Additive Manufacturing.” Acta Materialia 202: 417–436. https://doi.org/10.1016/j.actamat.2020.09.023.
- Tang, Y. T., C. Panwisawas, J. N. Ghoussoub, Y. Gong, and R. C. Reed. 2020. “Alloys-By-Design: Application to New Superalloys for Additive Manufacturing.” Acta Materialia 202: 417–436. https://doi.org/10.1016/j.actamat.2020.09.023.
- Wang, Z., G. Kai, G. Ming, X. Li, X. Chen, and X. Zeng. 2012. “The Microstructure and Mechanical Properties of Deposited-IN718 by Selective Laser Melting.” Journal of Alloys and Compounds 513 (none): 518–523. https://doi.org/10.1016/j.jallcom.2011.10.107.
- Weertman, J. R. 1993. “Hall-Petch Strengthening in Nanocrystalline Metals.” Materials Science and Engineering: A 166 (1-2): 161–167. https://doi.org/10.1016/0921-5093(93)90319-A.
- Wei, D., Q. Han, L. Cai, X. Min, and F. Fang. 2021. “Strengthening Iron Wires Through Gradient Grain Structure.” Materials Characterization 171: 110821. https://doi.org/10.1016/j.matchar.2020.110821.
- Wong, T. W., A. Hadadzadeh, and Mary A Wells. 2018. “High Temperature Deformation Behavior of Extruded AZ31B Magnesium Alloy.” Journal of Materials Processing Technology 251: 360–368. https://doi.org/10.1016/j.jmatprotec.2017.09.006.
- Xu, Jinghao, Hans Gruber, Robert Boyd, Shuang Jiang, Ru Lin Peng, and Johan J Moverare. 2020. “On the Strengthening and Embrittlement Mechanisms of an Additively Manufactured Nickel-Base Superalloy.” Materialia 10: 100657. https://doi.org/10.1016/j.mtla.2020.100657.
- Xu, Jinghao, Paraskevas Kontis, Ru Lin Peng, and Johan Moverare. 2022. “Modelling of Additive Manufacturability of Nickel-Based Superalloys for Laser Powder bed Fusion.” Acta Materialia 240, https://doi.org/10.1016/j.actamat.2022.118307.
- Yang, Shengzhao, Quanquan Han, Yingyue Yin, Jian Gao, Zhenhua Zhang, Yuchen Gu, and Kenny W. Q. Low. 2021. “Effects of Micrometer-Sized TiB2 on Crack Mitigation, Mechanical and Electrochemical Performance of a Ni-Based Alloy Fabricated by Selective Laser Melting.” Optics & Laser Technology 142 (1), https://doi.org/10.1016/j.optlastec.2021.107240.
- Yang, Bo, Z. Shang, Jie Ding, Jack Lopez, William Jarosinski, T. Sun, N. Richter, Y. Zhang, H. Wang, and X. Zhang. 2022. “Investigation of Strengthening Mechanisms in an Additively Manufactured Haynes 230 Alloy.” Acta Materialia 222: 117404. https://doi.org/10.1016/j.actamat.2021.117404.
- Yang, Jinxia, Qi Zheng, Xiaofeng Sun, Hengrong Guan, and Zhuangqi Hu. 2006. “Relative Stability of Carbides and Their Effects on the Properties of K465 Superalloy.” Materials Science and Engineering: A 429 (1-2): 341–347. https://doi.org/10.1016/j.msea.2006.05.091.
- Yoo, Y. S. 2005. “Morphological Instability of Spherical γ′ Precipitates in a Nickel Base Superalloy.” Scripta Materialia 53 (1): 81–85. https://doi.org/10.1016/j.scriptamat.2005.03.022.
- Yu, Hao, Jingjing Liang, Zhongnan Bi, Jinguo Li, and Wei Xu. 2022. “Computational Design of Novel Ni Superalloys with Low Crack Susceptibility for Additive Manufacturing.” Metallurgical and Materials Transactions A 53 (6): 1945–1954. https://doi.org/10.1007/s11661-022-06653-x.
- Yu, Hao, Zhaotian Wang, Baoyun Zhang, Yongquan Ning, and M. W. Fu. 2021. “Re-precipitation Mechanisms of the γ′ Phase with Sphere, Near-Sphere, Cubic, Octets and Finally-Dendrite in as-Cast Ni-Based Superalloys.” Journal of Alloys and Compounds 876: 160104. https://doi.org/10.1016/j.jallcom.2021.160104.
- Zhang, Zhenhua, Quanquan Han, Zhongyi Liu, Jian Gao, Liqiao Wang, Hanlian Liu, Rui Wang, Teng Ma, and Zhengjiang Gao. 2022. “Combined Effects of Heat Treatment and TiB2 Content on the High-Temperature Tensile Performance of TiB2-Modified Ni-Based GH3230 Alloy Processed by Laser Powder bed Fusion.” Materials Science and Engineering: A 861, https://doi.org/10.1016/j.msea.2022.144379.
- Zhang, Zhenhua, Quanquan Han, Zhongyi Liu, Xiaobo Wang, Liqiao Wang, Xusheng Yang, Teng Ma, and Zhengjiang Gao. 2022. “Influence of the TiB2 Content on the Processability, Microstructure and High-Temperature Tensile Performance of a Ni-Based Superalloy by Laser Powder bed Fusion.” Journal of Alloys and Compounds 908: 164656. https://doi.org/10.1016/j.jallcom.2022.164656.
- Zhang, Zhenhua, Quanquan Han, Shengzhao Yang, Yingyue Yin, Jian Gao, and Rossitza Setchi. 2021. “Laser Powder bed Fusion of Advanced Submicrometer TiB2 Reinforced High-Performance Ni-Based Composite.” Materials Science and Engineering: A 817, https://doi.org/10.1016/j.msea.2021.141416.
- Zhang, S., X. Lin, L. Wang, X. Yu, and W. Huang. 2021. “Strengthening Mechanisms in Selective Laser-Melted Inconel718 Superalloy.” Materials Science and Engineering: A, 812: 141145. https://doi.org/10.1016/j.msea.2021.141145.
- Zhao, Xujun, Ravindra Duddu, Stéphane PA Bordas, and Jianmin Qu. 2013. “Effects of Elastic Strain Energy and Interfacial Stress on the Equilibrium Morphology of Misfit Particles in Heterogeneous Solids.” Journal of the Mechanics and Physics of Solids 61 (6): 1433–1445. https://doi.org/10.1016/j.jmps.2013.01.012.
- Zhao, Yanan, Zongqing Ma, Liming Yu, and Yongchang Liu. 2023. “New Alloy Design Approach to Inhibiting hot Cracking in Laser Additive Manufactured Nickel-Based Superalloys.” Acta Materialia 247, https://doi.org/10.1016/j.actamat.2023.118736.
- Zhou, Wenzhe, Yusheng Tian, Qingbiao Tan, Shen Qiao, Hua Luo, Guoliang Zhu, Da Shu, and Baode Sun. 2022. “Effect of Carbon Content on the Microstructure, Tensile Properties and Cracking Susceptibility of IN738 Superalloy Processed by Laser Powder bed Fusion.” Additive Manufacturing 58, https://doi.org/10.1016/j.addma.2022.103016.
- Zhou, W., G. Zhu, R. Wang, C. Yang, and B. Sun. 2020. “Inhibition of Cracking by Grain Boundary Modification in a non-Weldable Nickel-Based Superalloy Processed by Laser Powder bed Fusion.” Materials Science and Engineering: A 791: 139745. https://doi.org/10.1016/j.msea.2020.139745.
- Zhu, Lilong, Xin Yu, Weifu Li, Lina Zhang, Nianxue Zhang, Yanan Lv, Lei Zhao, et al. 2023. “High-throughput Investigation of Nb and Ta Alloying Effects on the Microstructure and Properties of a Novel Ni-Co-Based Superalloy.” Scripta Materialia 226, https://doi.org/10.1016/j.scriptamat.2022.115215.
