
 ?Mathematical formulae have been encoded as MathML and are displayed in this HTML version using MathJax in order to improve their display. Uncheck the box to turn MathJax off. This feature requires Javascript. Click on a formula to zoom.
Abstract
Green synthesis of bimetallic oxide nanocomposite with leaf extract of Eichhornia crassipes (1) is attracted much in recent researchers. The as-synthesized CuO/Ag2O/Ext (2) and CuO/Ag2O NCPs (3) were characterized by UV-Vis, FT-IR, SEM, XRD, and TGA. The disc diffusion method was used to assess the antibacterial potential of (1), (2), and (3) against a total of four human pathogens bacteria. S. aureus and S. epidermides were the growth inhibitory effect in the range of 6.3 ± 0.33 mm, 26 ± 0.58 to 30 ± 0.58 mm, and 23 ± 0.15 to 30 ± 0.58 mm and 6.7 ± 0.33 mm, 22.3 ± 0.88 to 26.3 ± 0.88 mm, and 26 ± 0.58 to 28 ± 0.58 mm for (1), (2), and (3), respectively. Whereas, E. coli and K. pneumonia showed in the range of 7.00 mm, 26.7 ± 0.88 to 29.3 ± 0.33 mm, and 22.7 ± 0.88 to 27.3 ± 0.88 mm and 6.3 ± 0.33 mm, 25 ± 0.88 to 27.3 ± 0.33 mm, and 25.7 ± 0.33 to 27 ± 0.58 mm for (1), (2), and (3), respectively. The XRD technique confirmed the nano-size structure of (2) and (3) (D = 33.41 nm and 28.22 nm, respectively).
1. Introduction
Water hyacinth (Eichhornia crassipes (Mart.)) is a member of the family Pontederiaceae and is a well-known freshwater (e.g. Lake Tana) plant found in all tropical and subtropical regions of the world. It exists as a floating biomass with long, rounded, spongy stems and leaves. It’s ranked as one of the worst invasive weeds globally, this plant, directly and indirectly, affects fish and other aquatic organisms, crop and livestock production, electric power generation, irrigation, waterway transportation, tourism, and human health [Citation1,Citation2]. The overpopulation of this plant has negative effects, such as the hindrance of navigation through rivers and lagoons, the elevation of evaporation rates, and the impediment from the passage of light to the bottom of the ponds, which results in the elimination of microalgae that are the food of crustaceans and fish [Citation3]. Such kind of problems has been happening in our country, Ethiopia. From a physicochemical approach, the water lily is composed mainly of cellulose, hemicellulose, and lignin, which form polysaccharides whose function is to provide structure to the plant [Citation4].
Indeed, E. crassipes contain secondary metabolites such as phenols, sterols, flavonoids, terpenoids, anthraquinones, and phenomenon compounds, these extracts combined with metal nanoparticles showed various biological activities such as antiviral, antifungal, anticancer, and antibacterial activity [Citation5–8]. And also E. crassipes plays a vital role in reducing heavy metals, especially iron produced in water with the help of secondary metabolites [Citation9]. In this context, E. crassipes were used for the bioreduction of metal ions to form nanoparticles. There are three major ways that water hyacinth is controlled mechanical/manual [Citation10,Citation11], chemical [Citation12], and biological control [Citation13,Citation14]. However, the information and its availability are still limited and these have not yielded any meaningful results due to its varied adaptive strategies for survival [Citation15,Citation16]. Currently, nanotechnology has revolutionized several scientific fields in search of alternative means to improve human living conditions such as the health sector, social environment, and environment. A scientist has created nanometer-scale materials with very specific properties for targeted applications. These differences lie in the physical and structural properties of atoms, molecules, and bulk materials of the element due to differences in physiochemical properties and surface-to-volume ratio with advancement in nanotechnology, a large number of nanoparticles are appearing with unique properties, opening a spectrum of applications and research opportunities [Citation17–19]. Additionally, the biological molecules undergo highly controlled assembly for making them suitable for metal nanoparticle synthesis which was found to be reliable and eco-friendly. Therefore, the synthesis of plant-mediated metal nanoparticles is a vast area of research due to its potential applications including catalytic activity, optical properties, electronic properties, antibacterial properties, cell line studies, dye degradation properties, and magnetic properties which were implemented in the development of new technologies [Citation20,Citation21].
Nanoparticles can be synthesized using various approaches including chemical, physical, and biological methods. Bimetallic oxide nanoparticles are prepared by a variety of chemical and physical methods quite expensive and potentially hazardous to the environment and involve the use of toxic chemicals that are responsible for various biological risks [Citation22–24]. However, research attention has been focused on the use of environmentally benign materials like plant extracts, bacteria, and fungi with combined nanoparticles using a green synthesis of metal nanoparticles have received considerable attention because of their advantages over other chemical and physical methods. Since plants are safe to handle, widely available, and possess a variety of phytochemicals that act as reducing/stabilizing agents, simple experimentation, environmentally friendly, reproducibility, and cost-effectiveness of biological means compared to physical and chemical-based methods, thus, there is a boost in demand for green nanotechnology [Citation25–28]. Moreover, the problem of microbial resistance is growing, the development and modification of novel antimicrobial agents (e.g. natural and inorganic-based antimicrobial substances) are necessary and so a more consistent way of protecting or killing microbes (such as bacteria) is becoming a more focused area of this study. The special properties of metal nanoparticles are high chemical stability, low dielectric constant, high catalytic activity, infrared and ultraviolet absorption, and most importantly antimicrobial properties. Antimicrobial activity is one of the most important applications in ongoing biomedical research. Several virulent pathogenic species such as S. epidermidis, E. coli, S. aureus, P. vulgaris, P. aeruginosa, and K. pneumoniae cause numerous human infections. Because the types of pathogens listed above are causing serious illness, it is necessary to establish potential antibiotics to treat bacterial infections. Sometimes, may not be able to kill or inhibit the proliferation of a brand-new antibiotic invented by the pharmaceutical company that showed no effective effect against multidrug-resistant strains. Therefore, there is an urgent need to develop novel and nano-based agents to combat bacterial infections [Citation29,Citation30]. The development of resistance by pathogens to existing antibiotics is one of the major problems in the current therapeutic field. Investigation of novel stimulants with novel mechanisms of action is therefore a major challenge for the pharmaceutical industry and research. And also a combination of medicinal plant-derived biomolecules coated with nanomaterials is considered an important potential source of new antimicrobial agents. Therefore, current development in nanotechnology provided an attractive method for synthesizing different antimicrobial agents [Citation31]. The present study aimed to synthesize and characterize the E. crassipes leaf extract (1) mediated CuO/Ag2O/Ext NCPs (2) and pure CuO/Ag2O NCPs (3) through the hydrothermal process for their antibacterial activity against four pathogens.
2. Materials and methods
2.1. Materials
All of the chemicals used for the synthesis were purchased commercially and have analytical reagent grade and were used directly without further purification. AgNO3 (98%) and CuSO4.5H2O, (98%) (All are products of Loba Chemie Pvt. Ltd, India), C2H5 OH (99.5%), UNI-CHEM Chemical Reagents), Gentamicin, KBr (Uvasol, Germany), NaOH (98%), (All of them are produced by Agrochemicals, India). Whereas, CH3CN (99.9%) and DMF (99%) were from Sigma Aldrich. During the experiment distilled water was used for the preparation of the solution.
2.2. E. crassipes sample collections
This study was conducted at Bahir Dar University, college of natural science, department of chemistry, Ethiopia. The leaves of E. crassipes samples were collected from Lake Tan, Bahir Dar, Ethiopia on March 2022. These collected plant species were guided with the informants and already authenticated by the senior taxonomist at the Department of Botany, Bahir Dar University (voucher number: MB-M29-2022), this was deposited in Ethiopian National Herbarium, Addis Ababa, Ethiopia. Leaf part of E. crassipes washed and cleaned samples was dried at room temperature and then stored in tight polythene bags by labelling leaf samples using sticker paper and keeping them in a cool and dry place (desiccators) until the experiments have completed from March 2022 to November 2022.
2.3. Preparations of aqueous crude leave extract of E. crassipes (1)
The leaf sample of E. crassipes aqueous crude extracts was prepared by using the procedure reported with slight modifications, in this study the crude bioactive ingredients was extracted by using maceration techniques [Citation32,Citation33] as follows: The fresh leaf samples of E. crassipes were first cut and collected by a plastic bag. After that, the samples were more times washed with running tap water to remove dust and other debris. And then the samples were dried to constant weight under shade at room temperature, the obtained 10 g of leaves was ground by using a mortar and pestle and screened through 250 μM sieves to get a uniform texture and stored in tight polythene bags labelled as E. crassipes (1) and keep it in a cool and dry place until use. From sieved samples (1) four different mass such as 0.1 g, 0.3 g, 0.5 g, and 0.7 g were weighted and added into 200 ml of Erlenmeyer flasks. 25 ml of distilled water was poured into each labelled Erlenmeyer flask and then stirred for 30 min using a magnetic stirrer for homogeneity of solution. After then, the conical flasks were tightly closed with aluminium foil, and the mixture solutions were left for 72 hrs using an electronic shaker under room temperature. shows the final extracted solution of E. crassipes (1) filter with bug cotton and/or Handman No-1 filter paper. Finally, the sample was ready for green synthesis of the bimetallic nanocomposite, CuO/Ag2O/Ext (2), and then compared with pure bimetallic nanocomposite, CuO/Ag2O (3) for their antibacterial analysis. Moreover, for UV-Vis characterization, we used the extracted clear solution of (1) at a lower concentration of 0.1 g/ml, but for FTIR characterization used a high concentration of 0.7 g/ml, which means the solid crude powder of sample (1) was obtained by removing the aqueous solvent through the dry freezer and then ready for FTIR analysis. The presence of aqueous crude extracted leaf was calculated by the following equation (Eq 1) and its yield is shown in :
(1)
(1)
Figure 1. Preparation of aqueous crude leaf extract of E. crassipes (1).
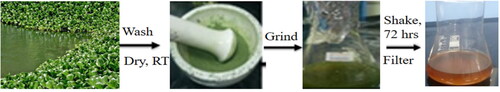
Table 1. The percentage yield of aqueous crude leaf extracts of E. crassipes (1).
2.4. Synthesis of CuO/Ag2O/Ext NCPs (2)
Compound (2) was synthesized using the metal salt and the plant leaf extract of (1). Exactly 0.25 M solutions of CuSO4.5H2O (4.994 g) and AgNO3 (3.397 g) were dissolved in 80 ml distilled water in beakers 1 and 2 under continuous stirring for 30 min using a magnetic stirrer in a hot plate, respectively. The two solutions were mixed and stirred continuously and then 1.0 M of NaOH was added into beakers containing the mixture of solution until its pH become 10.5. 10 mL of aqueous crude leaf extract of (1) was dropwise added to the mixture solution through magnetic stirring at a temperature range of 60–90 °C and stayed for about 24 h. The metal ions might form a complex with the phytoconstituents of the plant extract. The progress of the complexation reaction was observed through the characteristics of colour change (turned from blue colour to dark brown colour). The dark brown precipitate was formed and cooled at room temperature. The dark brown compound (2) solution was ultra-centrifuged at 4000 rpm for 15 min, and the final product (2) was washed with distilled water and then ethanol to remove any impurities. The residual compound (2) was dried in an air oven at 130 °C overnight and calcinated in a muffle furnace at 550 °C for 4 h. The final product was called CuO/Ag2O/Ext NCPs (2), and this was kept until used for further characterization.
2.5. Synthesis of pure CuO/Ag2O NCPs (3)
Pure CuO/Ag2O (3) nanocomposite was prepared by the same procedure using the hydrothermal process that was applied in compound (2), in the absence of E. crassipes (1). The following are proposed mechanisms of compound (3), this might be due to the oxidation process in an alkaline environment, i.e.
(1)
(1)
(2)
(2)
(3)
(3)
(4)
(4)
(5)
(5)
(6)
(6)
(7)
(7)
(8)
(8)
During calcination EquationEq. (8)(8)
(8) could be converted to:
(9)
(9)
Therefore, EquationEqs. (1)–(9) are a sequence of steps for the formation of CuO/Ag2O NCPs.
2.6. Antibacterial activity of the sample (1), compounds (2), and (3)
Antibacterial activity of the aqueous solution of sample (1), compounds (2), and (3) were tested in vitro and analyzed by using disc diffusion techniques illustrated by a slightly modified procedure [Citation32, Citation34]. The serial test concentrations of the sample (1) (0.01 g, 0.03 g, 0.05 g, and 0.07 g) were dissolved in 25 mL of distilled water, and the minimum and maximum test concentrations were determined based on research reports. Whereas for compounds (2) and (3) NPC’s the serial test concentrations (0.01 M, 0.03 M, 0.05 M, and 0.07 M) were prepared by using a 2:3 ratio of a mixture of DMF and CH3CN solvent. The pure culture of bacterial suspension was prepared from 72 hrs and their antibacterial activities were evaluated against a total of four human pathogens bacteria such as two gram-negative E. coli (ATCC 25922) and K. pneumonia (ATCC 43816), and two gram-positive S. aureus (ATCC 29213) and S. epidermides (ATCC 12228), respectively. These were obtained from Amhara Public Health Institute (APHI), Ethiopia. The optical densities of the suspensions were adjusted to 0.132 at 600 nm using a spectrophotometer. The number of bacterial population at this turbidity standard is 1.5 × 10⁸ CFU/ml, approximately 0.5 ml of the bacterial suspension was aseptically inoculated to Mueller Hinton Agar medium and uniformly distributed using a spreader. Several Mueller Hinton agar plates were made and labelled according to the extracted compounds by the name of the bacteria. Standard control (gentamicin) and positive control (methanol for sample (1) and DMF/CH3CN for compounds (2) and (3), respectively. A bacterial suspension was prepared in sterile distilled water regarding the 0.5 McFarland standards. The turbidity of the bacterial suspension was compared with 0.5 McFarland standard solutions, followed by a culture of 100 µl of the bacterial suspension on Mueller Hinton agar plates using a sterile glass rod spreader and allowed to remain in the incubator for 15 min to remove excess moisture. On each plate, equidistant discs were put on them. This is followed by incubation at 37 °C for 48 hrs. The inhibition zone around each disc was recorded in millimetres with a ruler and the assay is carried out in three replications for each extracted sample to obtain consecutive results.
2.7. Statistical data analysis
All presented the numeric values of aqueous crude leave extracts of the sample (1) and compounds (2) and (3), data were through three measurements (mean) ± standard error was tested by One-way ANOVA (Analysis of variance) using the SPSS software for windows version 20, IBM, NY, USA. This was done after carrying out a test of homogeneity and normal distribution of each measured parameter. Mean values were compared with Tukey’s Honestly Significant Difference (HSD) test and all the statistical analyses were computed with SPSS significant difference was determined at 5% (p < 0.05).
2.8. Characterization techniques
This study was conducted at Bahir Dar University, college of natural science, department of chemistry, Ethiopia. The aqueous crude leaf extract of E. crassipes (1) using maceration techniques and compounds (2) and (3) using UV-Vis spectroscopy (DU-8800D spectrophotometer, optical system: Double Beam, Blazed Holographic Grating (1200 lines/mm) China), and FT-IR spectroscopy (FT/IR-6600 FTIR Spectrometer from JASCO, USA), TGA (SCT-1 thermal analyzer under a nitrogen atmosphere), SEM whereas, X-ray diffractometer (BRUKER D8 Advance XRD, Germany) equipped with a Cu target for generating a Cu Kα radiation (wavelength 1.5406 Å) were conducted at Addis Ababa University, Ethiopia. For UV-Vis characterization, the extracted clear solution of a sample (1) was used at a lower concentration of 0.01 g/ml, but for FTIR characterization used at a high concentration of 0.05 g/ml, which means the solid crude powder of each sample was obtained by removing the aqueous solvent through the dry freezer and then ready for FTIR analysis.
3. Results and discussion
3.1. Preliminary reaction test and preparation
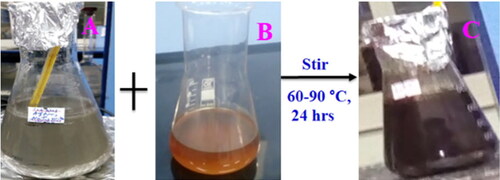
The synergistic effects of plant-mediated transition metal-based nanocomposites are known to possess enhanced antibacterial activities. In this study, the synthesized compounds (2) and (3) NCPs have compared their antibacterial activities with plant extract (1), which were synthesized by hydrothermal method. The final product of compounds (2) and (3) NCPs was confirmed by the colour change of the reaction mixture from blue to dark brown as shown in indicates the formation of bimetallic nanoparticles, due to the reduction of silver ions by active molecules present in the extract (1). And also the colour is attributed to surface plasmon resonance (SPR), which is a size-dependent property of NCPs, this might be the strong absorption of visible light due to the excitation of the nanoparticle surface plasmon’s resonance. Similar results are reported by Zia et al. in 2016 [Citation35].
Figure 2. Visual observation of the solution before and after the reduction of metal ions, where A, B, and C are indicated for (3), (1), and (2), respectively.
3.2. UV-Visible spectra analysis
Ultra Violet-visible absorption spectra of the aqueous leaves extract of E. crassipes (1) and the as-synthesized compounds (2) and (3) NCPs are displayed in . The spectra exhibit maximum absorption peaks observed at 352, 550, and 383 nm for (1), (2), and (3), respectively. The maximum absorption peak shift was observed for sample (2), this might be the synergetic effect of metals and plant extract. The collective oscillation of the free conduction band electrons excited by the incident electromagnetic radiation contributes to the surface plasmon absorption, a maximum surface plasmon absorption band at 550 and 383 nm specifies the formation of compounds (2) and (3) NCPs, respectively. Thus, the coupling and synergetic effect of CuO and Ag2O with plant extract are showing a shift in the optical response of (3) and (2) significantly from UV (383 nm) to the visible range (550 nm) and displaying the significance of the binary compound (2) nanocomposite in visible-light-induced. In (2) and (3) NCPs, the conduction band and valence band lie very close to each other in which electrons move freely. These free electrons give rise to a surface plasmon resonance (SPR) absorption band, occurring due to the collective oscillation of electrons of (2) and (3) NCPs in resonance with the visible light wave. Additionally, the appearance of the peak is due to the size-dependent quantum mechanical phenomenon (SPR). However, the absorption of (2) and (3) NCPs depends on the particle size, solvent, and chemical surroundings, during the experiment there was some solubility problem that why the spectra curve quality was not good. Indeed, the effect of different factors on the particle size distribution, shape, and monodispersed of the nanoparticles should be observed to design a suitable formulation for the production of NPs [Citation36]. Another similar work was reported by Moudgil et al. the aqueous extract of E. crassipes converts Ag+ to Ag0 by the reduction of AgNO3 to form AgNP’s. Their spectroscopic studies were done in a range of 300–800 nm and show a strong absorption at 432 nm and the Surface Plasmon Resonance between 400 and 450 nm confirms the synthesis of smaller AgNPs [Citation37].
Figure 3. UV-Visible spectra of the aqueous crude leaf extract of E. crassipes (1) (0.01 g/25 ml, CuO/Ag2O/Ext NCP’s (2) (0.001 M) and CuO/Ag2O NCP’s (3) (0.001 M), at 25 °C with deionized water (1) and a mixed solvent of DMF/acetonitrile (1:3) of compounds (2) and (3), respectively.
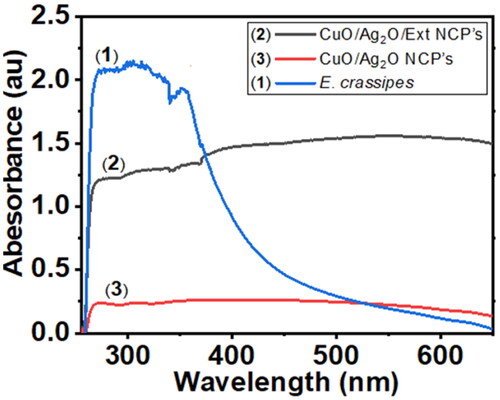
The band gap energy (Eg) of the as-synthesized compounds (2) and (3), were calculated using the equation depicted below [Citation38]:
(10)
(10)
Where Eg is band gap energy in electron volts and λ is the wavelength (nm) corresponding to the absorption edge. The Eg of bimetallic nanocomposites of (2) and (3) were found as 3.28 and 2.17 eV, respectively ().
Table 2. Absorbance, maximum wavelengths, and band gaps of synthesized compounds (2) and (3).
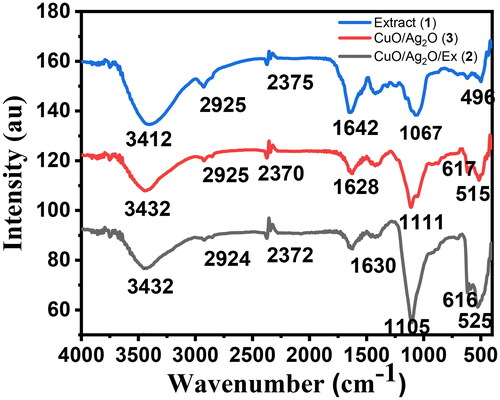
3.3. The FTIR spectra analysis
FTIR measurement shown in is carried out by scanning in the range 400–4000 cm−1 for sample (1), compounds (2), and (3) NCPs, which characteristic peaks ranged from 496 to 3413 cm−1 and were more visible in the synthesized compounds of (2) and (3). These several functional groups were might be sourced from the reducing agent of a sample (1). The FTIR broad bands observed at 3412 and 3432 cm−1 are allocated to the stretching vibrations of the OH bond on the surface of leaf extract (1) and the same values observed for compounds (2) and (3), respectively [Citation39], while the bands at 1642, 1628 and 1630 cm−1 have been endorsed to the O-H bending mode of adsorbed water molecules for (1), (2), and (3), respectively. Additionally, these bands might be indicated the carbonyl C = O broadening bonds. In the same way, the C-H stretching bonds occur in the region of 3300–2925 cm−1 [Citation40]. The vibration at 616 cm−1 can be attributed to the vibrations of Cu-O, confirming the formation of pure Cu-O metal nanoparticles [Citation41]. The band obtained at 1067, 1105, and 1111 cm−1 indicates C-C-N bending for (1), (2), and (3), respectively. Moreover, FTIR spectra have four vibrations occurring at approximately 525 and 616 cm−1 for compound (2), while 515 and 617 cm−1 for compound (3), respectively, which can be attributed to bending and stretching vibrations of Cu-O and Ag-O, endorsing the formation of compounds (2) and (3) NCP’s [Citation42,Citation43].
Figure 4. FTIR spectra of aqueous crude leaf extract of (1) (blue), (2) (black), and (3) (red) NCPs.
3.4. X-ray diffraction analysis
The XRD patterns of synthesized compounds (2) (black) and (3) (red) NCPs are shown in . The diffraction peaks observed in compounds (2) were at scattering angles (2θ) values of 22.42, 28.22, 31.26, 33.82, 35.52, 37.24, 38.78, 44.38, 47.42, 48.84, 53.62, 58.92, and 60.08 degree corresponds to the reflection from (220), (040), (311), (022), (202), (331), (111), (200), (013), (441), (171), (551), and (202). Whereas, the diffraction peaks observed in compound (3) at scattering angles (2θ) values of 22.28, 28.22, 31.22, 32.52, 33.88, 35.50, 37.14, 38.76, 45.82, 47.26, 48.82, 53.54, 54.90, and 58.86 degree corresponds to the reflection from (220), (040), (311), (110), (022), (202), (331), (111), (013), (441), (171), (202), and (551), these indicated the crystal planes for the as-synthesized powders suggesting the formation of Cu-O and Ag-O bonds in compounds (2) and (3) nanocomposites. Indeed, the peaks located at 2θ values of 22.42, 31.26, 32.52, 44.38, and 54.84 degrees correspond to the crystallographic planes (220), (311), (110), (200), and (171) from crystalline silver oxide, Ag2O with planes of face-centred cubic structure (JCPDS files No 76-1393 and 01-076-1393) [Citation44,Citation45]. Whereas, the peaks located at 2θ values of 32.52, 33.88, 35.50, 38.76, 47.26, and 58.86 degrees correspond to the crystallographic planes (110), (022), (202), (111), (013), and (551) from crystalline copper oxide, CuO with planes of monoclinic structure (JCPDS 48-1548). The presence of the leaf extract (1) in a reaction mixture of compound (2) the higher binding between polyphenols of the extract (hydroxyl) to the Cu2+ and Ag+ ions. This contributes the OH− group to Ag+ and Cu2+ resulting in the formation of highly unstable AgOH and Cu(OH)2 (JCPDS 35-0505), which are readily oxidized to CuO and Ag2O upon drying and calcination, this leads to the formation of the CuO/Ag2O/Ex (3) NCP’s [Citation46]. The crystalline size of compounds, (2) and (3) were calculated by the Debye-Scherrer formula (equations 4.1 and 4.2) [Citation47] and based on the highest diffraction peak (assigned to 311 and 202 crystal planes, for Cu-O and Ag-O, respectively). The 2θ value with a maximum intensity of the peak for the compounds was found to be 31.26 and 35.50 which corresponds to the average crystal size D = 33.41 and 28.22 nm for (2) and (3) (). Furthermore, the sharpness of the spectra is an indication of the crystalline nature of the nanocomposites, it can be seen that the diffraction peaks shown in were more intensive, implying a very good crystalline nature of the as-synthesized (2) and (3) nanocomposites (Eq 11).
(11)
(11)
Where D is the average crystallite size, λ is the wavelength of the X-ray = 0.15406 nm for Cu target Kα radiation, β is the peak width of half-maximum (FWHM) of an XRD, and θ is the Bragg diffraction angle. The most intense peak (311) and (202) in the XRD patterns was used to calculate the average crystalline size (D). The calculated D values of (2) and (3) nanocomposites are given in .
Figure 5. The XRD diffractograms of as-synthesized compounds (2) (black) and (3) NCPs.
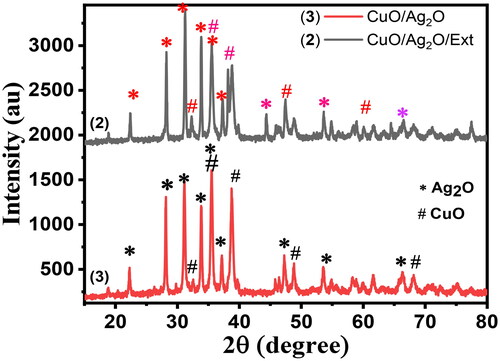
Table 3. The average crystallite size (D) of as-synthesized compounds (2) (black) and (3) NCPs (red).
Table 4. Comparative antimicrobial screening of compound (2) (0.01–0.07 M) and leaf extract (1) (0.01 g/25 ml) against four bacterial strains.
3.5. Structural (SEM) analysis
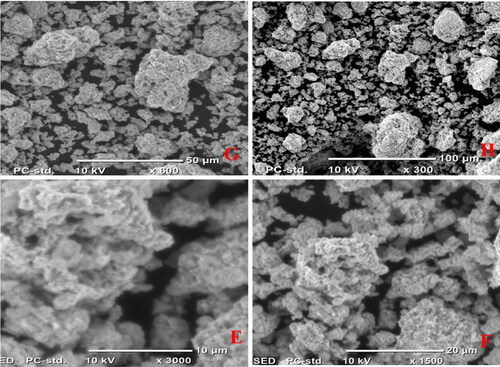
The scanning electron microscope, SEM was utilized to confirm the morphology, composition, and particle size of the as-synthesized compounds (2) and (3) NCPs using the JCM-6000 Plus SEM instrument. The compounds (2) and (3) of average size were 13.38 and 13.56 nm, which corresponds to the nanoparticle size range, this variation in particle size supports XRD analysis in . and show that the SEM image of compounds (2) and (3) where CuO and Ag2O nanocomposite appears clearly and indicated the formation of irregular particles and spherical morphology shape with various size ranges, A-H (10–100) µm and have formed agglomerated particles. Due to the presence of the leaf extract (1) affected the nanocomposites’ morphology, compound (2) shows a slightly uniform and rough spherical shape compared with compound (3), which is irregular, clean surfaces and smooth spherical shape, as well as homogeneously distributed with some particle aggregation, respectively. In contrast to the study of [Citation48], the SEM images showed clustered rod morphology prepared from copper oxide nanoparticles from citrus peel extracts (lemon, tangerine, and orange) using distilled water as a solvent.
Figure 6. SEM image of compound (2) in different size ranges, A-D (10, 20, 50, and 100 µm).
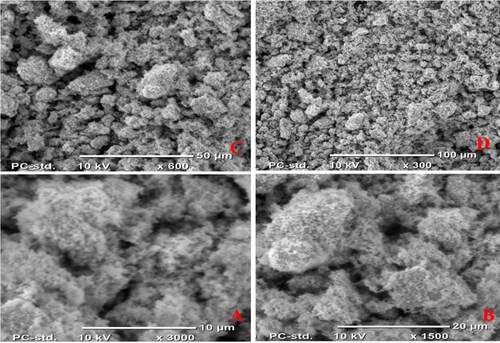
Figure 7. SEM image of compound (3) in different size ranges, E-H (10, 20, 50, and 100 µm).
3.6. TGA analysis
shows the results (A and B) of the thermograms of weight loss percentages of compounds (2) and (3) NCPs, and volatiles (water molecules and organic solvents) were determined by TGA analysis. The maximum and minimum degradation temperatures of compounds (2), and (3) were 186, 563 °C and 165, 463 °C, respectively. The 1.03% and 3.73% of total weight loss at the start of the TGA curves to the end are due to evaporation and dehydration of adsorbed and surface water from the compounds, (2) and (3), respectively. This indicated the phase transformation of NCPs, that is:
Figure 8. TGA thermograms of the as-synthesized compounds (2) and (3) NCPs.
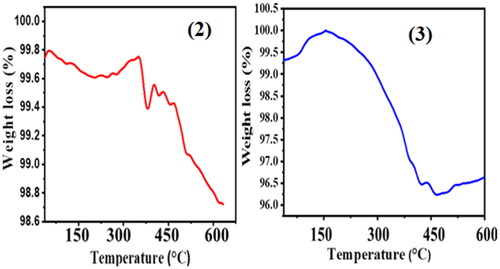
These thermograms (2) and (3) show two and one weight-loss event, respectively; the first event is located in a temperature range of ∼30 to 200 °C and is attributed to water evaporation. Whereas, the second loss is between temperatures of ∼200 and 494 °C; the temperature where significant weight loss of leaf extract of E. crassipes in compound (2) is most apparent is known as maximum degradation temperature and in the case of (1) was 440 °C. Additionally, the third and final stage of material loss is between 600 °C and 620 °C and is assigned to the degradation of organic material occurring from the green synthesized of (2) due to the entrance of an oxygen source. The formation and thermal degradation of this type have been reported in previous work [Citation49]. In general, the lowest percentage of total weight loss is shown in compounds, (2) and (3), which might be the higher coordination ability of the as-synthesized nanocomposites. Therefore, using plant leaf extract (1) for synthesizing compound (2) NCPs could be a good alternative to reduce the costs of the synthetic method since the price of E. crassipes is less (almost zero) compared with purchased the synthetic ligands, as well as the optimization of the synthesis using it could be of academic and industrial interest.
3.7. Antibacterial activity
The aqueous crude leaf extract (1), compounds (2), and (3) NCPs were shown the presence of antimicrobial activities against two gram-negative E. coli and K. pneumonia and the two-gram positive S. aureus and S. epidermides by using the disc diffusion method.
The aqueous crude leaf extract (1) and compound (2) NCPs show a maximum and minimum inhibition zone recorded after an incubation period of 72 hrs at 37 °C. and show sample (1) from four selected pathogenic bacteria in different concentration ranges (0.01–0.07 g/25 ml); at 0.01 g/25 ml of the highest and the lowest zone of inhibition were E. coli (7.00 ± 0.00 mm) and both in K. pneumonia and S. aureus (6.33 ± 0.33 mm), respectively. However, the rest three different concentrations (0.03, 0.05, and 0.07 g/25 ml) observed nearly the same results as 0.01 g/25 ml against four bacterial strains, this indicates concentration change was not significant changes. Whereas and show that compound (2) from four selected pathogenic bacteria in different concentration ranges (0.01–0.07 M); at 0.01 M of the highest and the lowest zone of inhibition were E. coli (29 ± 0.58 mm) and S. epidermides (22.33 ± 0.88 mm), respectively; at 0.03 M of the highest and the lowest zone of inhibition were E. coli (29.33 ± 0.33 mm) and S. aureus (26 ± 0.58 mm), respectively; at 0.05 M of the highest and the lowest zone of inhibition were S. aureus (30 ± 0.58 mm) and S. epidermides (25.67 ± 0.88 mm), respectively; at 0.07 M of the highest and the lowest zone of inhibition were E. coli (29 ± 0.58 mm) and S. epidermides (24.67 ± 0.88 mm), respectively. Here we conclude that almost in all concentration ranges relatively the E. coli have the highest zone of inhibition, whereas the lowest zone of inhibition recorded in S. epidermides, respectively, whereas K. pneumonia and S. aureus have a moderate zone of inhibition recorded, this indicates compound (2) NCP’s has shown promising antibacterial activity for gram-negative and positive bacteria, respectively.
Figure 9. Antibacterial activities of leaf extract (1) against A) E. coli, B) K. pneumonia, C) S. aureus, D) S. epidermides in different concentration ranges (0.01–0.07 g/25 ml) G), standard Gentamicin in the centre.
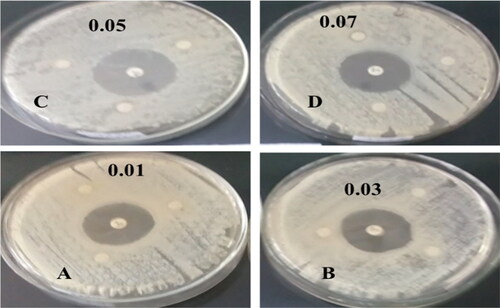
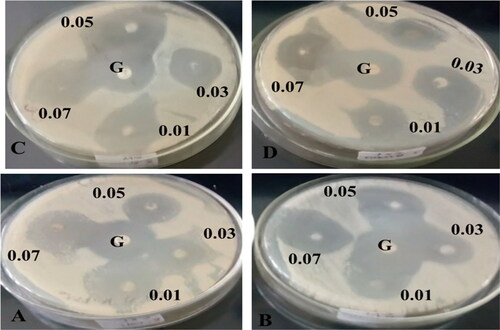
Figure 10. Antibacterial activities of compound (2) against A) E. coli, B) K. pneumonia, C) S. aureus, D) S. epidermides, and G) standard Gentamicin. The paper disks were impregnated with four different concentration ranges of (2) NCPs (0.01–0.07 g/25 ml) using a mixture of DMF/acetonitrile (1:1) solvents.
and shows compound (3) NCPs from four selected pathogenic bacteria in different concentration ranges (0.01–0.07 M); at 0.01 M of the highest and the lowest zone of inhibition were S. epidermides (26.00 ± 0.58 mm) and E. coli (22.67 ± 0.88 mm), respectively; at 0.03 M of the highest and the lowest zone of inhibition were E. coli (27.33 ± 0.88 mm) and S. aureus (25.67 ± 0.88 mm), respectively; at 0.05 M of the highest and the lowest zone of inhibition were S. aureus (30.00 ± 0.58 mm) and E. coli (23.00 ± 1.15 mm), respectively; at 0.07 M of the highest and the lowest zone of inhibition were S. aureus (27.33 ± 0.88 mm) and E. coli (26.00 ± 0.58 mm) respectively. Therefore, here we can see that relatively in all concentration ranges the highest and the lowest zone of inhibition was observed in compound (2) as compared to compound (3), this might be the synergetic effect of NCPs and the plant extract (1) ().
Figure 11. Antibacterial activities of compound (3) against A) E. coli, B) K. pneumonia, C) S. aureus, D) S. epidermides, and standard Gentamicin in the centre. The paper disks were impregnated with four different concentration ranges of (3) NCPs (0.01–0.07 g/25 ml) using a mixture of DMF/acetonitrile (1:1) solvents.
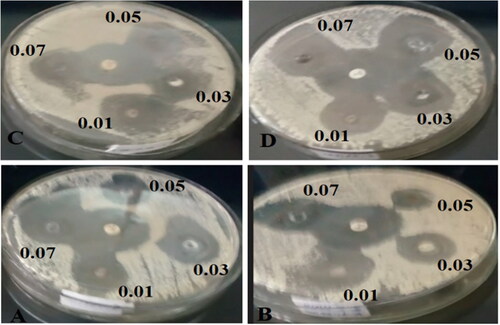
Figure 12. A bar graph shows the inhibition zone versus concentration of antibacterial activities of A) compound (2) (including leaf extract (1) (0.1–0.7 g/25 ml)) and B) compound (3) NCP’s against E. coli, K. pneumonia, S. aureus, S. epidermides, and the standard Gentamicin, respectively, in different concentration ranges (0.1–0.7 M).
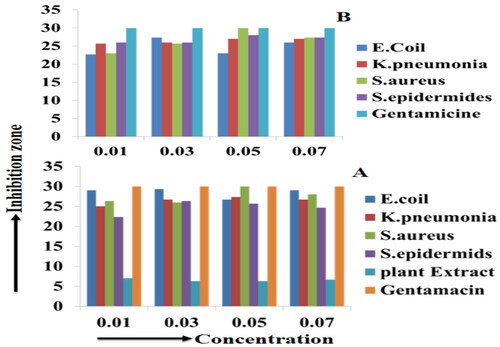
Table 5. Antimicrobial screening of compound (3) NCPs (0.01–0.07 M) against four bacterial strains.
Generally, from recently reported articles, it is observed that CuO and Ag2O-based nanomaterials have been prepared for different applications using different approaches. Jin et al. reported the non-enzymatic glucose sensor, which was fabricated by growing CuO-Ag2O nanoparticles on an AgCuZn alloy substrate [Citation50]. Jin et al. have prepared the CuO-Ag2O nanowires directly on the surface of an AgCuZn alloy by a facile method using the hierarchical composition of the two oxides. The as-synthesized nanowires were employed to enhance catalytic formaldehyde oxidation on CuO-Ag2O nanowires for gas sensing and hydrogen evolution [Citation23]. Maeda et al. describe the metal-metal bonding process using mixture metal bonding process using a mixture of CuO nanoparticles and Ag2O nanoparticles and correlate its effect on mechanical properties [Citation51]. Maniecki et al. developed the bimetallic systems Au-Cu and Ag-Cu/CrAl3O6 as catalysts for methanol synthesis [Citation52]. Nemadea and Waghuleyb reported CuO-Ag2O bimetallic oxide nanoparticles synthesized by using microwave-assisted and solid-state diffusion routes at different temperatures for liquefied petroleum gas sensing. The XRD pattern of CuO-Ag2O bimetallic oxide nanoparticles shows broad peaks indicating the nanometric dimensions of the synthesized materials. The symbolic representation of diffraction peaks for CuO and Ag2O is exactly indexed to JCPDS file No. 89–5897 and 75–1532, respectively. It is also well recognized that CuO and Ag2O alloy possesses easy phase separation, due to the radius inequality between Cu and Ag within the alloy nanoparticles [Citation53]. The overlapped diffraction peak appears around 41°, which might be showing some indication of alloy formation. Moreover, weight loss up to 375 K may assign to the removal of constituent water molecules. The TGA curves for both microwave-assisted and solid-state diffusion route shows small weight loss in the region 373–450 K. This thermal stability is again witnessed around 600–650 K. The above results of the XRD values were nicely correlated in our compounds (2) and (3) under the overlapped diffraction peak appears was around 38°. And also, the average crystal sizes were found to be 33.41 and 28.22 nm for (2) and (3), which is slightly larger than them. The pH of the reaction mixture is vital since it not only controls the size but also provides stability to the as-synthesized nanocomposite. The variation in the average crystal size of the compounds (2) and (3) around 12 nm difference as compared to Nemadea and Waghuleyb’s reported value might be an effect of the pH values. Regarding the SEM results as we reported that compound (2) was slightly uniform and rough spherical shaped whereas, compound (3) is irregular, clean surfaces and smooth spherical shaped, as well as homogeneously distributed with some particle aggregation, respectively. Additionally, this variation in particle sizes might be different synthesis methods and temperature effects, as particle size decreases, the surface-to-volume ratio increases drastically [Citation54].
4. Conclusion
In summary, we successfully synthesized CuO-Ag2O bimetallic oxide nanocomposites using aqueous crude leaf extract of E. crassipes by using the hydrothermal method. The result shows that E. crassipes due to several natural and bioactive compounds are capable to reduce copper and silver ions and convert them into NCP and stabilizing the fabricated compounds (2) and (3) could be effectively utilized in green synthesis. The structural conformation using XRD analysis pointed out the formation of compound (2) and (3) NCPs. In this comparative study compound (2) shows better antibacterial performance than compound (3) against a total of four human pathogens bacteria such as E. coli, K. pneumonia, S. aureus, and S. epidermides using the disc diffusion method. The structural, morphological, optical, and thermal study of as-synthesized materials was done through X-ray diffractometer (XRD), scanning electron microscope (SEM), Fourier transform infrared (FTIR), Ultraviolet-Visible (UV-Vis) and Thermogravimetric analysis (TGA), respectively. The low-cost, easily scalable preparation presented and insights into enhancing the antibacterial activity will be very useful for pharmaceutical industrial development.
| Abbreviations | ||
| ABS | = | acetate buffer solution |
| ANOVA | = | analysis of variance |
| CFU/ml | = | colony forming unit per millilitre |
| CuO/Ag2O/NCP’s (3) | = | pure CuO/Ag2O nanocomposite |
| CuO/Ag2O/Ext NCPs (2) | = | water hyacinth mediated CuO/Ag2O nanocomposite |
| DMF | = | dimethylformamide |
| E. coli | = | Escherichia coli |
| E. crassipes(1) | = | Eichhornia crassipes leaf extract |
| FTIR | = | Fourier transform infrared radiation |
| JCPDS | = | the joint committee on powder diffraction standards |
| K. pneumonia | = | Kleibsiella pneumonia |
| LPG | = | liquefied petroleum gas |
| NCPs | = | nanocomposites |
| S. aureus | = | Staphylococcus aurous |
| SEM | = | scanning electron microscopy |
| S. epidermides | = | Streptococci epidermides |
| TGA | = | thermogravimetric analysis |
| UV-Vis | = | ultraviolet-visible spectroscopy |
| XRD | = | X-ray diffraction |
Acknowledgements
The authors would like to show sincere thanks to those techniques who have contributed to this research, especially thanks to this work supported and grant-funded by the Minister of Education and Bahir Dar University (BDU), Ethiopia.
Disclosure statement
No potential conflict of interest was reported by the authors.
Data availability statement
The figures and tables used to support the findings of this study are included in the article.
Additional information
Notes on contributors
Alebel Nibret Belay
Dr. Alebel Nibret Belay is currently an Assistant Professor in the College of Science, Department of Chemistry, Bahir Dar University, Ethiopia. In 2010 and 2012, he received his BSc and MSc (Applied Chemistry and Physical Chemistry) from Mada walabu and Haramaya University, Ethiopia respectively. In 2018 he received his Ph.D (Chemistry; Crystallography) from the University of the Free State, South Africa and he has teaching and research experience more than 12 years in the areas of Chemistry, Material science and Crystallography.
Mulat Esmelalem Mihretu
Mr. Mulat Esmelalem Mihretu is currently an MSc Student in the College of Science, department of Chemistry, Bahir Dar University, Ethiopia. In 2015 he received his BSc (Applied Chemistry) from Debremarkos University, Ethiopia. He has teaching experience more than 5 years in the areas of Chemistry.
Tsegaye Gashaw Getnet
Dr. Tsegaye Gashaw Getnet is currently an Assistant Professor in the College of Science, department of Chemistry, Bahir Dar University, Ethiopia. In 2011 and 2013, he received his BSc and MSc (Applied chemistry and Organic Chemistry) from Haramaya University, Ethiopia. In 2021 he received his Ph.D (Chemistry; material science and technology) from the University of Sao Paulo, Brazil and he has more than 11 years teaching and research experiences in the areas of Chemistry, Material science and technology.
References
- Reza A, Khan JM. Water hyacinth as cattle feed. Indian. J Anim Sci. 1981;51(11):1–19.
- Coles GC, Kabatereine NB. Water hyacinth and the transmission of schistosomiasis. Trans R Soc Trop Med Hyg. 2008;102(6):619–620.
- Gakwavu R. Zinc and chromium removal mechanisms from industrial wastewater by using water hyacinth, Eichhornia crassipes (mart.) Solms. Appl Ecol Env Res. 2012;10(4):493–502.
- Young-Hyun L. Cellulose structure modification and hydrolysis. 1st ed., New York (NY): Wiley; 1986. p.1–18.
- Hemalatha S, Makeswari M. Green synthesis, characterization and antibacterial studies of CuO nanoparticles from Eichhornia crassipes. Rasayan J Chem. 2017;10(3):838–843.
- Vanathi P, Rajiv P, Narendhran S, et al. Biosynthesis and characterization of phyto mediated zinc oxide nanoparticles: a green chemistry approach. Mater Lett. 2014;134:13–15.
- Ali H, Patel M, Ganesh N, et al. The world’s worst aquatic plant as a safe cancer medicine-Antitumor activity on melanoma induced mouse by Eichhornia crassipes: in vivo studies. J Pharm Res. 2009;2:1365–1366.
- Jayanthi P, Lalitha P. Determination of the in vitro reducing power of the aqueous extract of Eichhornia crassipes (Mart.) Solms. J Pharm Res. 2011;4:4003–4005.
- Brown JC. Agricultural use of synthetic metal chelate. Soil Sci. Soc. Am. Jo. 1969;33(1):59–61.
- Mathur P, Mathur SM. Water hyacinth: a useful plant to improve the rural economy. Water Sci Technol. 2017;80:31–38.
- Cerveira-Junior WR, Carvalho LB. Control of water hyacinth: a short review. Commun Plant Sci. 2019;9(1):129–132.
- Shahawy TAEG. Chemicals with a natural reference for controlling water hyacinth, Eichhornia crassipes (Mart.) Solms. J Plant Prot Res. 2015;55(3):294–300.
- Admas A, Sahle S, Belete E, et al. Controlling water hyacinth in Lake Tana using a biological method at greenhouse and pond level. Eur J Exp Bio. 2017;7(5):29.
- Tipping PW, Gettys LA, Minteer CR, et al. Herbivory by biological control agents improves herbicidal control of water hyacinth (Eichhornia crassipes). Invasive Plant Sci Manag. 2017;10(3):271–276.
- Bindu T, Ramasamy EV. High solids anaerobic digestion for the recovery of energy and manure from Taro (Colocasia esculenta). J Solid Waste Technol Manag. 2005;31(2):69–77.
- Nagassa D, Belay A. Current status of water hyacinth (Eichhornia crassipes) in Ethiopia: achievements, challenges and prospects: a review. J Environ Earth Sci. 2020;10(10):36–47.
- Hochella MF. Nanoscience and technology: the next revolution in the earth sciences. Earth Planet Sci. Lett. 2002;203(2):593–605.
- Beumer K. Broadening nanotechnology’s impact on development. Nat Nanotechnol. 2016;11(5):398–400.
- Srikar SK, Giri DD, Pal DB, et al. Green synthesis of silver nanoparticles. GSC. 2016;06(01):34–56.
- Bar H, Sahoo G, Sarkar P, et al. Green synthesis of silver nanoparticles using latex of Jatropha curcas. Colloid Surface. 2009;339(1-3):134–139.
- Chandran SP, Chaudhary M, Pasricha R, et al. Synthesis of gold nanotriangles and silver nanoparticles using aloe vera plant extract. Biotechnol Prog. 2006;22(2):577–583.
- Nemade KR, Waghuley SA. LPG sensing performance of CuO/Ag2O bimetallic oxide nanoparticles. St Petersburg Polytechn Univ J Phys. Math. 2015;1(3):249–255.
- Zhaoyu J, Panpan L, Guangyue L. Enhancing catalytic formaldehyde oxidation on CuO-Ag2O nanowires for gas sensing and hydrogen evolution. J Mater Chem A. 2013;1:14736–14743.
- Rahman MM, Alam MM, Hussain MM, et al. Hydrothermally prepared Ag2O/CuO nanomaterial for an efficient chemical sensor development for environmental remediation. Environ Nanotechnol Monit Manag. 2018;10:1–9.
- Kalaiarasi R, Jayallakshmi, N, Venkatachalam. Phytosynthesis of nanoparticles and its applications – a review. Plant Cell Biotechnol Mol Biol. 2010;11:1–16.
- Iravani S, Korbekandi H, Mirmohammadi SV, et al. Mechanism and applications of metal nanoparticles prepared by biomediated process. Rev Adv Sci Engng. 2014;3(3):261–274.
- Prakash P, Gnanaprakasam P, Emmanuel R, et al. Green synthesis of silver nanoparticles from leaf extract of Mimusops elengi, Linn for enhanced antibacterial activity against multi-drug resistant clinical isolates. Colloids Surf B Biointerfaces. 2013;108:255–259.
- Fadam MA, Hasan MH, Sarhan AS, et al. Exploiting of green synthesized silver nanoparticles using Capparis spinosa L fruit for spectrophotometric determination of diphenhydramine HCl in pure forms and commercial products. J Exp Nanosci. 2023;18(1):2161525.
- Mahendran D, Kavi Kishor PB, Geetha N, et al. Efficient antibacterial/biofilm, the anti-cancer and photocatalytic potential of titanium dioxide nanocatalysts green synthesized using Gloriosa superba rhizome extract. J Exp Nanosci. 2021;16(1):11–30.
- Jinu U, Gomathi M, Saiqa I, et al. Green-engineered biomolecule-capped silver and copper nanohybrids using Prosopis cineraria leaf extract: enhanced antibacterial activity against microbial pathogens of public health relevance and cytotoxicity on human breast cancer cells (MCF-7). Microb Pathog. 2017;105:86–95.
- Lalitha P, Sripathi S, Jayanthi P. Secondary metabolites of Eichhornia crassipes (Water hyacinth): a review (1949 to 2011). Nat Prod Commun. 2012;7(9):1249–1256.
- Abate TA, Belay AN. Assessment of antibacterial and antioxidant activity of aqueous crude flower, leaf, and bark extracts of Ethiopian Hibiscus rosa-sinensis Linn: geographical effects and Co2Res2/glassy carbon electrode. Int J Food Prop. 2022;25(1):1875–1889.
- Keerthika T, Manikandan K, Elangovan N, et al. Enhanced larvicidal, antibacterial, and photocatalytic efficacy of TiO2 nanohybrids green synthesized using the aqueous leaf extract of Parthenium hysterophorus. Environ Sci Pollut Res. 2018;25(11):10328–10339.
- Taye B, Giday M, Animut A, et al. Antibacterial activities of selected medicinal plants in traditional treatment of human wounds in Ethiopia. Asian Pac J Trop Biomed. 2011;1(5):370–375.
- Zia F, Ghafoor N, Iqbal M, et al. Green synthesis and characterization of silver nanoparticles using Cydonia oblong seed extract. Appl Nanosci. 2016;6(7):1023–1029.
- Aziz WJ, Jassim HA. Green chemistry for the preparation of silver nanoparticles using mint leaf leaves extracts and evaluation of their antimicrobial potential. WNOFNS. 2018;18(2):163–170.
- Aliesha M, Animesh SD, Mahesh SD, et al. Eichhornia crassipes mediated bioinspired synthesis of crystalline nano silver as an integrated medicinal material: a waste to value approach. J Cluster Sci. 2021;32:391–404.
- El-Kemary M, El-Shamy H, El-Mehasseb I. Photocatalytic degradation of ciprofloxacin drug in water using ZnO nanoparticles. J Lumen. 2010;130(12):2327–2331.
- Bouafia A, Laouini SE. Green synthesis of iron oxide nanoparticles by aqueous leaves extract of Mentha pulegium L.: effect of ferric chloride concentration on the type of product. Mater Lett. 2020;265:127364.
- Xu YY, Bian C, Chen S, et al. A microelectronic technology-based amperometric immunosensor for α-fetoprotein using mixed self-assembled monolayers and gold nanoparticles. Anal Chim Acta. 2006;561(1-2):48–54.
- Nogueira AE, Giroto AS, Neto ABS, et al. CuO is synthesized by solvothermal methods as a high-capacity adsorbent for hexavalent chromium. Colloids Surf A Phys Eng Asp. 2016;498:162–167.
- Wankhede YB, Kondawar SB, Thakare SR, et al. Synthesis and characterization of silver nanoparticles embedded in polyaniline nanocomposite. Adv Mater Lett. 2013;4(1):89–93.
- Kumar H, Manisha K. Synthesis and characterization of silver-oxide nanoparticles by sol-gel method. Int J Adv Res Sci Eng. 2018;7(3):632–637.
- Taufik A, Saleh R. The influence of graphene on silver oxide synthesis through the microwave-assisted method. AIP Conf Proc. 2018;2023:0200181–0200184.
- Rajabi A, Ghazali MJ, Mahmoudi E, et al. Development and antibacterial application of nanocomposites: effects of molar ratio on Ag2O-CuO nanocomposite synthesized via the microwave-assisted route. Ceram Int. 2018;44(17):21591–21598.
- Ravichandran S, Paluri V, Kumar G, et al. A novel approach for the biosynthesis of silver oxide nanoparticles using aqueous leaf extract of Callistemon lanceolatus (Myrtaceae) and their therapeutic potential. J Exp Nanosci. 2016;11(6):445–458.
- Holzwarth U, Gibson N. The Scherrer equation versus the Debye-Scherrer equation. Nat Nanotechnol. 2011;6(9):534.
- Tshireletso P, Ateba CN, Fayemi OE. Spectroscopic and antibacterial properties of CuONPs from orange, lemon, and tangerine peel extracts: potential for combating bacterial resistance. Molecules. 2021;26(3):586.
- Rodriguez-Mirasol J, Cordero T, Radovic LR, et al. Structural and textural properties of pyrolytic carbon formed within a microporous zeolite template. Chem Mater. 1998;10(2):550–558.
- Jin Z, Li P, Zheng B, et al. CuO-Ag2O nanoparticles grown on an AgCuZn alloy substrate in situ for use as a highly sensitive nonenzymatic glucose sensor. Anal Methods. 2014;6(7):2215–2220.
- Kobayashi Y, Shirochi T, Yasuda Y, et al. Synthesis of silver/copper nanoparticles and their metal-metal bonding property. J Min Metall B Metall. 2013;49(1):65–70.
- Maniecki TP, Mierczynski P, Maniukiewicz W, et al. Bimetallic Au-Cu, Ag-Cu/CrAl3O6 catalysts for methanol synthesis. Catal Lett. 2009;130(3-4):481–488.
- Yun J, Cho K, Park B, et al. Optical heating of inkjet printable Ag and Ag-Cu nanoparticles. Jpn J Appl Phys. 2008;47(6):5070–5075.
- Barsan N, Weimar U. Conduction model of metal oxide gas sensors. J Electroceram. 2001;7(3):143–167.