
ABSTRACT
Recently the cultivation of opium poppy in Afghanistan reached unprecedented levels. It is agreed that the complex and coupled interactions of social, economic and environmental drivers are crucial for understanding the spatial and temporal dynamics of opium poppy cultivation in Afghanistan. In this context, we present an integrated risk concept, which considers environmental and socio-economic drivers of opium poppy cultivation. A set of spatially explicit indicators for the environmental suitability and socio-economic vulnerability was established and populated from a variety of databases. Subsequently, novel methods of modelling homogeneous and spatially explicit regions of opium poppy cultivation suitability, socio-economic vulnerability and risk are developed and applied. The risk assessment results demonstrate the complex nature of the illicit crops production in Afghanistan and prompt a more profound examination of the drivers of opium poppy cultivation in a spatial context. The study also confirms what has already been widely discussed in literature: that reasons for cultivation are spatially diverse and often distinct, meaning that any formulation of generalized explanations cannot be drawn without ignoring a more complex reality. Thus, an integrative spatial view of risk, which integrates the social dimension as well as environmental parameters, is required to better identify context-specific intervention measures.
1. Introduction
Opium poppy cultivation in Afghanistan attained highest recorded levels in 2014 with an estimated cultivated area of 2240 km² (UNODC Citation2014). According to UNODC (Citation2014), the size of the cultivated land has tripled compared to 2002, the year after the fall of the Taliban in late 2001. The extent of opium poppy cultivation in Afghanistan has been monitored by the United Nations since 1994, and since 2005 in collaboration with the Afghan government. The Afghan government and the United Nations Office on Drugs and Crime (UNODC) use remote sensing technology and a yearly questionnaire-based survey among 1500 farmers to assess the extent of cultivation and to determine risks and trends in cultivation patterns.
The Government of Afghanistan together with the international community have confronted the problem by eradicating opium poppy fields and by introducing alternative livelihood projects that provide positive incentives for abstaining from opium cultivation. However, these efforts have not yet fully achieved the expected results. Factors related to the lack of success have been discussed in literature, for example, on eradication, on alternative livelihood programmes (Mansfield and Fishstein Citation2013; Parenti Citation2015), as well as the complexity and interconnectedness when interpreting changing levels of opium cultivation (Mansfield and Fishstein Citation2016).
It is agreed that the complex and coupled interactions of social, economic and environmental drivers are crucial for understanding the spatial and temporal dynamics of opium poppy cultivation in Afghanistan (Mansfield Citation2005; Parenti Citation2015). Any intervention aimed at reducing illicit cultivation of opium poppy must therefore not only address the final outcome – the cultivation of opium poppy by local farmers – but also has to respond to the underlying drivers and causes which lead the local populations to start growing opium poppy in the first place. Mansfield and Pain (Citation2007) summarized this issue by referring to opium poppy as ‘a low-risk crop in a high-risk environment’.
While monitoring capacities are well established to observe and identify spatial and temporal trends of opium poppy cultivation (UNODC Citation2014), approaches are sought which are capable of representing the underlying complexity and multi-dimensionality of drivers in an integrated way. Next to an integrated representation, approaches are required that enable decision-makers to identify place- and context-specific intervention strategies to address the root causes of opium poppy cultivation.
This paper aims to respond to these challenges in the following way: Firstly, an integrated risk concept is established, which considers environmental and socio-economic drivers of the risk of opium poppy cultivation. The framework aims to be integrative and builds on the understanding of risk, currently applied in interdisciplinary framings of disaster risk and climate change adaptation (see Section 2.3). Based on findings, available literature and expert consultations, the framework is subsequently populated with a number of key indicators, reflecting the drivers and factors of opium poppy cultivation. Indicators are represented and quantified through data available from the ‘Afghanistan Opium Poppy Surveys’ (AOPS) as well as publicly available ancillary datasets (Section 2.4). Subsequently, novel methods of modelling homogeneous and spatially explicit regions of environmental suitability, socio-economic vulnerability and risk are developed and applied (Section 2.5). The resulting assessment, being independent from administrative units, aims to show spatially explicit geographies of suitability, vulnerability and risk. The underlying characteristics of the delineated regions are thereby represented through the respective contribution of the different factors. This allows the results to be evaluated and discussed, which is presented in Section 3. Emphasis is given on visualization and cartography of the results. Section 4 summarizes key conclusions and identifies future research directions.
2. Materials and methods
2.1. Study area
The Islamic Republic of Afghanistan is a landlocked country located within South Asia and Central Asia with a current population of about 32 million. Its neighbouring countries are Pakistan in the south and east; Iran in the west; Turkmenistan, Uzbekistan and Tajikistan in the north and China in the far northeast. Its territory covers 652,000 km2.
Afghanistan is a traditional producer of opium poppy. Opium poppy cultivation has been monitored systematically since 1994, where an estimated 71,000 hectares were cultivated (UNODC Citation2015). Since 2002, the year after the fall of the Taliban regime, opium poppy cultivation has tripled and reached a peak in 2014 with 224,000 hectares. Overall the area under poppy cultivation is relatively marginal compared to the percentage of total agricultural land (at roughly 3%). High-risk areas exist where opium poppy plays an important role in rural economies. In 2014, it was estimated that in Helmand province opium poppy accounted for approximately 30% of total agricultural land 8 (UNODC Citation2015).
Opium poppy cultivation is a widespread phenomenon, but highly unevenly distributed. Out of the 34 Afghan provinces, 15 have been considered to be poppy free in 2014, and in 13 provinces less than 1000 hectares were cultivated. Ninety-seven per cent of area under cultivation is concentrated in nine provinces of Afghanistan, mainly located in the South and West of the country (UNODC Citation2015). Within a province, cultivation can vary considerably, with districts free of poppy next to high levels of cultivation. Understanding these patterns better is invaluable for designing counter narcotics strategies.
2.2. From concept to analytics – an integrated workflow to map risk and vulnerability
The methodology of the risk assessment follows a four-point procedure recently published by Kienberger and Hagenlocher (Citation2014), which builds on the concept of integrated geons (Lang et al. Citation2014). The aim of the methodology was to identify homogenous regions – independent of administrative units – of environmental suitability of, socio-economic vulnerability to and ultimately risk of opium poppy cultivation in Afghanistan.
The initial stage of the method is concerned with (1) the definition of the conceptual risk framework, which comprises the definition of the risk concept and identifying relevant contributing factors to the socio-economic vulnerability and environmental suitability domains. An in-depth desk study of thematically relevant and recent literature is central at this point, as are expert consultations with international experts, as well as local experts from Afghanistan, which took place on several occasions at the UNODC headquarter in Vienna (Austria). As the deductive approach applied within this assessment integrates knowledge from domain experts, whether direct through consultations or indirect through secondary sources, the indicator development is seen as a maturing process, requiring continuous adjustment and adaptation. This is due to limitations such as the credibility, saliency and legitimacy of the initial indicator set and also particularly due to data availability and related limitations (see Section 2.3 for the definition of the framework).
The second step (2) involves finding agreement for the finalization of the indicator set (see Section 2.3) which can subsequently be used for modelling. The original indicator values are normalized through a linear min–max function between a possible value range of 0 and 100 to allow comparison and aggregation. Furthermore, this stage comprises the test for multicollinearities to ensure the indicators are independent and avoid double counting. Multicollinearities in the data were assessed using the Pearson correlation coefficient r (with r > 0.9), following guidelines described by OECD (Citation2008) (results are provided in as supplementary files). The individual indicators were weighted by six experts (remote sensing, statistics and socioeconomics; all involved in studying Afghan opium poppy cultivation) using the Analytical Hierarchy Process (AHP). AHP is a participatory approach to multi-criteria decision-making developed by Saaty (Citation1980) in which the relative contribution of indicators is derived from pairwise comparisons. Thus, factors and indicators that are considered to be more or/less important than others are attributed with higher or lower weightings.
The third step (3) constitutes the modelling of the three components: socio-economic vulnerability, environmental suitability and the integrated risk of opium poppy cultivation. The different indicators, all rendered as grid-based data, are integrated through the approach of integrated geons (Kienberger and Hagenlocher Citation2014; Lang et al. Citation2014). This approach allows the modelling of homogenous regions which are independent from administrative boundaries (see Section 2.5). In the final step (4), results are mapped using a novel legend which aims to better reflect the distribution of the indicator values.
2.3. Defining risk of and vulnerability to opium poppy cultivation
Interdisciplinary concepts of risk and vulnerability evolved into different application domains in the recent past. A first integrated understanding of the concept originates from social sciences and human ecology under the frame of disaster risk reduction (Hewitt Citation1983). The same author demonstrated that social vulnerability is a major driver of disaster risk, while the hazard itself is often merely the trigger. This led to a shift in understanding (disaster) risk, which had previously been understood as a concept primarily relating to the physical environment. As such, underlying factors and root causes often found within the wider socio-economic domain aimed to explain differences in the outcome of disasters independent from its pure hazard magnitude–frequency relationship. The concept is nowadays applied in the frame of climate change adaptation, whereas recent Intergovernmental Panel on Climate Change (IPCC) reports (IPCC Citation2012, Citation2014) aimed to bridge the differences in understanding between the climate change adaptation and disaster risk reduction community. The challenge with vulnerability is that it cannot be directly measured or assessed, and therefore requires deductively built, heuristic frameworks, which are able to guide analysis and assessments (Birkmann et al. Citation2013). The key issue is that risk and vulnerability assessments aim to identify factors, which characterize a high risk and a potential high impact of a specific phenomenon. Practically speaking, it is used by decision-makers, to identify intervention measures and therefore aims to inform policy. However, despite its wide application, there is currently no common consensus in regard to specific frameworks and if indicator-based approaches are the most suitable (Hinkel Citation2011).
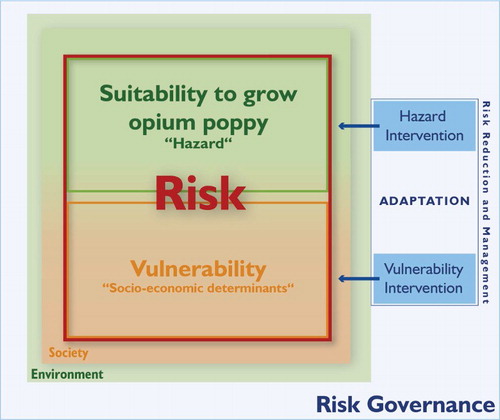
The herein translated and applied framework builds in a simplified manner on the integrated ‘MOVE risk and vulnerability framework’ (Birkmann et al. Citation2013). In the present case, we define the risk of opium poppy cultivation as a result of the interactions of the environmental and climatic suitability to grow opium poppy with social (and socio-economic) drivers and determinants. Environmental suitability can also be understood as a type of ‘hazard’, that is, the potentiality of a specific location for the cultivation of opium poppy. Although ‘hazard’ has a strong negative connotation, the environmental and climatic suitability of a specified area for opium poppy cultivation alone is not a negative phenomenon, as it likely represents a fertile cropping region. In a way, it can be understood as an area which is susceptible to opium poppy cultivation due to its environmental favourable characteristics.
The multi-dimensional and latent phenomena of vulnerability attempts to capture the socio-economic factors that are responsible for opium poppy being cultivated and addresses the root causes (Wisner et al. Citation2004). Vulnerability is thus defined as the predisposition or susceptibility of the society and its population to the cultivation of opium poppy. If the surrounding farmland offers suitable growing conditions, this does not mean that a farmer will necessarily cultivate illicit crops. This decision-making process is best understood by assessing a broad spectrum of possible explanatory factors, which have previously been explored and documented in social and interdisciplinary literature (see data selection section below). By analysing the drivers of cultivation, the distribution of opium poppy in Afghanistan can be better understood and allows possible intervention measures to be identified.
Based primarily on the Ministry of Counter Narcotics and UNODC (MCN/UNODC) survey data from 2010 to 2013 as well as supplementary data sets from different sources, the objective was to assess the relative environmental suitability, socio-economic vulnerability and thus integrated risk of opium poppy cultivation in Afghanistan to (1) improve the understanding of underlying factors and provide an integrative risk view and (2) provide an up-to-date basis for determining appropriate intervention strategies considering root causes of opium poppy cultivation ().
Figure 1. Conceptual risk framework defining the risk of opium poppy cultivation, with its subcomponents of environmental and climatic suitability and socio-economic vulnerability. The suitability is mainly embedded within environmental conditions, whereas the vulnerability is defined by societal drivers. For both components appropriate intervention measures can be identified (built on Birkmann et al. Citation2013; Kienberger and Hagenlocher Citation2014).
Risk is modelled by employing a deductive approach: the set of indicators defining risk was chosen on the basis of a predefined conceptualization of risk and vulnerability, which was based on an extensive literature research and expert opinions. Due to the missing empirical evidence for the relative relevance of different factors (especially for the socio-economic domain), the indicators were weighted by a group of experts (including persons with local knowledge). The model was validated by using the available data set of locations of opium poppy cultivation.
2.4. Indicators and data sets
The modelling of risk of opium poppy cultivation is based on a number of factors which are quantified and represented through spatial indicators. The selection process is based on literature review and expert opinion to identify factors relevant for the context in Afghanistan. Depending on the adequacy of data and/or data availability, a final indicator list is developed.
and provide an overview of the indicators selected and their weights assigned by experts. In the following we shortly discuss and justify the indicators, based on findings from a wide body of literature and an overview of the data sets used to populate the indicators. Each indicator data layer is prepared for further modelling on a regular 10 × 10 km² grid. This standardized grid is also used by UNODC for their reporting on opium poppy sites.
2.4.1. Indicators for the environmental opium poppy suitability
The environmental and climatic suitability to cultivate opium poppy (Papaver somniferum) is dependent on a number of factors such as the prevailing physio-geographical and climatic characteristics. In our case, the assessment was developed from data on land cover, water availability, climatic suitability based on the EcoCrop model (Hijmans et al. Citation2001) and the suitability of soils. provides an overview of the four indicators (S1–S4) used. The factor determined to be the most important by experts is land cover (S1, 0.41 – the sum of the weights equals 1.0), followed by water availability (S2, 0.28) and climatic conditions (S3, 0.21), respectively. This is in line with additional studies previously carried out by UNODC (Citation2011) for Myanmar.
Table 1. Properties of the selected indicators for environmental poppy suitability.
For the land cover indicator (S1), the 300 m spatial resolution Globcover 2009 data set (Arino et al. Citation2012) was used in combination with agricultural areas which were mapped on-screen by UNODC applying high-resolution satellite data. The land cover indicator is seen as a proxy for the utilization of land and reflects the general suitability of land to grow poppy. The agricultural areas include grasslands and croplands as well as irrigated fields. Due to their greater accuracy, the manually digitized agricultural zones were attributed more significance and combined with the Globcover data set to increase the quality of the land cover indicator substantially. In more detail, a rule-based overlay approach was applied (cf. Tiede Citation2014) for the integration of the high-resolution UNODC agricultural areas with the Globcover data set. If the more detailed agricultural areas enclosed more than 25% of a Globcover cell, this Globcover pixel was attributed the value of an agricultural area. If the 0.09 km² area (pixel size) of a particular Globcover unit included more than 25% of a very suitable land cover class, as digitized by the UNODC, then this pixel would reflect (and not hide) that reality. As such, the detailed mapping information of the UNODC on the most suitable agricultural areas is integrated into the Globcover data set. The subsequent step is to normalize the land cover classes using AHP. Each class, as shown in , receives a normalized value ranging between 0 and 100, depending on the expert-based perceived suitability and potential for opium poppy cultivation. The land cover data set is then reclassified to the values of the AHP results (e.g. irrigated croplands receive the value 100). Furthermore, the resampling to 10 × 10 km² uses an aggregation method, which calculates the sum of the values within each 10 × 10 km² cell, which represents the average suitability of each pixel.
Table 2. Normalized values for each land cover class to represent the land use/land cover indicator (S1).
Water availability and scarcity (S2) is a significant issue in the predominantly continental and dry climate, though opium poppy is capable of surviving with minimal amounts of rainfall. Pain (Citation2007), Mansfield and Pain (Citation2007) and Mansfield (Citation2008) discussed the impact of water management systems in Afghanistan on the spread of opium poppy cultivation, emphasizing the importance of water availability as a key determinant. The cultivation of opium poppy is typically aided by irrigation systems. According to Rout (Citation2008), approximately 42% of the country’s arable area is intermittently or intensively irrigated, mostly within the fertile valleys with close proximity to rivers. To incorporate the significance of irrigation for the cultivation of crops, a river stream network was delineated from the NASA Shuttle Radar Topographic Mission digital elevation model (Jarvis et al. Citation2008). In a second step, the proximity to streams and rivers was derived, whereby the size of a river or stream, by using the Strahler stream order, was considered to estimate the irrigation capacity in each respective valley. This water availability indicator (S2) was considered by experts to be highly relevant and was attributed a relative weight of 0.28.
The EcoCrop database (FAO Citation2000) and model developed for DIVA-GIS (Hijmans et al. Citation2001) was utilized to locate suitable areas for cultivation based on the tolerable climatic conditions () for Papaver somniferum (S3). The indicator is based on monthly minimum and maximum temperature (Tmin and Tmax) and precipitation (P) values from the WorldClim database (Hijmans et al. Citation2005). Needless to say, a suitable climate is an obvious precondition for cultivation, as Papaver somniferum requires dry, warm weather during capsule ripening (Sader Citation1990; Simon, Chadwick, and Craker Citation1984) and is frost sensitive. Therefore, the growing period is dependent on suitable temperatures, which influence harvest times: May in the south compared to July in the mountainous northeast of Afghanistan.
Table 3. EcoCrop model parameters for climate suitability indicator (S3).
As a fourth environmental suitability indicator, we integrated data on soil types (S4). Ideal soils for opium poppy are well-drained and rich and can be moderately acidic to alkaline, with an optimal pH at 6.0 (Lim Citation2013). As high-resolution and -quality soil data were not available, the Harmonized World Soil Database (FAO Citation2012) was used to classify the soil suitability according to the properties of the FAO soil units.
2.4.2. Indicators for socio-economic vulnerability
The indicators to represent the socio-economic vulnerability domain in the risk framework are based on the review of literature as well as expert consultations. References are provided below as well as in for each indicator (V1–V9). Six out of nine socio-economic indicators for the socio-economic vulnerability domain are based on the AOPS conducted by MCN and UNODC between 2010 and 2013 (UNODC Citation2012). More than 14,000 villages were surveyed in a period of 4 years, providing a substantial georeferenced basis for the development of relevant spatial indicators. The assessment results also provide general evidence of underlying factors that are valid for the entire period and less sensitive to annual changes. The point data locations were interpolated using the inverse distance weighting method in order to render a continuous spatial data set for the different indicators. The incidents data, that is, the conflict data (Armed Conflict Location & Event Data Project – ACLED; Raleigh et al. Citation2010) and the GRUMP settlement points (Global Rural-Urban Mapping Project; CIESIN et al. Citation2011), were interpolated using a kernel density function. The indicator ‘lack of governance’ (V1) is complex and aims to reveal the ability of the governing authority to enforce policies against opium poppy cultivation. More stable and law-abiding areas seem to be under government control compared to those areas where the governing authority is not recognized. Goodhand (Citation2005) discussed the interconnections between opium poppy cultivation and warlords, such as the Taliban, which created a conducive environment for opium poppy cultivation in their areas of influence. Furthermore, Mansfield (Citation2005) found that the increasing influence of the Taliban in the south of Afghanistan is associated with a rise of opium poppy cultivation. Mansfield and Pain (Citation2007) attributed lacking confidence in the governing authorities, predominantly by the rural population, to the widespread perception that counter narcotic measures are simply targeting the assets of the poor and thus considered to be corrupt practices.
Table 4. Properties of the selected indicators for socio-economic vulnerability.
The indicator ‘lack of stability’ (V2) builds on conflict incidents between 2004 and 2010 as recorded by the ACLED database (Raleigh et al. Citation2010). We build on the hypothesis that less stable areas are in general more vulnerable to opium poppy cultivation. This indicator is thus somewhat connected to the indicator ‘lack of governance’. This is confirmed by literature (Goodhand Citation2005), who found that struggles between warlords are connected to the control of trade routes of illicit drugs and that opium markets were an additional reason for conflicts.
According to Mansfield (Citation2008), the proximity to the provincial capitals and relevant cities provides better access to commodity markets for non-agricultural goods and licit agricultural products and to daily wage labour and related salaried employment. Moreover, areas close to provincial centres may have better security and are more likely to benefit from superior infrastructure. Such areas are thus likely to be less vulnerable than peripheral regions. The indicators of ‘peripheral regions’ (V3) and ‘lack of accessibility’ (V4) specifically reflect these factors.
Additional social indicators, such as the lack of alternatives to on-farm employment (V5), educational facilities (V6) and awareness (V7), aim to better understand and reflect the social context. Facilities for vocational training and higher educational standards can serve as alternatives to poppy cultivation The AOP survey inquired whether or not alternative income opportunities were available (V5); for example, Mansfield (Citation2004), Goodhand (Citation2005) and Mansfield and Pain (Citation2007) provided evidence that farmers have limited choice but to cultivate opium poppy to sustain their livelihoods. As such, high levels of opium poppy cultivation can reflect the lack of diversification existing in on-farm, off-farm and non-farm income opportunities. Lack of awareness (V7) is represented indirectly through the proxy that indicates whether or not initiatives were made to convince farmers not to cultivate opium poppy and/or agricultural assistance was received. This plays a central role in reducing the cultivation of opium poppy, as is explained in the Opium Survey 2012 (UNODC Citation2012, 1): ‘villages which had been reached by anti-poppy awareness campaigns were significantly less likely to grow poppy’.
Additional economic indicators further contribute to the socio-economic vulnerability framework. Access to advanced payments for poppy cultivation (V8) is a major incentive for farmers to cultivate, given the need for capital to ensure survival: ‘Farmers grow poppy […] secondly because it provides access to land and credit’ (Goodhand Citation2005, 207). The average daily wages of wheat harvesting and construction serve as a proxy for poverty (V9). The assumption in this case is that areas characterized by lower income are more vulnerable to poppy cultivation as a result of the high differential between existing wages and potential income from opium cultivation.
Further evidence and discussion on which factors facilitate opium production is provided in Morrison (Citation1997), Farrell (Citation1998) and Windle (Citation2016).
The entire set of vulnerability indicators were weighted by the same group of experts using the AHP-weighting method. The results reveal that all indicators are considered to be relevant and important (see ), which means that no single indicator is greatly set apart from the others. However, the three indicators related to stability (V2), accessibility (V4) and alternative forms of employment (V5) were attributed with the highest weights (0.15, respectively). The indicator related to access to educational facilities (V6) was considered least important (0.06).
2.5. Spatial modelling of risk of opium poppy cultivation
The spatial assessment of risk of opium poppy cultivation was based on a specific methodology which aims to model spatial, latent and multi-dimensional and thus complex phenomena, and builds on the concept of ‘integrated geons’. Integrated geons are defined as integrative – due to the integration of multiple indicators across different domains – and homogenous spatial objects (Kienberger and Hagenlocher Citation2014; Lang et al. Citation2014). The benefit of applying geons as reporting units compared to a continuous grid or administrative boundaries is the spatial-explicitness of geons and the process-oriented presentation of results. Each region is the product of its unique characteristics, with boundaries formed as a result of the underlying processes specific to that region. While the risk of opium poppy can depend on administrative boundaries due to provincial policy differences, most of the factors identified are unrelated to political constructs. Thus, integrated geons allow the identification of homogenous regions, for which tailored (trans-border) and place-specific interventions can be developed. Additionally, geons are able to be characterized through specific metrics (e.g. single indicator values, aggregated risk index, etc.), which allow the multi-dimensional characteristic of a phenomena to be integrated, while at the same time decomposing the underlying phenomena into the respective contributing factors. Thus, geons do not mask out spatial variations as is the case when aggregating results to administrative units, but much rather provide place-specific and policy-relevant, workable regions for intervention development and implementation as well as monitoring of trends.
A variation of the multi-resolution segmentation method by Baatz and Schäpe (Citation2000) delineates the homogeneous regions which is) based on the values of the indicator layers (raster data sets). The required parameter of the segmentation algorithm, defining the allowed homogeneity of regions (= scale parameter, i.e. a relative measurement for the size of the regions), was parameterized through a statistical analysis of the input layers using the Estimation of Scale Parameter Tool (Drăguţ et al. Citation2014). Additionally, the expert weights for the individual layers were considered in the segmentation. Different to the approach presented in Kienberger and Hagenlocher (Citation2014), firstly, the suitability and vulnerability regions where segmented independently using the respective indicators. The final modelling of risk was done using a stepwise integration approach programmed in Cognition Network Language within the software eCognition (Trimble Geospatial). To derive common risk regions, the former-derived vulnerability and suitability regions were merged (intersect) in a first step. An additional segmentation, based on the intersected regions, was conducted to merge regions of similar values in the different indicators towards new homogenous regions of similar risk, considering again the individual weights of the domain specific indicators. Compared to a modelling of risk regions starting from the combined indicators only (cf. Kienberger and Hagenlocher Citation2014), this stepwise integration approach preserves ‘strong’ region borders of the initial suitability and vulnerability regions to ease comprehensive analysis of the resulting maps. The vulnerability and suitability indices are AHP-weighted magnitudes of the indicator vectors (see also Kienberger and Hagenlocher Citation2014). Due to the vector magnitude, a change among the larger indicator values impacts the index stronger than a change of smaller values. The vulnerability and suitability indices are combined into a risk index using an equally weighted geometric mean, that is, if either the suitability or vulnerability equates to zero, the total risk is also zero.
In the final step, the results and single indicator values are visualized applying bar charts in order to facilitate the exploration of the relative contributions of the indicators to the final indices (see ). A specific novelty is the legend for visualizing the suitability, vulnerability and risk indices in the legend. The maximum possible value range of the index has been set between 0 and 100, indicating no risk and very high risk. In the legend, the calculated indicator values are visualized with gradual colours (green = suitability, orange = vulnerability and blue to red for the risk). Next to the referencing of the achieved value range within the possible ones, a histogram shows the distribution of the index values. The benefit of this visualization is that it provides transparency on the use of colours within the value range, as well as information on how the values are distributed within that range. Often colours are rendered relative to the minimum and maximum values, which neglects the fact that the achieved maximum level is, for example, 60 when 100 would be possible. As such this region with the exemplary value 60 would then be visualized with, for example, dark red colour, pretending to be the highest possible value. This would be misleading, as it would be a medium-high level in the absolute scale range. On the other hand, using the possible colours in the stricter sense, would lead to a flattening of colours, and no differentiation between the units would be possible. Therefore, the proposed new legend shows (i) minima and maxima values on an absolute scale (between 0 and 100), (ii) clearly relates the colours used within this range and (iii) shows a histogram of the index values along this scale. The results use a continuous and linear classification of data ranges and related colour, so that each value gets a unique colour code. Such legend-generation goes beyond standard geographic information system (GIS), capabilities and required the programming of a VB.Net Add-in for ArcGIS accessing the ESRI ArcObjects library.
3. Results and discussion
The resulting maps depict the hazard, vulnerability and risk of opium poppy cultivation in Afghanistan as a standardized index with values in the range from 0 to 100. As can be seen in , the legend provides additional information by portraying the distribution of the index values.
Figure 2. Homogeneous regions of environmental suitability to opium poppy cultivation in Afghanistan, province borders are overlain in white colour.
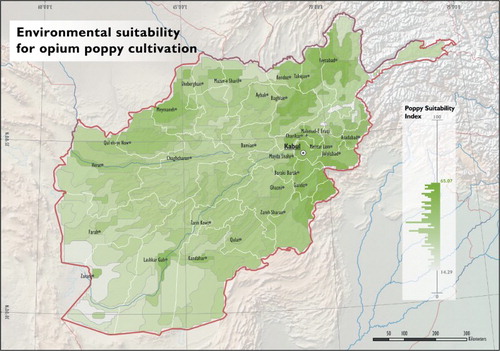
Figure 3. Homogeneous regions of socio-economic vulnerability to opium poppy cultivation in Afghanistan, province borders are overlain in white colour.
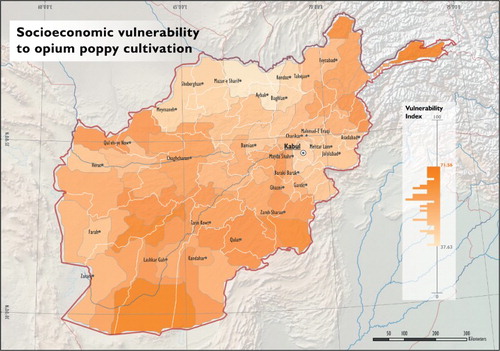
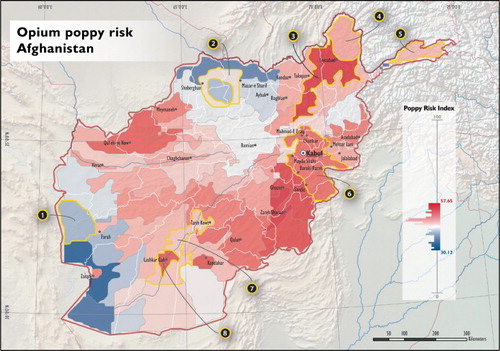
Figure 4. Risk map integrating environmental suitability and socio-economic vulnerability. Eight regions are highlighted for a detailed inspection (see ).
The poppy suitability map shows higher index values () in the plains of the northern and south-eastern parts of Afghanistan, with less suitable areas being located in the glaciated northeast (Hindukush) and the Wakhan Corridor, the arid Sistan Basin in the southwest, as well as the central highlands. The map generally reflects the topography, that is, the valleys and mountainous terrain, as well as the prevailing climatic conditions. An interesting observation is that the major settlement areas are commonly located in areas with relatively higher levels of environmental suitability, which relates to the utilization of land for agricultural purposes. The map must be viewed and interpreted while bearing in mind that the scale of the underlying data is specifically designed to be valid for a national-scaled assessment, so that detailed information is not directly evident (e.g. the narrow, fertile valleys of the highlands). The distribution and range of index values, as presented in the legend of the map (), suggests that no single region is ideally suitable (which would equate to a value of 100, the maximum value found is 65.07) for the cultivation of opium poppy.
This is a fact which underlines the extensive irrigation needed in many parts of the country. The minimum index value found in the south-west (14.29) indicates that even the least suitable areas in Afghanistan have a very minor potential for poppy cultivation. However, this would require significant measures and support, such as irrigation, land cover change, etc., to do so. The socio-economic vulnerability result () displays higher values in central and southern areas as well as the north east. Areas with low levels alternative employment opportunities, accessibility (which are most often rural areas) and high levels of conflict can be considered as relevant drivers of high vulnerability values, which is also in part due to their higher weightings (). The lowest levels appear in the northern areas of Afghanistan within the provinces Samangan, Balkh and Kunduz, as well as in the area surrounding the capital Kabul. The lowest value of vulnerability is 37.63, which indicates that even these regions are potentially susceptible to the cultivation of opium poppy.
The risk to poppy cultivation is displayed in and is the synthesis of the environmental suitability and socio-economic vulnerability modelling results (see also UNODC Citation2015). The delineation of the geons thus also differs, as all of the underlying factors are taken into account for its delineation within the final modelling approach (as outlined above). High risk is apparent in eastern, northern and north-western areas, and specifically in the Helmand valley around Lashkar Gah. The diverse drivers of risk are explicated by the bar charts in , which show the absolute and unweighted values for each indicator. The pie charts represent the relative contribution of environmental suitability and socio-economic vulnerability to the weighted risk index.
Figure 5. Decomposition of factors for selected regions (see ). The bar charts visualize the absolute and unweighted mean indicator value per region. The bar charts show the contribution of the environmental suitability and socio-economic vulnerability to the weighted risk index. The size of the pie charts reflects the risk index value.
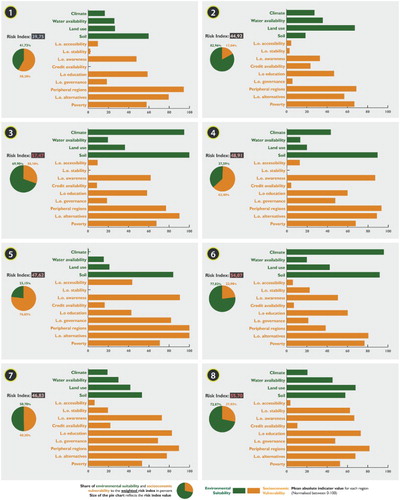
Two areas, namely region #1 (near Farah) and #2 (in northern Afghanistan) were selected as they both have relatively low levels of risk of opium cultivation. The known level of poppy cultivation in these two areas is significantly different and is therefore an interesting case for discussing the determinants of risk juxtaposed with the reality of cultivation on the ground. The region #1 has a risk index of 39.75, the region #2 close to Mazar-i-Sharif, has a risk index of 44.92. Though there was no poppy cultivation in #2, #1 accounted for 12% of total opium cultivation in Afghanistan in 2014. However, the composition of the factors contributing to risk is inversely different (see pie charts in ). The region #1 has a fairly low level of risk due to its low environmental suitability in comparison to its higher socio-economic vulnerability. Conversely, the region #2 has a low level of socio-economic vulnerability in comparison to its environmental suitability. Indeed, poppy cultivation in #1 seems to be driven by greater levels of socio-economic vulnerability (UNODC Citation2015).
A very good reflection of the distribution of opium poppy cultivation by the risk index can be found in the province of Badakhshan (north-eastern Afghanistan). The regions analysed include the region with the highest risk index (#3). It covers the western area of the province of Badakhshan where most opium cultivation occurs, and two other areas – #4 and #5 – that show lower risk values and cover areas with lower amounts of poppy cultivation. When investigating the composition of the risk indicators in , it is evident that this difference is partly caused by the environmental suitability factors. The region in western Badakhshan (#3) generally exhibits lower levels of vulnerability but higher values in terms of all indicators related to the environmental suitability. This implies that the geographical distribution of opium poppy in Badakhshan is strongly related to environmental factors, particularly climate, and to a lesser extent by factors related to socio-economic characteristics. From a policy perspective, a focus on the areas which are highly suitable for poppy cultivation could be more effective since alternative livelihoods are more likely to be available (UNODC Citation2015).
A further interesting case study comprises two regions located in Helmand province: the first (#8) is located around the provincial capital, Lashkar Gah, and the other region surrounds this region (#7). The ‘urban’ region #8 has a higher overall risk of opium poppy cultivation than the region #7, but it has lower levels of actual cultivation than in the rest of the province. The decomposition of risk by indicator provides possible explanations for this difference. The region #8 has a high risk due to its socio-economic and environmental conditions compared to the risk in region #7, which is associated with its lower quality of land and water availability. This shows that cultivation in these circumstances is led by socio-economic conditions – specifically due to higher values in the indicator ‘lack of stability’ in region #8 (UNODC Citation2015).
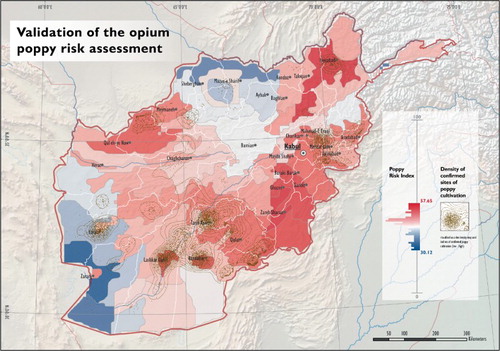
When comparing the risk map with the location of areas where poppy is known to be cultivated in , the map largely reflects the current situation on the ground, with minor underestimations in some areas (e.g. north of Farah), but mostly overestimating the level of risk in other areas (particularly in the East and in the provinces of Paktika, Khost, Paktia and Ghazni). This phenomenon can be attributed to the latency of vulnerability and risk, as well as the fact that the incidence of poppy fields does not necessarily need to relate directly to the potential reflected by the risk map. Additionally, it has to be noted that the maps presented here have been prepared for a subnational comparison, which means that care needs to be taken when an attempt is made to view the information provided at a very specific location and validated with exact point locations. For this reason, a smoothed surface is used to compare the map with known sites of poppy. Furthermore, it must be noted that the risk map shows potentials, that is, the ‘what could be’, and must not be confused with a prediction. It therefore could be that a single factor, such as the recognition of the governor who forbids the cultivation, means that opium poppy is currently not cultivated. Opinions, personalities and particular eventualities could lead to a widespread support of opium poppy cultivation in these prone areas. Since these areas show high risk, the possibility to grow here is given, which can be seen as an important source of information. In total, the results of the risk assessment are in fair agreement with the validation points as concentration of opium poppy cultivation are generally located in high-risk areas.
Figure 6. Opium poppy risk regions in comparison with the density of confirmed sites of poppy cultivation (shown as dot density maps; dots do not represent real locations of opium poppy fields).
The resulting risk map provides an opportunity to visualize spatially explicit information and to integrate a number of factors, which are all related to the cultivation of opium poppy. An overview of different risk factors is thus provided in an integrated manner and enables the various factors to be explored as well as the ‘quality’ of risk, when evaluating the regions and the respective contributing/characterising factors.
4. Conclusions
The opium poppy risk assessment serves as a basis for exploring the complex nature of illicit crops in Afghanistan, which is a local phenomenon tied up in a far broader reality with both personal and external influences leading farmers to cultivate opium poppy. Opium poppy is known as ‘a low-risk crop in a high-risk environment’ (Mansfield and Pain Citation2007, 2), in the sense that it is a drought-resistant crop that can be stored well and is continually in high demand; at the same time having implications which are associated to the cultivation of illicit crops. It can be argued that a spatial model of the risk of opium poppy cultivation can only attempt to portray the meaning of this statement and struggles to provide the detail necessary to understand the complex nature and meaning of this lucrative commodity in Afghanistan. However, the risk assessment illustrates the complexity and interdependency of the illicit crops situation in Afghanistan. Furthermore, it aims at encouraging a more profound and integrated examination of the drivers of opium poppy cultivation in a spatial context. The analysis confirms what has been widely discussed in literature: that reasons for cultivation are spatially diverse and often distinct, meaning that any formulation of generalized explanations cannot be drawn without ignoring a more complex reality. Thus, an integrative view of risk, which integrates the social dimension as well as environmental parameters, has several advantages: The spatially explicit assessment clearly shows that substantial differences within Afghanistan exist, both in terms of the values and the nature of vulnerability to opium poppy cultivation and the environmental suitability of the land. New visualization techniques provide transparency on the use of colours within the value range, as well as information on how the values are distributed within that range, which eases the interpretation process of the resulting maps. Furthermore, each region (geon) can be decomposed into its components, allowing the identification of contributions of the single factors to the overall risk. In this way, the risk assessment can support the development of spatial-explicit and context-specific interventions in order to reduce risks and vulnerabilities, that is, to deter communities from considering illicit crops as a source of income. An effective, localized intervention measure might lead to a situation where drug crop cultivation is shifted to other regions within the country (Windle and Farrell Citation2012). The proposed conceptual framework might be useful in both monitoring such shifts and identifying areas prone to an increase of cultivation due to a decrease somewhere else. While intervening in the environmental suitability of an area is a challenging proposition, increasing awareness of the spatial environmental suitability for cultivation is achieved through the suitability assessment. By considering the results of the vulnerability assessment, the drivers of vulnerability can be better explored and can assist with addressing spatial variations. The results of the AOPS of the Ministry of Counter Narcotics and UNODC serve as direct input into the model, and are therefore a valuable source of very recent information. Since 2010, the AOPS provide reliable information related to the socio-economic vulnerability of villages on an annual basis. Therefore, the risk and vulnerability assessment has the potential to be employed as a monitoring tool to evaluate changes in time and space as well as the impact of various interventions. Finally, the proposed conceptual framework together with the method used can be applied in other national contexts and/or for other drug crops – providing the (indicator) framework is adapted to the specific circumstances.
Supplementary_Material.docx
Download MS Word (16.1 KB)Acknowledgements
The research has received funding from the European Commission (EC) within the FP7 project G-SEXTANT (contract number: 312912). The contents of this publication do not necessarily reflect the views or policies of UNODC or contributory organizations and neither do they imply any endorsement. We would like to thank Christoph Mayrhofer for programming the Histogram Legend Tool.
Disclosure statement
No potential conflict of interest was reported by the authors.
ORCID
Stefan Kienberger http://orcid.org/0000-0002-4800-4516
Raphael Spiekermann http://orcid.org/0000-0002-4772-9750
Dirk Tiede http://orcid.org/0000-0002-5473-3344
Irmgard Zeiler http://orcid.org/0000-0002-2399-041X
Coen Bussink http://orcid.org/0000-0002-1557-7190
Additional information
Funding
Related Research Data
References
- Arino, O., J. J. Ramos Perez, V. Kalogirou, S. Bontemps, P. Defourny, and E. Van Bogaert. 2012. Global Land Cover Map for 2009 (GlobCover 2009). © European Space Agency (ESA) & Université catholique de Louvain (UCL). doi:10.1594/PANGAEA.787668.
- Baatz, M., and A. Schäpe. 2000. “Multiresolution Segmentation – An Optimization Approach for High Quality Multi-Scale Image Segmentation.” In Angewandte Geographische Informationsverarbeitung, edited by J. Strobl, T. Blaschke, and G. Griesebner, 12–23. Heidelberg: Wichmann-Verlag.
- Birkmann, J., O. A. Cardona, L. Carreño, A. Barbat, M. Pelling, S. Schneiderbauer, S. Kienberger, et al. 2013. “Framing Vulnerability, Risk and Societal Responses: The MOVE Framework.” Natural Hazards 67 (2): 193–211. http://dx.doi.org/10.1007/s11069-013-0558-5. doi: 10.1007/s11069-013-0558-5
- Center for International Earth Science Information Network – CIESIN – Columbia University, International Food Policy Research Institute – IFPRI, The World Bank, and Centro Internacional de Agricultura Tropical – CIAT. 2011. Global Rural-Urban Mapping Project, Version 1 (GRUMPv1): Urban Extents Grid. Palisades, NY: NASA Socioeconomic Data and Applications Center (SEDAC).
- Drăguţ, L., O. Csillik, C. Eisank, and D. Tiede. 2014. “Automated Parameterisation for Multi-Scale Image Segmentation on Multiple Layers.” ISPRS Journal of Photogrammetry and Remote Sensing 88: 119–127. doi: 10.1016/j.isprsjprs.2013.11.018
- FAO (Food and Agriculture Organization of the United Nations). 2000. The EcoCrop Database. Rome.
- FAO (Food and Agriculture Organization of the United Nations). 2012. Harmonized World Soil Database (version 1.2), Food Agriculture Organization, Rome, Italy and IIASA, Laxenburg, Austria. http://webarchive.iiasa.ac.at/Research/LUC/External-World-soil-database/HTML/.
- Farrell, G. 1998. “A Global Empirical review of Drug Crop Eradication and United Nations Crop Substitution and Alternative Development Strategies.” Journal of Drug Issues 28 (2): 395–436. doi: 10.1177/002204269802800207
- Goodhand, J. 2005. “Frontiers and Wars: the Opium Economy in Afghanistan.” Journal of Agrarian Change 5 (2): 191–216. doi: 10.1111/j.1471-0366.2005.00099.x
- Hewitt, K. 1983. Interpretations of Calamity: From the Viewpoint of Human Ecology. Boston, MA: Allen & Unwin.
- Hijmans, R. J., S. E. Cameron, J. L. Parra, P. G. Jones, and A. Jarvis. 2005. “Very High Resolution Interpolated Climate Surfaces for Global Land Areas.” International Journal of Climatology 25: 1965–1978. doi: 10.1002/joc.1276
- Hijmans, R. J., L. Guarino, M. Cruz, and E. Rojas. 2001. “Computer Tools for Spatial Analysis of Plant Genetic Resources Data. 1. DIVA-GIS.” Plant Genetic Resources Newsletter 127: 15–19.
- Hinkel, J. 2011. “Indicators of Vulnerability and Adaptive Capacity: Towards a Clarification of the Science–Policy Interface.” Global Environmental Change 21: 198–208. doi: 10.1016/j.gloenvcha.2010.08.002
- IPCC (Intergovernmental Panel on Climate Change). 2012. “Managing the Risks of Extreme Events and Disasters to Advance Climate Change Adaptation.” In A Special Report of Working Groups I and II of the Intergovernmental Panel on Climate Change, edited by C. B., Field, V. Barros, T. F., Stocker, D., Qin, D. J., Dokken, K. L., Ebi, M. D., Mastrandrea, et al., 582. Cambridge: Cambridge University Press.
- IPCC (Intergovernmental Panel on Climate Change). 2014. “Summary for Policymakers.” In Climate Change 2014: Impacts, Adaptation, and Vulnerability. Part A: Global and Sectoral Aspects. Contribution of Working Group II to the Fifth Assessment Report of the Intergovernmental Panel on Climate Change, edited by C. B., Field, V. R. Barros, D. J. Dokken, K. J. Mach, M. D. Mastrandrea, T. E. Bilir, M. Chatterjee, et al., 1–32. Cambridge: Cambridge University Press.
- Jarvis A., H. I. Reuter, A. Nelson, and E. Guevara. 2008. Hole-Filled Seamless SRTM Data V4, International Centre for Tropical Agriculture (CIAT). http://srtm.csi.cgiar.org.
- Kienberger, S., and M. Hagenlocher. 2014. “Spatial-Explicit Modeling of Social Vulnerability to Malaria in East Africa.” International Journal of Health Geographics 13: 29. http://ij-healthgeographics.biomedcentral.com/articles/10.1186/1476-072X-13-29. doi: 10.1186/1476-072X-13-29
- Lang, S., S. Kienberger, D. Tiede, M. Hagenlocher, and L. Pernkopf. 2014. “Geons – Domain-Specific Regionalization of Space.” Cartography and Geographic Information Science 41 (3): 214–226. http://dx.doi.org/10.1080/15230406.2014.902755. doi: 10.1080/15230406.2014.902755
- Lim, T. K. 2013. Edible Medicinal and Non-Medicinal Plants. 943. 5 vols, Fruits. Dordrecht: Springer.
- Mansfield, D. 2004. “What is Driving Opium Poppy Cultivation? Decision Making Amongst Opium Poppy Cultivators in Afghanistan in the 2003/4 Growing Season.” Paper for the UNODC/ONDCP Second Technical Conference on Drug Control Research, July 19–21. http://www.davidmansfield.org/data/Field_Work/UK/FinalReport0405dm.doc
- Mansfield, D. 2005. “Exploring the ‘Shades of Grey’: An Assessment of the Factors Influencing Decisions to Cultivate Opium Poppy in 2005/06.” A Report for the Afghan Drugs Inter Departmental Unit of the UK Government. http://www.davidmansfield.org/data/Field_Work/UK/Final2005Drivers.pdf.
- Mansfield, D. 2008. Water Management, Livestock and the Opium Economy. Resurgence and Reductions: Explanations for Changing Levels of Opium Poppy Cultivation in Nangarhar and Ghor in 2006–07. Kabul: AREU.
- Mansfield, D., and P. Fishstein. 2013. Eyes Wide Shut: Counter-Narcotics in Transition. Afghanistan. Briefing Paper. Kabul: Afghanistan Research and Evaluation Unit.
- Mansfield, D., and P. Fishstein. 2016. Moving with the Times: How Opium Poppy Cultivation has Adapted to the Changing Environment in Afghanistan. Watching Brief. Kabul: Afghanistan Research and Evaluation Unit.
- Mansfield, D., and A. Pain. 2007. Evidence from the Field: Understanding Changing Levels of Opium Poppy Cultivation. Afghanistan. Briefing Paper. Kabul: Afghanistan Research and Evaluation Unit.
- Morrison, S. 1997. “The Dynamics of Illicit Drugs Production: Future Sources and Threats.” Crime, Law and Social Change 27 (2): 121–138. doi: 10.1023/A:1008242117832
- Nelson, A. 2008. Estimated Travel Time to the Nearest City of 50,000 or More People in Year 2000. Ispra: Global Environment Monitoring Unit – Joint Research Centre of the European Commission.
- OECD (Organisation for Economic Co-operation and Development). 2008. “Handbook on Constructing Composite Indicators: Methodology and User Guide.” http://www.oecd.org/std/42495745.pdf .
- Pain, A. 2007. Water Management, Livestock and the Opium Economy: The Spread of Opium Poppy Cultivation in Balkh. Kabul: AREU.
- Parenti, C. 2015. “Flower of War: An Environmental History of Opium Poppy in Afghanistan.” SAIS Review of International Affairs 35 (1): 183–200. doi: 10.1353/sais.2015.0000
- Raleigh, C., A. Linke, H. Hegre, and J. Karlsen. 2010. “Introducing ACLED-Armed Conflict Location and Event Data.” Journal of Peace Research 47 (5): 651–660. doi: 10.1177/0022343310378914
- Rout, B. 2008. Water Management, Livestock and the Opium Economy. How the Water Flows: A Typology of Irrigation Systems in Afghanistan. Kabul: AREU.
- Saaty, T. L. 1980. The Analytic Hierarchy Process. New York: McGraw-Hill.
- Sader, S. A. 1990. “Remote Sensing of Narcotic Crops with Special Reference to Techniques for Detection and Monitoring of Poppy Production in Afghanistan.” Accessed July 10 2014. http://pdf.usaid.gov/pdf_docs/PNABT431.pdf.
- Simon, J. E., A. F. Chadwick, and L. E. Craker. 1984. Herbs: An Indexed Bibliography. 1971–1980. The Scientific Literature on Selected Herbs, and Aromatic and Medicinal Plants of the Temperate Zone. 770. Hamden, CT: Archon Books.
- Tiede, D. 2014. “A New Geospatial Overlay Method for the Analysis and Visualization of Spatial Change Patterns Using Object-Oriented Data Modeling Concepts.” Cartography and Geographic Information Science 41, 227–234. doi: 10.1080/15230406.2014.901900
- UNODC (United Nations Office on Drugs and Crime). 2011. Statistical Analysis of Risk Factors for Opium Poppy Growing in Myanmar. Analysis with Logistic and Decision-Tree Models. Vienna: United Nations Office on Drugs and Crime. June 2011.
- UNODC (United Nations Office on Drugs and Crime). 2012. Afghanistan Opium Survey 2012. Vienna: UNODC.
- UNODC (United Nations Office on Drugs and Crime). 2014. “Afghanistan: Opium Survey 2014 – Cultivation and Production.” Ministry of Counter Narcotics, Afghanistan and United Nations Office on Drugs and Crime, Vienna, December 2014. http://www.unodc.org/documents/crop-monitoring/Afghanistan/Afghan-opium-survey-2014.pdf.
- UNODC (United Nations Office on Drugs and Crime). 2015. “Afghanistan: Opium Survey 2014 – Socio-economic Analysis.” Ministry of Counter Narcotics, Afghanistan and United Nations Office on Drugs and Crime, Vienna, March 2015. https://www.unodc.org/documents/crop-monitoring/Afghanistan/Afghanistan_Opium_Survey_Socio-economic_analysis_2014_web.pdf.
- Windle, J. 2016. Suppressing Illicit Opium Production: Successful Intervention in Asia and the Middle East. London: IB Tauris.
- Windle, J., and G. Farrell. 2012. “Popping the Balloon Effect: Assessing Drug Law Enforcement in Terms of Displacement, Diffusion and the Containment Hypothesis.” Substance Use and Misuse 47 (8/9): 868–876. doi: 10.3109/10826084.2012.663274
- Wisner, B., P. Blaikie, T. Cannon, and I. Davis. 2004. At Risk: Natural Hazards, People’s Vulnerability and Disasters. London: Routledge.