
Abstract
The aim of this work was to characterise some of the most representative Sicilian honeys. Sugars, pH and minerals were determined with conventional analyses. Chestnut honeys showed the lowest sugar content, with a fructose and glucose sum of 62.31 g/100g. Citrus and Eucalyptus honeys showed the highest fructose content (38.08 and 38.04 g/100g), while Citrus and Sulla honeys had the highest sucrose content (3.16 and 3.92 g/100g). The highest fructose to glucose ratio was 1.59, found for Chestnut honeys, which had also the highest pH-value of 4.98. Potassium is the most abundant element in honey and the highest values were found for Chestnut and Eucalyptus honey (4.412 and 1.956 mg/g). Among micro-minerals, Zinc showed the highest concentration, ranging from 4.64 to 7.16 µg/g. Alongside physicochemical analyses, E-tongue and computer vision was used to estimate the organoleptic proprieties of honey. In particular, Pearson’s correlation was used to study the relationship between the electrical E-tongue’ signals, pH and sugars content, which have a major influence on the main taste attributes investigated in honey. Chestnut honeys scored the lowest values for the sweet and sour taste, being the bitterest among the samples evaluated. On the other hand, Sulla and Citrus honeys were the sweetest and the sourest. The colour of honey was examined with machine vision and the weight of the different minerals on the colour parameters was disclosed, resulting in dark colours correlated to sodium and microelements, and in a light colour that showed a negative correlation with potassium and magnesium.
A novel instrumental approach was used to characterise Sicilian honey.
Physicochemical parameters of Sicilian honeys were determined.
Electronic senses were used to perform a human-like sensory evaluation.
Correlation between physicochemical and organoleptic properties has been disclosed.
Highlights
Introduction
Honey is the most important product of beekeeping, both from a quantitative and an economical point of view; in addition, it was the first bee product used by humankind in ancient times (Adenekan et al. Citation2012; Nayik et al. Citation2014; Nayik and Nanda Citation2016a). Organoleptic characteristics and properties of honey may widely vary according to several factors, such as the species of flowers and plants, the environment where the plants grow and the insect itself (Attanzio et al. Citation2016); however, also the processing and storage conditions have an influence (Nayik et al. Citation2015; Nayik and Nanda Citation2015a; Citation2015b; Citation2016b). Honey consists of a solution of sugars, mainly fructose and glucose, with a small amount of higher sugars, enzymes, acids, salts and aromatic substances (Saitta et al. Citation2017; Nayik and Nanda Citation2015c). Sicilian honeys represent a wide and diversified typology, consisting of more than 30 monofloral honeys with plenty of multifloral ones due to the different climatic characteristics of the production areas and to the high diversity of the botanical species collected by the bees (Perna et al. Citation2012). Taking into consideration the honey production as an agricultural and zootechnical activity deeply rooted in the Sicilian territory, the main purpose of this work was to carry out a study with the aim of characterising some of the most representative Sicilian honeys, due to the lack of recent articles regarding this topic. In addition, sensory analyses applied to the honey is an important complementary part of the traditional physicochemical and pollen analyses. It is used as an analytical tool for the quality control of honey in relation to the evaluation of its botanical origin. It also confirms the recognition of defects like fermentation, presence of impurities, off odours of smoke, metallic taste, and other characteristics that common laboratory routine analyses do not access (Marcazzan et al. Citation2017). In the past decade, electronic senses coupled with chemometrics emerged as useful tools for the sensory assessment of honey samples. In particular, these were used for the discrimination of honeys’ botanical origin (Sousa et al. Citation2014; Dias et al. Citation2015; Huang et al. Citation2015; Di Rosa et al. Citation2017; Citation2018; Zakaria et al. Citation2011), to perform various classifications (Bougrini et al. Citation2016; El Hassani et al. Citation2018; Dymerski et al. Citation2014; Borras et al. Citation2015; Di Rosa and Leone Citation2018) and to detect adulterations (Gan et al. Citation2016; Oroian et al. Citation2018; Zabrodska and Vorlova Citation2014). However, the aim of the present work was to investigate the suitability of electronic senses as support tools for the sensory analyses, providing information similar to those obtained from human panellists.
Materials and methods
Honey samples
The honey samples used in this study were acquired from local beekeepers and their botanical origin was authenticated via melissopalynology analyses. All honey samples were harvested in Sicily and were characterised as unifloral since these were dominated by the nectar of one plant species. In particular, of the 28 samples used, 8 were Chestnut (Castanea sativa) honeys, 8 Eucalyptus (Eucalyptus camaldulensis) honeys, 5 Sulla (Hedysarum coronarium) honeys and 7 Citrus (Citrus spp.) honeys. All the samples were stored at 14 °C and mildly heated before each analyses. The sample set is resumed in Table .
Table 1. Sample set.
Physicochemical parameters
Glucose, fructose and sucrose content were measured via an enzymatic, spectrophotometric assay (K-SUFRG, Megazyme, Bray, Ireland). To perform the analyses, 10 g of each honey sample were heated for 15 minutes at 60 °C, stirred occasionally with a spatula, and allowed to cool. Then, 1 g of the liquid sample was weighed in a 100 mL volumetric flask and filled with bi-distilled water. The solution was diluted 1:10 (w/v) and 100 µL were tested according to the manufacturer’ instructions. The pH values were obtained according to the Harmonized Methods of the International Honey Commission (Bogdanov Citation2002). Concretely, 10 g of each honey sample were dissolved in 75 mL of bi-distilled water; therefore, the pH-meter electrodes were immersed in the solution and the pH was recorded. The measurements were performed in duplicate and the results expressed as the average.
Artificial sensory analyses
The electronic tongue (E-tongue) is an analytical instrument, whose core is an array of non-specific chemical sensors, used for the recognition of qualitative and quantitative composition of multispecies solutions (Ha et al. Citation2015). In this study, a system based on seven potentiometric sensors (αAstree, Alpha M.O.S., Toulouse, France), specifically designed for food and beverage analyses, was employed. The assays were carried out using 20% aqueous solutions of honey, according to our previous work (Di Rosa et al. Citation2018). Computer vision, enclosing the automatic acquisition, processing and analyses of digital images, aims to duplicate the human vision, in order to obtain useful information about physical objects (Timmermans and Hulzebosch Citation1996). In this study, a commercially available system (Iris Visual Analyser 400, Alpha M.O.S., Toulouse, France), equipped with a CCD (Charge-coupled device) camera, was employed to capture high-resolution images of the samples (Tretola et al. Citation2017a, Citation2017b). To perform the analyses, each sample was positioned inside the measurement chamber, which guarantees controlled light conditions and the images were acquired with a white background. Digital cameras are able to register the colour of any pixel from the image, using three colour sensors per pixel. Hence, the most often used colour model is the ‘RGB model’, in which each sensor captures the intensity of the light in the red (R), green (G) or blue (B) spectrum (León et al. Citation2006). For this reason, the colours extracted from each image were expressed in terms of R, G and B amounts.
ICP-MS multi-elemental analyses
K, Ca, Mg, Na, Zn, Fe and Mn content was measured via inductively coupled plasma-mass spectrometry (ICP-MS). These elements were chosen as the most important constituents of the mineral fraction, whereas play numerous beneficial roles for human health (Solayman et al. Citation2016; Zumbo et al. Citation2010). Concretely, 0.2 g of each honey sample were accurately weighed into a PTFE pressure vessel, followed by the addition of 8 mL of 65% HNO3 and 2 mL of 30% H2O2. Further, the vessels were placed in a microwave digester (ETHOS EASY, Milestone) and heated to 180 °C for 35 minutes, in order to remove all the organic material. After the mineralisation, the residues were transferred in a volumetric flask and filled with 2% aqueous HNO3. Finally, the honey solutions were subjected to the instrumental measurement. Table reports the specifications and the operating parameters for the ICP-MS. All the samples were analysed in batches, with blank samples and known standards. All the analyses were carried out in triplicate.
Table 2. Instrumental specifications and operating parameters.
Statistical analyses
The content of sugars and minerals was expressed in terms of min, max, mean, median and standard deviation. Moreover, in order to point out the significant differences among the four honey varieties, an ANOVA test was carried out using XLStat software on minerals and sugars content, on pH and on sensors responses. Electronic senses generates a vast volume of data; therefore, it is necessary to apply methods of data analyses, which allows for data classification (Sliwinska et al. Citation2014). Principal component analyses (PCA) is a dimension reduction technique that creates a few new variables called principal components (PCs) from linear combination of the original variables (Borras et al. Citation2015). This unsupervised exploratory technique was applied prior to any other more complex classification or prediction methods, in order to ascertain the quality of data and to detect outliers (Figure S1). Moreover, aiming to reduce the amount of colours extracted from the images of each honey sample, an agglomerative hierarchical clustering algorithm was used (Figure S2). In general, starting with a set of n objects, this kind of algorithms group the objects into successively fewer than n sets, arriving eventually at a single set containing all n objects (Day and Edelsbrunner Citation1984). Both of these techniques were performed with the native instrumental software (AlphaSoft, v14.1 - Alpha Mos, Toulouse, France). Pearson’s correlation is a common data analyses used to establish if there is a correlation between a pair of variables, i.e., what happens to a variable when the other increases. The strength of a linear relationship between paired data is measured with Pearson’s correlation coefficient, r. In particular, closer is the value to 1 or –1 and the stronger the positive or negative linear correlation. On the other hand, a value of zero denotes no correlation. Pearson’s correlation was performed with Microsoft Excel, in order to disclose the relationship between E-tongue’ potentiometric signals, sugars and pH, as well as the relationship between colour of honey and its mineral composition.
Results
Sugars content and pH
Carbohydrates are the main constituents of honey, comprising about 95% of honey dry weight. Among them, monosaccharides such as fructose and glucose, produced after the enzymatic hydrolysis of sucrose, due to the bee’s ability to convert the complex sugars found in flowers nectar into simple sugars, are the most abundant (Buba et al. Citation2013; Nayik et al. Citation2018). According to the Council Directive 2001/110/CE of 20 December 2001, unadultered honeys should present a sucrose content lower than 5% and a fructose + glucose content higher than 60%. Moreover, an important parameter, related to the honey crystallization time, is the ratio of fructose to glucose (Escuredo et al. Citation2014). In particular, the greater the ratio, the slower the process will be. Table shows the results obtained for the main carbohydrates content, as well as the fructose and glucose sum and the fructose to glucose ratio calculation, which are in agreement with the current legislation. Regarding the second parameter investigated, Bogdanov et al. (Citation2004) reported that all honeys are acidic with a pH-value generally lying between 3.5 and 5.5, due to the presence of organic acids that contribute to honey flavour and stability against microbial spoilage. In agreement, our results showed pH values ranging from 3.67 to 4.98 (Table ).
Table 3. Sugars content of the different honey varieties.
Table 4. Measured pH values.
Electronic tongue and computer vision
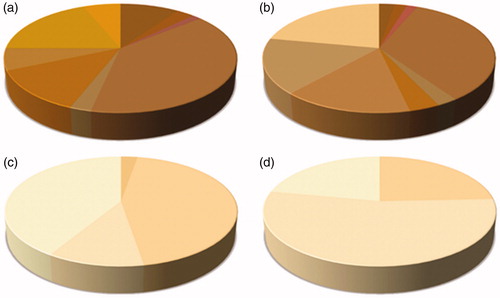
The E-tongue was used to perform a gustatory evaluation of honey, as taste is characteristic for each individual honey type. The E-tongue’ sensors (ZZ, JE, BB, CA, GA, HA, JB) are non-specific, poorly selective and with partial specificity (cross-selectivity). Thus, in order to achieve a human-like taste evaluation, the potentiometric signals recorded (Table S1) were correlated to the glucose and fructose content and to the pH values, which have the major influence on the sweetness, bitterness and sourness of the honey. The obtained Pearson’s correlation coefficients are resumed in Table S2. Once this relationship have been disclosed, i.e., which sensor is able to perceive a specific taste attribute; the following spider chart (Figure ) was obtained, using the intensity of the potentiometric signals as inputs. On the other hand, colour of honey was evaluated with computer vision technique. In particular, according to the percentage abundance of the colours extracted from the images of the different honey varieties, the following graphs were obtained (Figure ).
Figure 1. Spider chart obtained with the intensity of the E-tongue’ potentiometric sensors (Colour). (Colour online.)
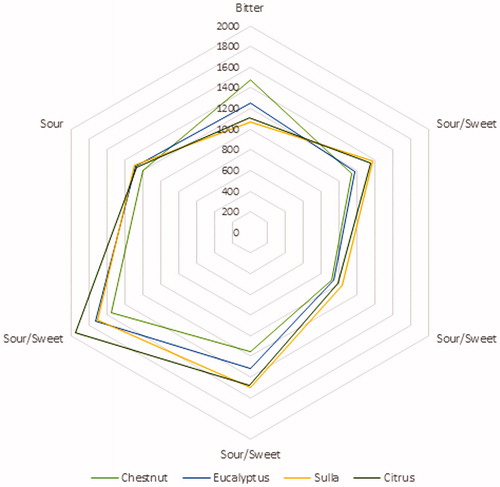
Figure 2. Graphs showing the percentage abundance of the extracted colours within (a) Chestnut honeys, (b) Eucalyptus honeys, (c) Sulla honeys and (d) Citrus honeys (Colour). (Colour online.)
Mineral composition
The levels of macro- and micro-minerals in honey are related to the floral source and there can be large variations among honeys from different origins. In addition, the mineral content is an important indicator of the geographical origin of honey and the types of plants and soil have a major influence on the mineral composition (Alda-Garcilope et al. Citation2012; Chua et al. Citation2012; Di Bella et al. 2012; Boussaid et al. Citation2018). shows the results obtained for the different honey varieties.
Table 5. Minerals content.
Discussion
According to the obtained results for the physicochemical parameters, Chestnut honeys had the lowest sugars content, with a fructose and glucose sum of 62.31 g/100g, reflecting its characteristic bitter taste. Citrus and Eucalyptus honeys showed the highest fructose content (38.08 and 38.04 g/100g), while Citrus and Sulla honeys had the highest sucrose content (3.16 and 3.92 g/100g). The highest fructose to glucose ratio was 1.59, found for Chestnut honeys, which usually may remain liquid for several months, due to the slow crystallization process. Chestnut honeys had also the highest pH-value (4.98), correlated to its great potassium amount (Table ) and explained with the buffering action of the inorganic cation constituents (White Citation1962). Alongside the determination of physicochemical properties and artificial sensory analyses, data provided from the different instruments were ‘fused’ together, in order to achieve a more complex characterisation of the honey samples. E-tongue’ sensors are capable to measure the potential difference between the sample aqueous solution and a reference electrode. Moreover, the electric potential is related to the activity of the ionic species in the solution itself and it is formed in the ion-sensitive membrane of the sensors, where selective complexation (ion recognition) of the analyte molecules occurs. Honey proprieties, such as pH and electrical conductivity, often used to recognise samples with different botanical origins, depends on the ionic composition and are related to the potential measured. For this reason, several authors have been able to use electrochemical E-tongues to identify different honey varieties (Di Rosa et al. Citation2018). In this article, glucose and fructose content, as well as pH, which is the main responsibility for sweetness, bitterness and sourness of the honey, were correlated to the potentiometric signals provided from the E-tongue. Once established which sensor is able to perceive a specific taste attribute, the spider chart in Figure was obtained. As can be seen, the Chestnut honeys scored the lowest values for the sweet and sour tastes, being the bitterest among the samples evaluated. On the other hand, Sulla and Citrus honeys were the sweetest and the sourest, while the Eucalyptus honeys showed intermediate basic tastes. This result, obtained without the need for trained experts, is consistent with the previous literature (Piana et al. Citation2004). Besides flavour and aroma, colour of honey is one of the sensory properties perceived by the consumers, which could determine whether they will buy the product or not (Oroian and Ropciuc Citation2017). In addition, the visual investigation of honey may help to evaluate its botanical origin, the degree of thermal treatments and the presence of defects (Doner Citation2003). In general, honey colour may range from very pale yellow, through amber to nearly black, and it is well-known the existence of a positive correlation with the ash content and the electrical conductivity (Terrab et al. Citation2004; Gonzalez-Miret et al. Citation2005). Interestingly, a correlation between the colour of honey and its total phenolic content and antioxidant activity has been found (Bertoncelj et al. Citation2007; Kus et al. Citation2014; Nayik and Nanda Citation2016c; Nayik et al. Citation2016). A panel of trained experts can perform the visual colour evaluation of honey, using preselected attributes or charts (Piana et al. Citation2004). However, this approach is characterised by a high degree of subjectivity (Tuberoso et al. Citation2014). In the present work, the colour evaluation of honey has been carried out using computer vision. Figure shows the representative colours of the different honey varieties. The colour of Chestnut honeys is amber, more or less dark, with a mild reddish tinge. Eucalyptus honeys have a grey-brown colour. The brightest are Sulla and Citrus honeys, almost colourless to pale yellow and white to cream or ivory, with green components. This observation is in agreement with previous works in the literature (Oroian and Ropciuc Citation2017; Gonzalez-Miret et al. Citation2005; Bertoncelj et al. Citation2007; Tuberoso et al. Citation2014; Nayik and Nanda Citation2016c) and the used approach may be very helpful for human panellists when judging honey colour. In fact, images can be acquired with a smartphone and their processing lasts a few seconds, offering a simplified visual examination, compared to raw samples. Moreover, quantitative information, such as the abundance percentage of each colour as well as the CIE L*a*b* coordinates, can be quickly calculated. The levels of major and minor elements was determined via ICP-MS. In agreement with the previous literature, K is the most abundant element in honey and the highest values were found for Chestnut and Eucalyptus honey (4.412 and 1.956 mg/g). The same trend was observed for Mg and Mn (Silva et al. Citation2009; Fernàndez-Torres et al. Citation2005; Gonzàlez-Miret et al. Citation2005; Terrab et al. Citation2003; Conti Citation2000; Di Bella et al. Citation2015). Among the micro-minerals, Zn showed the highest concentration, ranging from 4.64 to 7.16 µg/g, but was not predominant in any type of honey. This result is inconsistent with previous works in the literature, which have found higher levels of Fe rather than Zn (Conti Citation2000; Nanda et al. Citation2003). Anyway, the results comparison with bibliographic references is complex because honey mineral composition reflects not only the botanical differences, but also the environmental conditions and the geology of the production areas (Fernandez-Torres et al. 2005; Pisani et al. Citation2008; Di Bella et al. 2012). Another difference with most of the studies in the literature was the high concentration of Ca, ranging from 0.073 to 0.127 mg/g, which is comparable, if not greater, than Na (0.068–0.203 mg/g) that is usually considered the second most important element of honey from a quantitative point of view (Silva et al. Citation2009; Gonzàlez-Miret et al. Citation2005; Terrab et al. Citation2004; Nanda et al. Citation2003; Conti Citation2000). On the other hand, present results are consistent with the studies of Fernàndez-Torres et al. (Citation2005) on Spanish honeys and Di Bella et al. (2012) on Sicilian honeys. In addition, the relationship between colour and mineral content was also investigated, in order to understand which mineral from those present in honey allows the prediction for the different colour parameters (Gonzalez-Miret et al. Citation2005). The abundance of the colours extracted from the different honey variety images (Figure ) and the concentration of the different elements were used as variables for the Pearson’s correlation (Table S3). According to Gonzalez-Miret et al. (Citation2005), coefficients between 0.5 and 0.8 (‘moderate’ correlation) were considered. Table resumes the obtained results, specifying the appearance, as well as the R, G and B amounts, for each colour extracted. As can be seen, the colours 2403, 2948, 2966 and 3472, which were found only in Chestnut and Eucalyptus honeys were correlated to Na and microelements (Zn and Mn). On the other hand, the colour 4057, found in Eucalyptus, Sulla and Citrus honeys, but not in Chestnut honeys, showed a negative correlation with K and Mg.
Table 6. Relationship between colour and mineral content.
Conclusions
The aim of the present work was to perform a comprehensive assessment of Sicilian honeys. Present results, compared with those obtained from the other honeys coming from the Mediterranean area, as well as with the normative requirements, showed the high quality of Sicilian honeys. In agreement to the Council Directive 2001/110/CE of 20 December 2001, the samples presented a sucrose content lower than 5% and a fructose + glucose content higher than 60%. Moreover, the pH values ranged from 3.67 to 4.98. From the combination of these parameters with the potentiometric signals provided by the E-tongue, a human-like taste evaluation was carried out artificially as an innovative approach. Furthermore, colour of honey was studied with computer vision, which allows to extract the colour palette that is characteristic for each honey variety, resulting in a helpful tool for the human panellists to judge honey colour. In fact, images can be acquired with a smartphone and their processing lasts a few seconds, offering a simplified visual examination, compared to raw samples.
Ethical approval
All research reported in submitted papers has been conducted in an ethical and responsible manner, and is in full compliance with all relevant codes of experimentation and legislation.
Disclosure statement
No potential conflict of interest was reported by the authors.
Additional information
Funding
References
- Adenekan MO, Amusa NA, Okpeze VE, Owosibo AO. 2012. Nutritional and microbiological components of honey samples obtained from Ogun State, southwestern Nigeria. Eur J Sustain Dev. 1:271–286.
- Alda-Garcilope C, Gallego-Picó A, Bravo-Yagüe JC, Garcinuño-Martínez RM, Fernández-Hernando P. 2012. Characterization of Spanish honeys with protected designation of origin ‘‘Miel de Granada” according to their mineral content. Food Chem. 135:1785–1788.
- Attanzio A, Tesoriere L, Allegra M, Livrea MA. 2016. Monofloral honeys by Sicilian black honeybee (Apis mellifera ssp. sicula) have high reducing power and antioxidant capacity. Helyon. 2:1–18.
- Bertoncelj J, Dobersek U, Jamnik M, Golob T. 2007. Evaluation of the phenolic content, antioxidant activity and colour of Slovenian honey. Food Chem. 105:822–828.
- Bogdanov S. 2002. Harmonised Methods of the International Honey Commission. Bern, Swtitzerland: Swiss Bee Research Centre.
- Bogdanov S, Ruoff K, Persano Oddo L. 2004. Physicochemical methods for the characterization of unifloral honeys – A review. Apidologie. 35:S4–S17.
- Borras E, Ferré J, Boqué R, Mestres M, Acena L, Busto O. 2015. Data fusion methodologies for food and beverage authentication and quality assessment – A review. Anal Chim Acta. 891:1–14.
- Bougrini M, Tahri K, Saidi T, El Alami El Hassani N, Bouchikhi B, El Bari N. 2016. Classification of honey according to geographical and botanical origins and detection of its adulteration using voltammetric electronic tongue. Food Anal Met. 9:2161–2173.
- Boussaid A, Chouaibi M, Rezig L, Hellal R, Donsì F, Ferrari G, Hamdi S. 2018. Physicochemical and bioactive properties of six honey samples from various floral origins from Tunisia. Arab J Chem. 11:265–274.
- Buba F, Gidado A, Shugaba A. 2013. Analyses of biochemical composition of honey samples from north-east Nigeria. Biochem Anal Biochem. 2:2–7.
- Chua LS, Abdul-Rahaman NL, Sarmidi MR, Aziz R. 2012. Multi-elemental composition and physical properties of honey samples from Malaysia. Food Chem. 135:880–887.
- Conti ME. 2000. Lazio region (central Italy) honeys - A survey of mineral content and typical quality parameters. Food Control. 11:459–463.
- Day WHE, Edelsbrunner H. 1984. Efficient algorithm of agglomerative hierarchical clustering methods. J Classification. 1:7–24.
- Di Bella G, Lo Turco V, Potortì AG, Bua GD, Fede MR, Dugo G. 2015. Geographical discrimination of Italian honey by multi-element analyses with a chemometric approach. J Food Comp Anal. 44:25–35.
- Di Rosa AR, Leone F, Cheli F, Chiofalo V. 2017. Fusion of electronic nose, electronic tongue and computer vision for animal source food authentication and quality assessment – A review. J Food Eng. 210:62–75.
- Di Rosa AR, Leone F. 2018. Handbook of Research on Electronic Noses and Odor Sensing Technology. Hershey, PA: IGI Global. Chapter 8, Application of electronic nose systems on animal source food – An overview; p. 151–174.
- Di Rosa AR, Leone F, Scattareggia C, Chiofalo V. 2018. Botanical origin identification of Sicilian honeys based on artificial senses and multi-sensor data fusion. Eur Food Res Tech. 244:117–125.
- Dias LG, Veloso ACA, Sousa MEBC, Estevinho L, Machado AASC, Peres AM. 2015. A novel approach for honey pollen profile assessment using an electronic tongue and chemometric tools. Anal Chim Acta. 900:36–45.
- Doner LW. 2003. Encyclopedia of food sciences and nutrition. Oxford, UK: Academic Press. Honey.
- Dymerski T, Gębicki J, Wardencki W, Namieśnik J. 2014. Application of an electronic nose instrument to fast classification of Polish honey types. Sensors (Basel). 14:10709–10724.
- El Hassani NEA, Tahri K, Llobet E, Bouchikhi B, Errachid A, Zine N, El Bari N. 2018. Emerging approach for analytical characterization and geographical classification of Moroccan and French honeys by means of a voltammetric electronic tongue. Food Chem. 243:36–42.
- Escuredo O, Dobre I, Fernandez-Gonzalez M, Seijo MC. 2014. Contribution of botanical origin and sugar composition of honeys on the crystallization phenomenon. Food Chem. 149:84–90.
- Fernàndez-Torres R, Pèrez-Bernal JL, Bello-Lòpez MA, Callejòn-Mochòn M, Jimènez-Sànchez JC, Guiraùm-Pèrez A. 2005. Mineral content and botanical origin of Spanish honeys. Talanta. 65:686–691.
- Gan Z, Yang Y, Li J, Wen X, Zhu M, Jiang Y, Ni Y. 2016. Using sensor and spectral analysis to classify botanical origin and determine adulteration of raw honey. J Food Eng. 178:151–158.
- Gonzàlez-Miret ML, Terrab A, Hernanz D, Fernàndez-Recamales MA, Heredia FJ. 2005. Multivariate correlation between color and mineral composition of honeys and by their botanical origin. J Agr Food Chem. 53:2574–2580.
- Ha D, Sun Q, Su K, Wan H, Li H, Xu N, Sun F, Zhuang L, Hu N, Wang P. 2015. Recent achievements in electronic tongue and bioelectronic tongue as taste sensors. Sens Actuators B Chem. 207:1136–1146.
- Huang L, Liu H, Zhang B, Wu D. 2015. Application of electronic nose with multivariate analysis and sensor selection for botanical origin identification and quality determination of honey. Food Bioprocess Technol. 8:359–370.
- Kuś PM, Congiu F, Teper D, Sroka Z, Jerković I, Tuberoso CIG. 2014. Antioxidant activity, color characteristics, total phenol content and general HPLC fingerprints of six Polish unifloral honey types. LWT– Food Sci Technol. 55:124–130.
- Leon K, Mery D, Pedreschi F, Leon J. 2006. Color measurement in L*a*b* units from RGB digital images. Food Res Int. 39:1084–1091.
- Marcazzan GL, Mucignat-Caretta C, Marchese CM, Piana ML. 2017. A review of methods for honey sensory analyses. J Apic Res. 1:14.
- Nanda V, Sarkar BC, Sharma HK, Bawa AS. 2003. Physicochemical properties and estimation of mineral content in honeys produced from different plants in Northern India. J Food Comp Anal. 16:613–619.
- Nayik GA, Shah TR, Muzaffar K, Wani SA, Gull A, Majid I, Bhat FM. 2014. Honey: its history and religious significance: a review. Univ J Pharm. 3:5–8.
- Nayik GA, Nanda V. 2015a. Characterization of the volatile profile of unifloral honey from Kashmir Valley of India by using solid-phase microextraction and gas chromatography–mass spectrometry. Eur Food Res Tech. 240:1091–1100.
- Nayik GA, Nanda V. 2015b. Conceptual framework and innovations in agroecology and food sciences. New Delhi, India: Krishi Sanscriti Publications. Characterization of unifloral honeys from Kashmir Valley of India according to their physicochemical parameters.
- Nayik GA, Nanda V. 2015c. Physico-chemical, enzymatic, mineral and colour characterization of three different varieties of honeys from Kashmir Valley of India with a multivariate approach. Pol J Food Nutr Sci. 65:101–108.
- Nayik GA, Dar BN, Nanda V. 2015. Physico-chemical, rheological and sugar profile of different unifloral honeys from Kashmir valley of India. Arab J Chem. https://www.sciencedirect.com/science/article/pii/S1878535215002579
- Nayik GA, Nanda V. 2016a. Application of response surface methodology to study the combined effect of temperature, time and pH on antioxidant activity of cherry (Prunus avium) honey. Pol J Food Nutr Sci. 66:287–293.
- Nayik GA, Nanda V. 2016b. Effect of thermal treatment and pH on antioxidant activity of saffron honey using response surface methodology. J Food Meas Char. 10:64–70.
- Nayik GA, Nanda V. 2016c. A chemometric approach to evaluate the phenolic compounds, antioxidant activity and mineral content of different unifloral honey types from Kashmir, India. LWT – Food Sci Tech. 74:504–513.
- Nayik GA, Dar BN, Nanda V. 2016. Optimization of the process parameters to establish the quality attributes of DPPH radical scavenging activity, total phenolic content and total flavonoid content of apple (Malus domestica) honey using response surface methodology. Int J Food Prop. 19:1738–1748.
- Nayik GA, Dar BN, Nanda V. 2018. Rheological behavior of high altitude Indian honey varieties as affected by temperature. J Saudi Soc Agr Sci. 17:323–329.
- Oroian M, Ropciuc S. 2017. Honey authentication based on physicochemical parameters and phenolic compounds. Comp Electron Agr. 138:148–156.
- Oroian M, Paduret S, Ropciuc S. 2018. Honey adulteration detection: voltammetric e‐tongue versus official methods for physicochemical parameter determination. J Food Sci Agr. 98:4304–4311.
- Perna A, Simonetti A, Intaglietta I, Sofo A, Gambacorta E. 2012. Metal content of southern Italy honey of different botanical origins and its correlation with polyphenol content and antioxidant activity. Int J Food Sci Technol. 47:1909–1917.
- Piana ML, Persano Oddo L, Bentabol A, Bruneau E, Bogdanov S, Guyot Declerck C. 2004. Sensory analyses applied to honey: state of the art. Apidologie. 35:S26–S37.
- Pisani A, Protano G, Riccobono F. 2008. Minor and trace elements in different honey types produced in Siena County (Italy). Food Chem. 107:1553–1560.
- Saitta M, Di Bella G, Fede MR, Lo Turco V, Potortì AG, Rando R, Russo MT, Dugo G. 2017. Gas chromatography-tandem mass spectrometry multi-residual analyses of contaminants in Italian honey samples. Food Addit Contam Part A. 34:1–808.
- Silva LR, Videira R, Monteiro AP, Valentao P, Andrade PB. 2009. Honey from Luso region (Portugal): physicochemical characteristics and mineral contents. Microchem J. 93:73–77.
- Śliwińska M, Wiśniewska P, Dymerski T, Namieśnik J, Wardencki W. 2014. Food analysis using artificial senses. J Agric Food Chem. 62:1423–1448.
- Solayman M, Islam MA, Paul S, Ali Y, Khalil MI, Alam N, Gan SH. 2016. Physicochemical properties, minerals, trace elements, and heavy metals in honey of different origins - A comprehensive review. Compr Rev Food Sci Food Saf. 15:219–233.
- Sousa MEBC, Dias LG, Veloso ACA, Estevinho L, Peres AM, Machado AASC. 2014. Practical procedure for discriminating monofloral honey with a broad pollen profile variability using an electronic tongue. Talanta. 128:284–292.
- Terrab A, González AG, Díez MJ, Heredia FJ. 2003. Mineral content and electrical conductivity of the honeys produced in Northwest Morocco and their contribution to the characterization of unifloral honeys. J Sci Food Agr. 83:637–643.
- Terrab A, Recamales AF, Hernanz D, Heredia FJ. 2004. Characterization of Spanish thyme honeys by their physico-chemical characteristics and mineral contents. Food Chem. 88:537–542.
- Timmermans AJM, Hulzebosch AA. 1996. Computer vision system for on-line sorting of pot plants using an artificial neural network classifier. Comp Electron Agr. 15:41–55.
- Tretola M, Di Rosa AR, Tirloni E, Ottoboni M, Giromini C, Leone F, Bernardi CEM, Dell'Orto V, Chiofalo V, Pinotti L. 2017a. Former food products safety: microbiological quality and computer vision evaluation of packaging remnants contamination. Food Add Cont A. 34:1427–1435.
- Tretola M, Ottoboni M, Di Rosa AR, Giromini C, Fusi E, Rebucci R, Leone F, Dell’Orto V, Chiofalo V, Pinotti L. 2017b. Former food products safety evaluation: computer vision as an innovative approach for the packaging remnants detection. J Food Qual. 2017:1–6.
- Tuberoso CIG, Jerkovic I, Sarais G, Congiu F, Marijanovic Z, Kus PM. 2014. Color evaluation of seventeen European unifloral honey types by means of spectrophotometrically determined CIE L∗Cab∗hab∘ chromaticity coordinates. Food Chem. 145:284–291.
- White JW. 1962. Composition of American Honeys. US Department of Agriculture. US Government Printing Office, Washington 25, D.C.
- Zabrodska B, Vorlova L. 2014. Adulteration of honey and available methods for detection – A review. Acta Vet. 83:S85–S102.
- Zakaria A, Shakaff AYM, Masnan MJ, Ahmad MN, Adom AH, Jaafar MN, Ghani SA, Abdullah AH, Aziz AHA, Kamarudin LM, et al. 2011. A biomimetic sensor for the classification of honeys of different floral origin and the detection of adulteration. Sensors (Basel). 11:7799–7822.
- Zumbo A, Casella S, Di Rosa A, Scianò S, Fazio F, Piccione G. 2010. Levels of serum osteocalcin and some electrolytes in foal during the first six months of life (brief report). Arch Anim Breed. 53:239–241.