
Abstract
Authentication of dairy systems is of growing interest for the dairy industry and we investigated the potentiality of using volatile fingerprinting of ripened cheeses by proton transfer reaction time-of-flight mass spectrometry. A total of 1,075 individual model cheeses made from milk of individual Brown Swiss cows of 72 farms were analysed. Using a linear discriminant analysis, cows and herds were assigned to 3 or 5 dairy systems differing in management, available facilities, and diets. We obtained variable discrimination abilities (up to 77% of correct classification of cheeses and 70% of farms with cross-validation). We found m/z 61,028 (acetic acid), 109,070 (pyrazine), and m/z 137,132 (terpene) characterising model cheeses from traditional dairy systems and m/z 71,086 (3-methyl-butan-1-ol, 3-methyl-3-buten-1-ol, pentan-1-ol), m/z 101,097 (hexan-2-one, hexanal), m/z 123,117 (nonenal), m/z 129,127 (octan-1-one, octanal), and two unidentified peaks m/z 83,071 and m/z 93,090 characterising model cheeses from the modern farms. In conclusion, it seems possible to discriminate between a range of dairy systems using fast volatile fingerprinting of ripened cheeses but a proper validation of results obtained is needed.
Mass spectrometry technique (PTR-ToF-MS) was able to discriminate between dairy systems.
We found m/z 61,028 (acetic acid), 109,070 (pyrazine), and m/z 137,132 (terpene) characterising model cheeses from traditional dairy systems.
We found m/z 71,086 (3-methyl-butan-1-ol, 3-methyl-3-buten-1-ol, pentan-1-ol), m/z 101,097 (hexan-2-one, hexanal), m/z 123,117 (nonenal), m/z 129,127 (octan-1-one, octanal), and two unidentified peaks m/z 83,071 and m/z 93,090 characterising model cheeses from the modern farms.
Highlights
Introduction
In the current global market, the dairy sector may adopt a strategy of production differentiation to increase their income. For example, in Europe, mountain farms can compete with farms on the plains, which have lower production costs, if their final products meet consumers’ particular expectations. Some cheeses have specific nutritional and sensory properties (Carpino et al. Citation2004; Revello Chion et al. Citation2010; Bittante et al. Citation2011), and many of these are classified according to their area of production (Martin et al. Citation2006). Protected designation of origin (PDO) and protected geographical indication (PGI) are European Union certifications with specific protocols designating cheeses manufactured in specific areas often with high production costs. They specify not only geographical origin, but also the dairy system and manufacturing procedure. In addition, advanced techniques of authentication are needed if consumers are to be assured of the quality and authenticity of certified products, and to this end several researchers are developing analytical methods for discriminating dairy products and classifying them on the basis of their fatty acid compositions (Coppa et al. Citation2013), carotenoids (Slots et al. Citation2009; Stergiadis et al. Citation2012), and stable isotopes in milk (Renou et al. Citation2004; Ehtesham et al. Citation2013). Some studies have also suggested authenticating pasture-derived milk and cheese using plant biomarkers, like terpenes content (Tornambé et al. Citation2006). Among the various analytical methods used to authenticate dairy products by volatile fingerprinting, gas chromatograph provides precise information on the composition and biochemistry of volatile compounds released by cheeses. Although this method is accurate and yields detailed information on the volatile profile of samples (Carbonell et al. Citation2002), it is time-consuming and expensive, hence unsuitable for monitoring cheese production on a large scale. There is, therefore, an urgent need for fast, inexpensive, efficient analytical quality control methods. Proton transfer reaction time-of-flight mass spectrometry (PTR-ToF-MS) has been used to characterise the flavour profile of three certified grana cheeses (Boscaini et al. Citation2003), to investigate the link between the volatile fingerprint and the sensory characterisation of ‘Trentingrana’ cheese (Biasioli et al. Citation2006), to monitor volatile organic compounds (VOC) release during cheese ripening (Fabris et al. Citation2010), and to identify the geographical area and specific characteristics of protected origin cheese (Galle et al. Citation2011). More recently, we used PTR-ToF-MS to study the effect of dairy system, individual sources of variation (e.g. lactation stage and parity), and genetics on the volatile fingerprint of model cheeses (Bergamaschi, Aprea et al. Citation2015; Bergamaschi et al. Citation2016). Results showed that dairy system of origin of the milk processed was an important source of variation on about 23% of the spectrometric peaks characterising the volatile profile of ripened cheeses.
In light of this, we hypothesise that the spectrometric peaks characterising the volatile profile of ripened cheese can be used for the authentication of the origin of milk. The aims of this work, therefore, were: (i) to investigate the potential of volatile fingerprinting of ripened model cheeses by PTR-ToF-MS to authenticate different dairy systems of origin of milk, and (ii) to identify the most important volatile organic compounds of use in discriminating between model cheeses from different dairy systems.
Materials and methods
Experimental design and dairy systems
This study is based on the data of Cowability-Cowplus projects which were analysed and discussed in previous studies (Bergamaschi, Biasioli, et al., Citation2015; Bergamaschi Citation2016).
Milk samples were obtained once during the evening milking from 1,075 Brown Swiss cows reared in 72 herds located in northern Italy (15 cows sampled per herd). Cows and farms were selected to cover a wide range of milk production conditions, parities, and days in milk. To authenticate the dairy systems, the herds were classified into 5 main dairy systems according to housing type, management system, presence of automated feeders, use of total mixed rations, and whether or not silages (mainly corn silage) were used, as shown in Table . Details of the clustering of farms and the cows’ feeding regimes are given in a previous publication (Bergamaschi, Biasioli, et al. Citation2015). In brief, the first and second dairy systems comprised cows reared in herds in traditional dairy systems: small barns, tied animals milked at the stall, moderate milk yields, and diets composed mainly of hay, representing on average 61% of the dry matter (DM) of rations. The two dairy systems differed according to whether or not automatic feeders were used to distribute the compound feed (18% of DM) at the stall. The third dairy system (modern system no TMR) comprised animals kept loose in larger, modern facilities with milking parlours, and with feedstuffs distributed in the mangers separately. The fourth and fifth dairy systems were modern farms using total mixed rations (TMR), without or with corn silage, respectively. The diet of TMR without silage consisted of hay at approximately 39% of DM and concentrates at 46%, while the diet of TMR with silage consisted of hay at approximately 22% of DM and silages at 15% of DM. In order to devise suitable strategies for authenticating dairy systems, the 5 original groups were merged into 3. Because of the similarity in the composition of diets the 5 dairy systems were also pooled in three dairy systems. In fact, the two groups of traditional herds (with and without automatic feeders) were also pooled into one group, and the same was done for the third (modern, no TMR) and fourth (TMR, no silage) dairy systems so that the farms were classified in the following three dairy systems: traditional, modern no silage, and modern silage.
Table 1. Descriptive statistics (SD between brackets) of productive traits, and milk and cheese composition of sampled cows according to different dairy systems.
Milk sampling and cheese making
Details of the cheese making, and milk and cheese sampling and analysis can be found in a previous study (Cipolat-Gotet et al. Citation2013). The procedures for sampling, refrigeration, transport and storage of milk samples were standardised in order to minimise differences due to transportation and processing of milk and to ripening conditions of model cheeses. Moreover, sampling of herds within each dairy system was distributed year around to avoid association of season and dairy system effects. Briefly, all milk samples were refrigerated at 4 °C without preservatives immediately after collection, and analysed and processed into cheeses within 20 h at the cheese-making laboratory of the Department of Agronomy, Food, Natural Resources, Animals and Environment of the University of Padova (Legnaro, Padova, Italy). Model cheeses were manufactured from 1,500 mL of raw milk per cow, using a standardised procedure in the same lab from the same technicians. As dairy system affect also native milk microbiota, milk samples were not pasteurised before cheese-making. Milk was heated (35 °C), cultured with a thermophilic starter inoculum and then mixed with rennet solution to a final concentration of 51.2 international milk-clotting units per litre of milk. The resulting curd was cut, drained, pressed, salted, and weighed. The small wheels were then ripened, without any addition of ripening microorganisms on the rind, for 60 d at 85% relative humidity and a temperature of 15° C, during the first 30 d, and 12° C, during the following 30 d. Then the model cheeses were analysed for physical-chemical composition. A cylindrical sample (1.1 cm in diameter and about 3.5 cm in height) was taken from the centre of each cheese and kept at –80 °C until PTR-ToF-MS analysis.
Milk and cheese composition
Briefly, fat and protein contents of the milk were analysed using a MilkoScan FT6000 apparatus (Foss Electric A/S, Hillerød, Denmark). Somatic cell count was obtained with a Fossomatic FC counter (Foss) and transformed to SCS by base-2 logarithm. Milk pH was measured using a Crison Basic 25 electrode (Crison, Barcelona, Spain). The fat and protein contents of the whole cheeses were measured using a FoodScan apparatus (Foss), and pH was measured at 20 °C by inserting a penetrometric glass electrode (Crison) into each cheese. Descriptive statistics of milk and cheese composition traits are shown in Table .
Volatile organic compound fingerprinting
A cylindrical sample 1.1 cm in diameter and about 3.5 cm in height was taken from the centre of each model cheese and conserved at −80 °C until VOC analysis Bergamaschi, Aprea, et al. Citation2015). PTR-ToF-MS analysis was performed as described by Fabris et al. (Citation2010) and Bergamaschi, Biasioli, et al. (Citation2015). Briefly, 3 g sub-samples of each cheese sample were thawed then placed into glass vials (20 mL, Supelco, Bellefonte, USA), capped with PTFE/Silicone septa (Supelco), and measured using a PTR-ToF-MS 8000 instrument (Ionicon Analytik GmbH, Innsbruck, Austria). The conditions in the drift tube of the PTR were as follows: temperature 110 °C, drift pressure 211 Pa, drift voltage 500 V. Internal calibration and spectrometric peak extraction were performed according to the procedures described by Cappellin et al. (Citation2010) and Cappellin et al. (Citation2012). Headspace VOC concentrations expressed as parts per billion by volume were estimated using the method described in Lindinger et al. (Citation1998). The 240 greatest spectrometric peaks characterising the volatile profile of each model cheese were standardised within each day of analysis (15d, about 75 samples analysed per day) to equalise data variability resulting from the effect of this environmental factor on proton transfer reaction masses; this was also confirmed by a Levene’s test (data not shown) and analysed according to the procedure described in detail by (Bergamaschi, Biasioli, et al. Citation2015). Some highly-correlated peaks (r > 0.95; p < .001) corresponding to isotopes of the same volatile organic compounds were removed from the dataset before the statistical analyses. More details on the analytical procedure and on sources of variation and repeatability of cheese VOCs analysed by PTR-ToF-MS are available on Fabris et al. (Citation2010) and Cappellin et al. (Citation2012). To help the identification of the major VOCs obtained from PTR-ToF-MS, the results obtained on a subsample of herds (30 out of 73) and model cheeses (150 out of 1075, 5 per herd) using SPME-GC-MS have been also used (Bergamaschi, Aprea, et al. Citation2015).
Statistical analysis and model validation
Two datasets were created, the first (Cow-All) comprising the VOC fingerprints of all the individual cows/model cheeses analysed (1,075 samples), the second (Herd-All) comprising the averages of the VOC fingerprints of all the model cheeses obtained from each herd (72 herds). The average of the volatile organic compounds of 15 model cheeses from individual cows of the same herd can, of course, only be considered a proxy for the fingerprint of a model cheese made with bulk milk from the same herd. A linear discriminant analysis (LDA) of the Cow-All and Herd-All datasets was carried out with the R software (MASS package) to determine which combination of spectrometric peaks made the greatest contribution to the differences in the volatile fingerprints of the various dairy systems. The LDA is often used for food authentication but a proper validation is needed to avoid overfitting (Granato et al. Citation2018; Jiménez-Carvelo et al. Citation2019). For these purposes, we created a group of 3 dairy systems and a group of 5, as described above, for the Cow-All and Herd-All datasets. A 10-fold cross-validation procedure was used to estimate the discriminatory capability of the LDA to authenticate the dairy systems. Data of each dataset were divided randomly into 2 sub-sets: a calibration set (Cow-Cal, Herd-Cal; approximately 75% of the data), which was used to calibrate the model, and a validation set (Cow-Val, Herd-Cal) comprising the remaining data (25% of the data), which was used for cross-validation. This process was repeated 10 times, each time using a different sub-set as the validation set. The number of samples used for the LDA is reported in Table . Given that we had two sources of information (VOC fingerprints of cheeses from individual cows, and from each herd averaged), 2 sets of dairy systems to discriminate (3 or 5 dairy systems), and 3 combinations of sub-datasets used for calibrating and validating the linear discriminant functions (All-All, Cal-Cal, and Cal-Val for both the Cow and the Herd datasets), a total of 12 discriminant analyses were carried out. In addition, the LD functions for individual model cheeses (Cow-Cal) were applied to discriminate herd averages (Herd-Val), and, vice versa, the LD herd functions (from Herd-Cal) were applied to individual model cheeses (Cow-Val), so that discriminatory power was calculated on 16 LDA analyses.
Results
Classification of dairy systems of origin of milk according to LDA based on cheese volatile fingerprints
The results regarding the discriminatory capability of the volatile profile according to the various LDA models are shown in Table . Without cross-validation, the volatile profile of all model cheeses allowed us to correctly discriminate 73% of the 1,075 samples when divided into 5 dairy systems and 82% when divided into 3 dairy systems (Table ). When the same analysis was carried out on a smaller dataset (Cow-Cal, 860 model cheeses) the discriminatory power of the LDA was, as expected, about the same. In both cases, discrimination between the cheeses made from milk from cows reared in modern dairy farms without the use of silages was slightly better than between the cheeses from the other dairy systems, but when we divided the former group into two sub-groups (No TMR and TMR without silage), the discriminatory power of both of these was weaker. As these models can be overfitted by the absence of an external validation, models based on cross-validation (Cow-Cal for calibration and Cow-Val for validation) were run and they correctly classified a smaller number of model cheeses: only 48% from the 5 dairy systems, and 66% of the cheeses from the 3 dairy systems. Only about one third of cheeses produced from the milk of cows on modern farms using TMR with silage were correctly classified.
Table 2. Correct classification (% average of 10-fold cross-validation) of the linear discriminant analysis (LDA) based on volatile organic compounds of cheeses measured by PTR-ToF-MS to authenticate the dairy systems.
Moving to the LDA of the dataset comprising the average VOC profiles of the herds, overall discriminatory power was better than that of the ‘cow models’ when Herd-All or Herd-Cal were used for both training and testing, but much worse when Herd-Cal functions were applied to the Herd-Val sub-dataset (). The details of the comparisons among the correct classifications obtained for the individual dairy systems do not, in this case, have much value given the small number of herds in each group, particularly for cross-validation.
However, when we applied the LD functions on the individual model cheeses (Cow-Cal) to classify the herds in the validation sub-dataset (Herd-Val), we obtained the highest discriminatory powers, with 95% of the herds from the 5 dairy systems and 90% of those from the 3 dairy systems correctly classified (). The reverse (Herd-Cal for discriminating Cow-Val) was much less favourable.
Linear discrimination functions
As can be seen from Table , the relative importance (in terms of variance explained) of the two LD functions yielded by the LDA when discriminating 3 dairy systems are very similar across 5 of the 6 analyses carried out, with the first LD (LD1) varying from 63.2% to 58.1%, and LD2 varying from 36.8% to 41.9%. In our attempt to discriminate between the 5 dairy systems, again 5 of the 6 LDAs yielded 4 LD functions with very similar levels of relative importance across the different LDAs (, LD1: 35.8–40.9%; LD2: 24.5–32.9%; LD3: 17.2–22.6%; LD4: 14.1–16.4%). Only the last LDA (Herd-Cal Herd-Val) yielded a very important LD1 (78.6% of variance explained in the 3 dairy systems, 78.5% in the 5 dairy systems), while the other LD of the 3 systems (21.4% of variability explained) and the three other LDs of the 5 systems (8.3, 7.0 and 3.8%) were much less important. It should be borne in mind that this LDA model yielded a high percentage of misclassified samples, especially in discriminating between the 5 dairy systems ().
Table 3. Variance explained by each linear discriminant function (LD) of the 12 analyses (LDA) according 3 or 5 dairy systems.
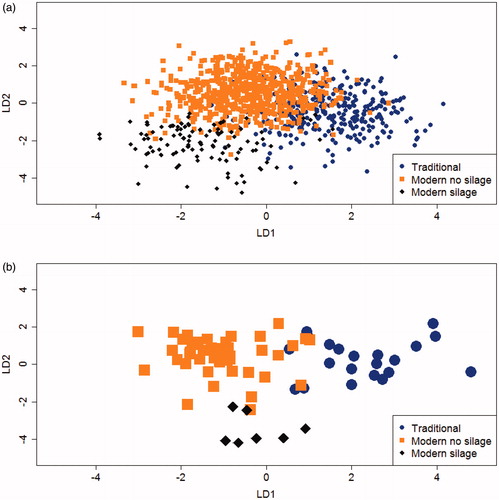
Discrimination of dairy systems of origin of milk is, of course, always based on the combined information contained in all the LD functions obtained (2 LDs when 3 dairy systems are to be discriminated, 4 LDs when 5). Nevertheless, it can be seen from Figure that the LD1 obtained from the volatile fingerprint of individual model cheeses when 3 dairy systems are to be discriminated is better at distinguishing the model cheeses obtained from cows reared on traditional farms (when LD1 score is positive) than those obtained from cows on modern farms (when negative). However, LD2 seems to be responsible (when LD1 is low) for discriminating between modern farms using silage (lower LD2 scores) and those without. The same pattern is found when the averages of the herds, rather than individual cheeses/cows, are to be discriminated ().
Figure 1. Bi-plot score of the linear discriminant functions (LD1; LD2) obtained using the full data set (All) including the 1,075 cows (a) and 72 herds (b) as observation and the spectrometric peaks that characterised the volatile profile of individual model cheeses as variables. The cows and the herd are classified in three dairy systems.
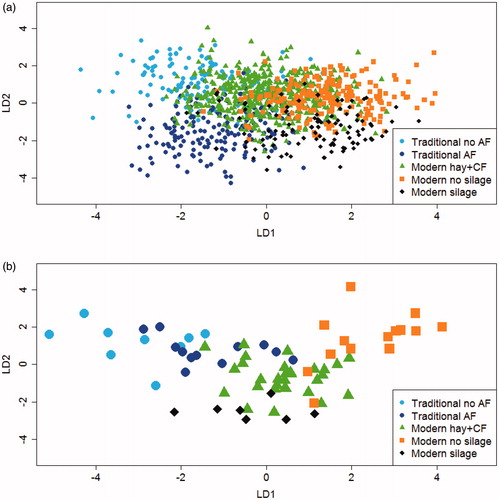
With regard to the LDA for discriminating between the 5 dairy systems of origin of milk, it is much more difficult to use graphics to identify the role of the four LD functions as only 2 of the 4 LDs can be fully represented on a plane, while a 3 D figure that cannot be rotated can give only a partial visualisation of the role of 3 LDs (see Figure for individual model cheeses, and Figure for herd averages). Given that in every case the first two LDs represent at least 60% of total variance, we focussed on LD1 and LD2 in the LDA of the 5 dairy systems. It is evident from the plots () that in these cases, too, LD1 is mainly responsible for discriminating between traditional and modern farms, but here the sign is the reverse of the discrimination between the 3 dairy systems, as the cheeses from traditional farms have lower LD1 scores (average scores –1.27). Within the modern farms not using silage, LD1 also seems to partially discriminate between those not using TMR (average scores +0.09) and those using TMR (average scores +1.21). LD2, again, seems to discriminate, in particular, between cheeses produced from milk of cows fed on TMR with silage (average scores –1.32) and cheeses from the other modern systems (average scores +0.45), and with the same sign, as show.
Figure 2. Bi-plot score of the linear discriminant functions (LD1; LD2) obtained using the full data set (All) including the 1,075 cows (a) and 72 herds (b) as observations and the spectrometric peaks that characterised the volatile profile of individual model cheeses as variables. The cows and the herds are classified in five dairy systems. Traditional: cluster of herds composed by traditional dairy systems without and with AF (Automatic Feeders at mangers to control individually concentrate distribution); Modern no silage: cluster of herds composed by modern dairy systems with hay plus compounds feed and modern TMR (total mixed ration) no silage; Modern silage: cluster of herds that used TMR and corn silage; CF: compounds feed.
Spectrometric peaks and VOCs discriminating dairy systems
Although cheese flavour depends on the simultaneous effects and overall combination of many VOCs in relation to their different concentrations and under different environmental conditions, we have tried to identify those VOCs and spectrometric peaks (as yet chemically unspecified) which may discriminate between model cheeses obtained from different dairy systems.
Table shows the linear coefficients of the two linear functions LD1 and LD2 for the spectrometric peaks that best discriminate the model cheeses from the different dairy systems. We found that the spectrometric peaks with the potential for identification at measured mass m/z 61,028 (acetic acid, acetate ester) and m/z 137,132 (terpenes) were related to the model cheeses from traditional dairy systems, while m/z 71,086 (3-methyl-butan-1-ol, 3-methyl-3-buten-1-ol, pentan-1-ol), m/z 101,097 (hexan-2-one, hexanal), m/z 123,117 (nonenal), m/z 129,127 (octan-1-one, octanal) and two unidentified peaks at m/z 83,071 and m/z 93,090 were positively correlated with the model cheeses from modern systems. All these spectrometric peaks were higher in modern dairy systems using silage than in those not using silages (Table ). Moreover, the spectrometric peaks at measured mass m/z 87,080 (3-methylbutanal, 2-methylbutanal, pentan-2-one), m/z 97,101 (heptanal), m/z 115,112 (heptan-2-one, heptanal), and m/z 145,123 (octanoic acid) were positively related to model cheeses from modern farms not using corn silage.
Table 4. Coefficients in the linear discriminant function (LD) of the 12 analyses (LDA) and average content for the most discriminant spectrometric peaks (having coefficients >0.35) of the 1,075 model cheeses (cows) belonging to 3 and 5 dairy systemsCitationa.
Regarding the classification into 5 dairy systems, we found that m/z 61,028 (acetic acid and acetate ester) and m/z 109,070 (2,6-dimethylpyrazine) were mainly related to model cheeses from traditional dairy systems with automatic feeders, while m/z 137,132 (terpenes) was mainly correlated with traditional systems without automatic feeders. As reported above, we found the same peaks associated with model cheeses from modern dairy systems, and, interestingly, within the modern dairy systems there was a positive association between m/z 77,060 (1,2-propanediol) and modern systems without TMR. Table shows that the spectrometric peak at m/z 101,060 (2,3-pentanedione) was positively correlated with model cheeses from modern dairy systems using silage.
Discussion
Authentication of dairy systems of origin of milk using fast techniques
Several analytical techniques combined with multivariate data treatment have been used to authenticate dairy systems in which the milk is produced. For example, FAs predicted using the spectra of bulk milk measured by NIRS in combination with partial least squares discriminant analysis have been used to trace diets (hay, grass silage, maize silage, hay silage) and grazing systems (Coppa et al. Citation2012). These authors were able to differentiate between dairy systems administering diets composed mainly of maize silage and diets composed mainly of hay with a cross-validation error of 20.4%. Moreover, Valenti et al. (Citation2013) reported that MIR and NIR spectroscopy are capable of distinguishing between milk samples from systems using maize silage and systems using hay with a misclassification of 14.7% and 22.6%, respectively. Of course, the volatile fingerprint of ripened cheese depends, first of all, on the cheese-making and ripening conditions and microbial activity, and much less on the characteristics of the milk processed (McSweeney and Sousa Citation2000; Buchin et al. Citation2017). Nevertheless, in our work, we were able to differentiate dairy systems of origin of milk using the volatile profiles of model cheese measured by PTR-ToF-MS as the discriminating factor with similar efficiency to differentiation using information related to milk characteristics. These results confirm that dairy system can affect the volatile profile of cheese after ripening, and allows us to suggest that post hoc authentication of ripened cheese according to dairy system is possible. To our knowledge, PTR-ToF-MS has not previously been used to authenticate cheeses produced from milk collected in ordinary farming conditions.
Obviously, this authentication should be based on data specific for each type of cheese and dairy systems compared. Moreover, the results depend on the effectiveness of an external validation. No study the authors are aware of deals with the comparison of different strategies of validation of results. Even though in the literature classification is not always based on an external independent validation, it is clearly evident from our results that the classification based only on the calibration datasets (CowAll-CowAll, CowCal-CowCal, HerdAll-HerdAll and HerdCal-HerdCal) are all severely overfitted. This overfitting is evident observing the decrease in the incidence of the correct classification obtained using a cross-validation (CowCal-CowVal and HerdCal-HerdVal). It also worth to observe that this decrease is greater at herd level than at individual model cheese level. This could be due to the fact that crossvalidation at model cheese level does not allow a full independence of Cal and Val datasets because the model cheeses are different, but they may originate from the same herds and dates of cheese-making. At herd level, on the contrary, the full independence is guaranteed by the fact that the model cheeses of the two datasets comes from different herds and dates of cheesemaking. Lastly, and interesting observation is relative to the potential of the ‘crossed LDA’ (Table ), tested here for the first time. The use of discriminating functions obtained at individual model cheese level (CowCal) on the validation dataset at herd level (HerdVal) allowed obtaining very promising discrimination potential, whereas the reverse (HerdCal-CowVal) is not so promising. This observation worth further research to increase new knowledge on this field.
Discriminating between traditional and modern dairy systems
The literature contains many studies reporting differences in chemical compositions between milk from cows reared on pasture and milk from cows fed indoors (Martin et al. Citation2006; Couvreur et al. Citation2007; Hurtaud et al. Citation2014). Milk from cows fed on pasture has a different fatty acid composition to milk from cows fed on hay or grain, and there are differences also in the volatile profiles (Coppa et al. Citation2011), particularly in skatole, indole, toluene, and sulphur compounds (Toso et al. Citation2002; Croissant et al. Citation2007). In addition, cheeses from pasture-based systems are easily distinguishable from indoor feeding by the contents of terpenes and hydrocarbons (Buchin et al. Citation1998). In our experiment, we did not sample those parts of the herds that were moved to temporary farms on Alpine pastures during summer, and as the cows on the permanent farms are not grazed on pasture because the milk is mainly used for the production of Trentingrana, a very hard cheese (Bittante et al. Citation2011a and b), none of our model cheeses was made from milk from cows at pasture.
In general, the model cheeses from cows in traditional dairy systems were clearly distinct from the model cheeses from modern farms using TMR and more concentrates. Indeed, between these two extreme groups only 4% of cheeses were misclassified, while modern dairy systems administering hay and compound feed separately had an intermediate VOC profile. A concentrate supplement may also influence the rumen environment leading to the formation of many volatile compounds (Nagaraja Citation2012). As we reported in a previous paper (Bergamaschi, Aprea, et al. Citation2015), here were generally higher amounts of VOCs in cheeses manufactured from milk from modern dairy systems using more concentrates than in cheeses from traditional systems. On average, the modern dairy systems had higher milk yields, and cheese fat and protein contents than traditional systems. Nevertheless, we found no significant variations in cheese gross composition according to farming system (Bergamaschi, Aprea, et al. Citation2015), which means that the differences in the VOC profiles cannot be directly associated with the amounts of their main substrates (fat and protein), but rather with their compositions and native microbiota.
Discrimination between modern dairy systems without and with silage
The results of this study revealed subtle differences in the volatile profiles of modern dairy systems using TMR according to whether or not silages were used. This shows that the VOC profile is not exclusively affected by the use of TMR vs traditional feeding, but also depends on diet composition. Stefanon and Procida (Citation2004) investigated the effect of corn silage in the diet on the VOC profile of Montasio cheese. They compared three types of forage in rations with or without corn silage and observed a diet × ripening interaction with several ketones after 68, 200, and 360 d of ripening. The effect of silage has also been examined in experiments comparing cheeses obtained from milk from cows fed with corn silage or haylage (Verdier et al. Citation1995) or grass silage (Houssin et al. Citation2003). These studies found that corn silage often led to slightly firmer cheeses that panellists generally rated lower than cheeses manufactured from milk from cows fed on grass-based diets. Kalač (Citation2011) confirmed these experimental results in a review of the effects of silage on a range of sensory traits of milk.
VOCs characterising the dairy systems of origin of milk
We found several spectrometric peaks of the volatile fingerprints of ripened model cheeses measured with PTR-ToF-MS associated with different dairy systems. We can infer from comparison of the LDA results that the spectrometric peaks tentatively associated to acetic acid, pyrazines, and terpenes were higher in the model cheeses from traditional dairy systems than in the model cheeses from modern dairy systems. Consistent with our results, Carpino et al. (Citation2004) found that acetic acid made an important contribution as an odour-active compound to the aroma of Ragusano cheese derived from a fresh, herbage-based diet. Acetic acid can generally be found in most cheeses and is usually produced by the fermentation of carbohydrates or amino acids during cheese ripening (Curioni and Bosset Citation2002). It is the main compound responsible for vineyard notes, and it is well known that these intensify in cheese with increasing proportions of fresh herbage in the cows’ diet (Cornu et al. Citation2009). Another interesting result of this work is the higher terpene content associated with traditional dairy systems. These molecules are typically found in a greater amount in dicotyledons and may impart an aromatic note to dairy products (Cornu et al. Citation2001; Curioni and Bosset Citation2002; Martin et al. Citation2005). Moreover, Fernandez et al. (Citation2003) compared the terpene content of milk collected in a highland and a lowland area of France and found a link between these VOCs and geographical area of production. The differences between model cheeses from traditional and modern dairy systems were also due to 3-methyl-butan-1-ol and pentan-1-ol, confirming our previous results (Bergamaschi, Aprea, et al. Citation2015). In particular, we identified 3-methyl-butan-1-ol as the main alcohol of the volatile profile of model cheeses from modern dairy systems, although other authors have found high concentrations of this compound in other cheeses (Carbonell et al. Citation2002). 3-methyl-butan-1-ol may be formed by reduction of the aldehyde 3-methylbutanal produced from amino acid metabolism (McSweeney and Sousa Citation2000).
Among the model cheeses from modern dairy systems, those without silage had higher concentrations of VOCs derived from degradation of amino acids (enzymatic or non-enzymatic reactions), such as 3-methylbutanal and 2-methylbutanal, which give green, malty, herbaceous flavours to cheese (Curioni and Bosset Citation2002). Another property of model cheeses from modern dairy systems without silage (and with a greater proportion of hay in the diets) was the higher content of pentan-2-one, which is an important odour compound in several cheese types and can be formed by β-oxidation and decarboxylation of fatty acids (Curioni and Bosset Citation2002). Model cheeses from modern dairy systems without silage also had a higher content of octanoic acid, which may be due to lipolysis by endogenous milk-based lipases or those of microbial origin (Curioni and Bosset Citation2002).
There were greater differences in the cheese volatile fingerprints of modern dairy systems using TMR than those of systems not using TMR. It is well known that this feeding regime improves daily DM intake, and increases milk production as well as fat and protein contents (Kolver and Muller Citation1998; Bargo et al. Citation2002), which are primary substrates of VOC production (McSweeney and Sousa Citation2000). This is consistent with the observed differences in the VOC profiles. A novel result of our work is the greater quantities of 2,3-pentanedione in these dairy systems, which seems to indicate corn silage in the cows’ diet. Differences in 2,3-pentanedione concentrations were reported by Garde et al. (Citation2007) in Hispánico cheese manufactured in experimental conditions, a ketone that may be formed from α-aceto-α-hydroxybutyrate (Imhof et al. Citation1995). These authors also found higher 2,3-pentanedione release by some lactic acid bacteria.
Conclusions
In conclusion, the effects of different feeding systems on VOC profiles may be manifested in three ways: (i) through transfer of VOCs or their metabolites from the feed to the milk and cheese; (ii) through differences in enzymatic activity during milk collection, transport or cheese-making; (iii) through different indigenous milk microflora compositions. In this work, we were able to associate several spectrometric peaks characterising the volatile profiles of model cheeses to different dairy systems. These results may us speculate about the possibility obtaining discrimination functions that should be developed for specific cheeses in relation to known dairy systems, especially in relation to the production certifications that delimit the area of milk production and specify the animal feeding strategies. The potential of analysing the volatile organic compounds of ripened cheese to trace post hoc the dairy system they originate from needs to be confirmed by analysing industry cheeses made with bulk milk from different groups of herds under a wide range of production conditions.
Ethical Approval
The cows included in this study belonged to commercial private herds and were not subjected to any invasive procedures. Milk and blood samples were previously collected during the routine milk recording coordinated by technicians working at the Breeder Association of Trento Province (Italy) and therefore authorized by a local authority.
Acknowledgments
The authors thank the Breeder Federation of Trento Province (Trento, Italy), and the Superbrown Consortium of Bolzano and Trento (Italy) for technical supports.
Disclosure statement
No potential conflicts of interest were reported by the authors.
Related Research Data
References
- Bargo F, Muller LD, Delahoy JE, Cassidy TW. 2002. Performance of high producing dairy cows with three different feeding systems combining pasture and total mixed rations. J Dairy Sci. 85(11):2948–2963.
- Bergamaschi M, Aprea E, Betta E, Biasioli F, Cipolat-Gotet C, Cecchinato A, Bittante G, Gasperi F. 2015. Effects of dairy system, herd within dairy system, and individual cow characteristics on the volatile organic compound profile of ripened model cheeses. J Dairy Sci. 98(4):2183–2196.
- Bergamaschi M, Biasioli F, Cappellin L, Cecchinato A, Cipolat-Gotet C, Cornu A, Gasperi F, Martin B, Bittante G. 2015. Proton transfer reaction time-of-flight mass spectrometry: a high-throughput and innovative method to study the influence of dairy system and cow characteristics on the volatile compound fingerprint of cheeses. J Dairy Sci. 98(12):8414–8427.
- Bergamaschi M, Cecchinato A, Biasioli F, Gasperi F, Martin B, Bittante G. 2016. From cow to cheese: genetic parameters of the flavour fingerprint of cheese investigated by direct-injection mass spectrometry (PTR-ToF-MS). Gen Sel Evol. 48:1–14.
- Biasioli F, Gasperi F, Aprea E, Endrizzi I, Framondino V, Marini F, Mott D, Märk TD. 2006. Correlation of PTR-MS spectral fingerprints with sensory characterisation of flavour and odour profile of ‘Trentingrana’ cheese. Food Qual Prefer. 17(1–2):63–75.
- Bittante G, Cecchinato A, Cologna N, Penasa M, Tiezzi F, De Marchi M. 2011. Factors affecting the incidence of first-quality wheels of Trentingrana cheese. J Dairy Sci. 94(7):3700–3707.
- Bittante G, Cologna N, Cecchinato A, De Marchi M, Penasa M, Tiezzi F, Endrizzi I, Gasperi F. 2011. Monitoring of sensory attributes used in the quality payment system of Trentingrana cheese. J Dairy Sci. 94(11):5699–5709.
- Boscaini E, Van Ruth S, Biasioli F, Gasperi F, Märk TD. 2003. Gas chromatography-olfactometry (GC-O) and proton transfer reaction-mass spectrometry (PTR-MS) analysis of the flavor profile of Grana Padano, Parmigiano Reggiano, and Grana Trentino cheeses. J Agric Food Chem. 51(7):1782–1790.
- Buchin S, Delague V, Duboz G, Berdague JL, Beuvier E, Pochet S, Grappin R. 1998. Influence of pasteurization and fat composition of milk on the volatile compounds and flavor characteristics of a semi-hard cheese. J Dairy Sci. 81(12):3097–3108.
- Buchin S, Duboz G, Salmon JC. 2017. Lactobacillus delbrueckii subsp. lactis as a starter culture significantly affects the dynamics of volatile compound profiles of hard cooked cheeses. Eur Food Res Technol. 243(11):1943–1955.
- Cappellin L, Biasioli F, Fabris A, Schuhfried E, Soukoulis C, Märk TD, Gasperi F. 2010. Improved mass accuracy in PTR-TOF-MS: another step towards better compound identification in PTR-MS. Int J Mass Spec. 290(1):60–63.
- Cappellin L, Karl T, Probst M, Ismailova O, Winkler PM, Soukoulis C, Aprea E, Märk TD, Gasperi F, Biasioli F. 2012. On quantitative determination of volatile organic compound concentrations using proton transfer reaction time-of-flight mass spectrometry. Environ Sci Technol. 46(4):2283–2290.
- Carbonell M, Nuñez M, Fernández-García E. 2002. Seasonal variation of volatile compounds in ewe raw milk La Serena cheese. Lait. 82(6):699–711.
- Carpino S, Mallia S, La Terra S, Melilli C, Licitra G, Acree TE, Barbano DM, Van Soest PJ. 2004. Composition and aroma compounds of ragusano cheese: native pasture and total mixed rations. J Dairy Sci. 87(4):816–830.
- Cipolat-Gotet C, Cecchinato A, De Marchi M, Bittante G. 2013. Factors affecting variation of different measures of cheese yield and milk nutrient recovery from an individual model cheese-manufacturing process. J Dairy Sci. 96(12):7952–7965.
- Coppa M, Ferlay A, Chassaing C, Agabriel C, Glasser F, Chilliard Y, Borreani G, Barcarolo R, Baars T, Kusche D, et al. 2013. Prediction of bulk milk fatty acid composition based on farming practices collected through on-farm surveys. J Dairy Sci. 96(7):4197–4211.
- Coppa M, Martin B, Agabriel C, Chassaing C, Sibra C, Constant I, Graulet B, Andueza D. 2012. Authentication of cow feeding and geographic origin on milk using visible and near-infrared spectroscopy. J Dairy Sci. 95(10):5544–5551.
- Coppa M, Martin B, Pradel P, Leotta B, Priolo A, Vasta V. 2011. Effect of a hay-based diet or different upland grazing systems on milk volatile compounds. J Agric Food Chem. 59(9):4947–4954.
- Cornu A, Carnat A, Martin B, Coulon J, Lamaison J-L, Berdague J-L. 2001. Solid-phase microextraction of volatile components from natural. J Agric Food Chem. 49(1):203–209.
- Cornu A, Rabiau N, Kondjoyan N, Verdier-Metz I, Pradel P, Tournayre P, Berdagué JL, Martin B. 2009. Odour-active compound profiles in Cantal-type cheese: effect of cow diet, milk pasteurization and cheese ripening. Int Dairy J. 19(10):588–594.
- Couvreur S, Hurtaud C, Marnet PG, Faverdin P, Peyraud JL. 2007. Composition of milk fat from cows selected for milk fat globule size and offered either fresh pasture or a corn silage-based diet. J Dairy Sci. 90(1):392–403.
- Croissant AE, Washburn SP, Dean LL, Drake MA. 2007. Chemical properties and consumer perception of fluid milk from conventional and pasture-based production systems. J Dairy Sci. 90(11):4942–4953.
- Curioni PMG, Bosset JO. 2002. Key odorants in various cheese types as determined by gas chromatography-olfactometry. I Dairy J. 12(12):959–984.
- Ehtesham E, Baisden WT, Keller ED, Hayman AR, Van Hale R, Frew RD. 2013. Correlation between precipitation and geographical location of the δ2H values of the fatty acids in milk and bulk milk powder. Geo Cosm Acta. 111:105–116.
- Fabris A, Biasioli F, Granitto PM, Aprea E, Cappellin L, Schuhfried E, Soukoulis C, Märk TD, Gasperi F, Endrizzi I. 2010. PTR-TOF-MS and data-mining methods for rapid characterisation of agro-industrial samples: influence of milk storage conditions on the volatile compounds profile of Trentingrana cheese. J Mass Spectrom. 45(9):1065–1074.
- Fernandez C, Astier C, Rock E, Coulon JB, Berdagué JL. 2003. Characterization of milk by analysis of its terpene fractions. Int J Food Sci Tech. 38(4):445–451.
- Galle SA, Koot A, Soukoulis C, Cappellin L, Biasioli F, Alewijn M, Van Ruth SM. 2011. Typicality and geographical origin markers of protected origin cheese from the Netherlands revealed by PTR-MS. J Agric Food Chem. 59(6):2554–2563.
- Garde S, Ávila M, Fernández-García E, Medina M, Nuñez M. 2007. Volatile compounds and aroma of Hispánico cheese manufactured using lacticin 481-producing Lactococcus lactis subsp. lactis INIA 639 as an adjunct culture. Int Dairy J. 17(6):717–726.
- Granato D, Putnik P, Bursać Kovačević D, Sousa Santos J, Calado V, Silva Rocha R, Gomes Da Cruz A, Jarvis B, Ye Rodionova O, Pomerantsev A. 2018. Trends in chemometrics: food authentication, microbiology, and effects of processing. Comprehensive Reviews in Food Science and Food Safety. 17(3):663–677.
- Houssin B, Chenais F, Foret A. 2003. Influence du régime hivernal des vaches laitières sur la qualité organoleptique des beurres et des camemberts. Renc Rech Ruminants. 10:219–222.
- Hurtaud C, Dutreuil M, Coppa M, Agabriel C, Martin B. 2014. Characterization of milk from feeding systems based on herbage or corn silage with or without flaxseed and authentication through fatty acid profile. Dairy Sci Technol. 94(2):103–123.
- Imhof R, Glättli H, Bosset JO. 1995. Volatile organic compounds produced by thermophilic and mesophilic single strain dairy starter cultures. LWT Food Sci Technol. 28(1):78–86.
- Jiménez-Carvelo A.M, González-Casado A, Bagur-González M.G, Cuadros-Rodríguez L. 2019. Alternative data mining/machine learning methods for the analytical evaluation of food quality and authenticity – a review. Food Res Int. 122:25–39.
- Kalač P. 2011. The effects of silage feeding on some sensory and health attributes of cow’s milk: a review. Food Chem. 125(2):307–317.
- Kolver ES, Muller LD. 1998. Performance and nutrient intake of high producing holstein cows consuming pasture or a total mixed ration. J Dairy Sci. 81(5):1403–1411.
- Lindinger W, Hansel A, Jordan A. 1998. On-line monitoring of volatile organic compounds at pptv levels by means of proton-transfer-reaction mass spectrometry (PTR-MS) medical applications, food control and environmental research. Int J Mass Spectr Ion Pro. 173(3):191–241.
- Martin B, Jestin M, Constant I, Agabriel C, Andueza D. 2006. Authentification de la zone de production de laits de grand mélange (plaine – montagne) à partir de méthodes spectrales dans le visible et le proche infrarouge Traceability of tanker milk origin (plain – mountain) using visible or near infra-red spect. Renc Rech Ruminants. 13:194.
- Martin B, Verdier-Metz I, Buchin S, Hurtaud C, Coulon J-B. 2005. How do the nature of forages and pasture diversity influence the sensory quality of dairy livestock products? Anim Sci. 81(2):205–212.
- McSweeney PLH, Sousa MJ. 2000. Biochemical pathways for the production of flavour compounds in cheeses during ripening: a review. Lait. 80(3):293–324.
- Nagaraja TG. 2012. A Microbiologist’s view on improving nutrient utilization in ruminants. Proc 23rd Annual Florida Ruminant Nutrition Symposium. p. 135–161.
- Renou JP, Deponge C, Gachon P, Bonnefoy JC, Coulon JB, Garel JP, Vérité R, Ritz P. 2004. Characterization of animal products according to geographic origin and feeding diet using nuclear magnetic resonance and isotope ratio mass spectrometry: cow milk. Food Chem. 85(1):63–66.
- Revello Chion A, Tabacco E, Giaccone D, Peiretti PG, Battelli G, Borreani G. 2010. Variation of fatty acid and terpene profiles in mountain milk and ‘Toma piemontese’ cheese as affected by diet composition in different seasons. Food Chem. 121(2):393–399.
- Slots T, Butler G, Leifert C, Kristensen T, Skibsted LH, Nielsen JH. 2009. Potentials to differentiate milk composition by different feeding strategies. J Dairy Sci. 92(5):2057–2066.
- Stefanon B, Procida G. 2004. Effects of including silage in the diet on volatile compound profiles in Montasio cheese and their modification during ripening. J Dairy Res. 71(1):58–65.
- Stergiadis S, Leifert C, Seal CJ, Eyre MD, Nielsen JH, Larsen MK, Slots T, Steinshamn H, Butler G. 2012. Effect of feeding intensity and milking system on nutritionally relevant milk components in dairy farming systems in the north east of England. J Agric Food Chem. 60(29):7270–7281.
- Tornambé G, Cornu a, Pradel P, Kondjoyan N, Carnat A P, Petit M, Martin B. 2006. Changes in terpene content in milk from pasture-fed cows. J Dairy Sci. 89(6):2309–2319.
- Toso B, Procida G, Stefanon B. 2002. Determination of volatile compounds in cows’ milk using headspace GC-MS. J Dairy Res. 69(4):569–577.
- Valenti B, Martin B, Andueza D, Leroux C, Labonne C, Lahalle F, Larroque H, Brunschwig P, Lecomte C, Brochard M, et al. 2013. Infrared spectroscopic methods for the discrimination of cows’ milk according to the feeding system, cow breed and altitude of the dairy farm. Int Dairy J. 32(1):26–32.
- Verdier I, Coulon JB, Pradel P, Berdagué JL. 1995. Effect of forage type and cow breed on the characteristics of matured Saint-Nectaire cheeses. Lait. 75(6):523–533.