
 ?Mathematical formulae have been encoded as MathML and are displayed in this HTML version using MathJax in order to improve their display. Uncheck the box to turn MathJax off. This feature requires Javascript. Click on a formula to zoom.
Abstract
The differences of emulsion properties between normal colour chicken livers (NCCLs) and discolouration chicken livers (DCCLs) were evaluated. Compared with NCCLs, the L* and b*-value of DCCLs were extremely higher (p < .05), but the a*-value, cooking loss and emulsification stability were lower (p < .05). The elasticity and cohesiveness of two kinds of livers had significant difference (p < .05) after 45 °C. The particle size and optical morphology of the emulsion prepared with NCCLs were significantly smaller than that of the emulsion prepared with DCCLs (p < .05), and the emulsion of NCCLs was stable and uniform distribution. Overall, the NCCLs presented more stable emulsification properties than DCCLs, and the formed emulsion was exquisite and uniform. The results indicated that in order to obtain high quality emulsified chicken liver products, it might be necessary to select the NCCLs instead of DCCLs as raw material to process. The NCCLs could be great feasible and potential application in the development of emulsified chicken liver paste products.
NCCLs had better emulsifying stability, cohesiveness and elasticity than DCCLs.
Emulsion prepared with NCCLs presented stable and uniform distribution.
NCCLs could be feasible to develop emulsified chicken liver paste products.
HIGHLIGHTS
Introduction
The world production of chicken meat in 2018 reached about 97.8 million tons (Mt), of which China accounted for 14.7 Mt (FAO Citation2018). Chicken liver, an edible meat co-product, constitutes about 2–2.5% weight of their live body (Lasekan et al. Citation2013). It can be calculated that about 0.56 Mt chicken livers are produced annually in China, accounting for 16.67% of world production (Xiong et al. Citation2017). Chicken liver is a kind of source riched in protein, polyunsaturated fatty acids, lecithin, mineral elements and various vitamins (Abu-Salem and Abou Arab Citation2010). The emulsifying properties of chicken liver are usually influenced by the fraction and physico-chemical properties of protein (Zou et al. Citation2019). Two kinds of chicken livers (normal colour chicken livers [NCCLs] and discolouration chicken livers [DCCLs]) which presented different physico-chemical characteristics (Xiong et al. Citation2017) may demonstrate differing emulsifying properties. The economic benefit would be greatly increased if chicken liver can be further utilised to process emulsified chicken liver paste products. However, the ratio of deep processing and utilisation of chicken liver is generally low in China, probably due to poor studies about the processing characteristics of chicken liver.
In daily life, the consumers mainly tend to purchase the chicken liver according to the colour. NCCLs, reddish-brown in colour, is the familiar colour expected by consumers, while DCCLs, light yellow, yellow-brown or loess colour, are often seen in market (Xiong et al. Citation2016, Citation2017). It is presumed that the cause of DCCLs may be due to disease, obesity and stress factors including long-distance transportation, excessive hunger, inadequate water, etc., which lead metabolism disorder and liver colour changes light, from red to yellowish-brown, yellow and ochre (Lasekan et al. Citation2013). We have made an assessment about the ratio of DCCLs to NCCLs from the collection of chicken liver from different large-scale breeding companies and slaughterhouses, and found that the proportion of DCCLs was about 10–20%. However, yellow or brown chicken livers influenced consumers purchase and most of them were thrown away. Therefore, it was urgent to study the physical and chemical characteristics and emulsifying properties of DCCLs in order to enhance the utilisation and expand the scope of application of chicken liver.
In recent years, researches of chicken liver mainly focussed on its nourishment composition analysis, the content of trace elements and the composition of fatty acids (Fernández-Fígares et al. Citation1997; King and Chen Citation2006). The application of chicken liver as ingredient in food to develop some new products had become a research hotspot in recent years. Chicken liver could be used as the additives for infant foods (Martínez et al. Citation2006), or as ingredient for chicken liver paste products. Chicken liver also could be a resource to produce the food of pet (Xiong et al. Citation2020). Furthermore, there are high content (above 20%) and good quality proteins in chicken liver. It was also a hot and key topic how to improve emulsification properties of protein in meat processing industry. Steen et al. (Citation2016) pointed out that the emulsifying capacity of porcine liver proteins has great potential compared with sodium caseinate, porcine haemoglobin and porcine plasma. A limited number of studies have dealt with the effect on the different emulsion properties of the fresh chicken liver, focussing on rheological properties, emulsification, cooking loss of liver paste (Wang et al. Citation2013). However, none of these studies paid attention to explaining the differences of emulsion and processing properties in two types of colour fresh chicken livers. Xiong et al. (Citation2017) reported that NCCLs and DCCLs could present different processing characteristics due to their different composition. Being able to characterise the emulsion and processing properties of two colours of chicken liver from discarded co-products of the poultry industry would be desirable. Not only could it lead to increasing profitability of chicken co-products, but also could result in finding new edible resources of high quality.
Therefore, the objective of this study was to investigate the differences of emulsion properties for NCCLs and DCCLs by comparing the colour, cooking loss, dynamic rheological properties, particle size and emulsion stability, and to provide scientific data and theoretical basis for the application and further deep processing of chicken livers. It could also utilise fresh chicken livers to make good quality chicken liver products and improve their economic value.
Materials and methods
Chicken liver preparations
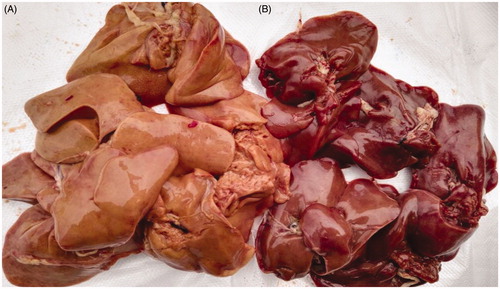
American AA white feather broilers (breeding from ArborAcres Poultry Breeding Company) from five different farms raised for 50 days under the same feed ingredients. The broilers from five farms were all slaughtered in a local commercial slaughterhouse. We made a survey and measurement, which obtained discolouration chicken liver were occupied approximately 15% of the total chicken liver. Then, each batch of DCCLs (Figure ) and NCCLs (Figure ) were separately obtained about 50 kg and transported to the laboratory in cold storage condition (0–4 °C) according to the colour (reddish-brown, light yellow or yellow-brown), respectively. Subsequently, chicken liver was trimmed to remove the larger blood vessels, bile ducts, connective tissue and visible fat. The preparation of liver batter was performed using the method of Martín-Sánchez et al. (Citation2017) with slight modification. After soaked in cold water for 15 min to eliminate the blood, the two types of part of fresh chicken livers were minced in a grinder (MM-12; Guangdong, China) with an 8 mm hole plate diameter. Subsequence, the chicken liver batters were thoroughly mixed, respectively, and packed in the vacuum packages and refrigerated at 4 °C. In our previous study, the fat content is 12.91% and 6.9%, respectively, in DCCLs and NCCLs, as well as the protein is 15.64% and 17.52%, respectively (Xiong et al. Citation2017). All samples were analysed within 2 days.
Figure 1. Discolouration and normal colour chicken livers. (A) Discolouration fresh chicken livers; (B) normal colour fresh chicken livers).
Colour measurement
The surface colour of fresh chicken liver was measured by CR-400 colorimeter (Konica Minolta Business Technologies, Inc., Tokyo, Japan). The colorimeter was calibrated with a standard white ceramic tile. Five samples of each batch of two kinds of chicken livers were measured. Each liver paste sample was measured in triplicate to obtain the lightness value (L*), redness value (a*) and yellowness value (b*).
Cooking loss
Cooking loss of samples was determined by the method of Chan et al. (Citation2011) with slight modification. After removing large blood vessels, bile duct and connective tissue from fresh chicken liver, 10 pieces of complete chicken liver were randomly selected for each batch. Trimmed into the same weighted (approximately 25 g and accurate to 0.001 g, W1), all samples were packed individually in clean plastic bags and sealed, then heated in a water bath at 80 °C for 30 min. Then, the samples were cooled to room temperature in running water. Dried with blotting paper to dry the surface moisture of the samples, the livers were weighed again (W2). Samples were repeated 10 times per batch to represent the cooking loss. Determinations were carried according to the following formula:
(1)
(1)
Emulsion stability
Preparation of emulsified chicken liver paste was performed as the following: NCCLs and DCCLs were respectively chopped with a table grinder with 8 mm diameter sieve hole at 4 °C and separately fully mixed to obtain a chicken liver paste. Chopped chicken liver paste, including 60% liver paste, 28.2% soybean oil, 10% ice and 1.8% sodium chloride, was fully mixed at high rapidly speed for 1 min by 3 times. The emulsion stability of ground chicken liver paste was determined using a modified method described by Fernández-Martín et al. (Citation2009). Raw batter samples (approximately 25 g, W1) were placed in 50 mL centrifuge tubes (W0) and centrifuged (Allegra™ 64 R, Fisher Scientific, Pittsburgh, PA, USA) for 3 min at 500 × g and 4 °C to remove large air bubbles. Subsequence, the tubes were heated in a water bath at 70 °C for 30 min. The sample was left inverted onto a weighted culture dish (W2) at room temperature for 50 min to release exudate. The total weight of centrifuge tube and chicken liver after resting was signed as W3. The exudate or total fluid release (TR) was expressed as percentage of initial sample weight. Water release (WR, percentage of initial sample weight) was determined from the dry weight content of TR after heating at 105 °C for 16 h weighed as W4. Minor protein or salt component was ignored in determining fat release (FR, percentage of initial sample weight), which was regarded as the difference between TR and WR. Five replications were performed for each formulation per batch.
The percentage of total fluid released (% TR) (mixture of fat and water from the supernatant), fat released (% FR) and water released (% WR) was calculated as follows:
(2)
(2)
(3)
(3)
(4)
(4)
Particle size and distribution measurement
Particle size and size distribution of the emulsions prepared with chicken liver were monitored using a Malvern Mastersizer 3000 (Malvern Instruments Ltd., England). The average droplet size was represented by mean volume diameter D4,3 which was more sensitive to emulsion flocculation/coalescence than D3,2. An individual droplet size was measured in the presence of sodium dodecyl sulphate (SDS) which avoided aggregate formation that usually occurred after emulsification (Kim et al. Citation2001). Thus, the emulsion was diluted with SDS (1.0%) at 1:1. The parameters were set as follows. The type of injection was Hydro LV (large volume automatic wet dispersion unit); the refractive and absorption indices of granule were 1.520 and 0.001, respectively; the refractive of dispersant was 1.330; the transmittance was 10 − 20%; the background test duration was 15 s; the sensor threshold was 100 and the stirring speed was 2000 r/min. Each group was measured in triplicate. Flocculation extent of emulsion calculated according to the following formula:
(5)
(5)
(6)
(6)
where D3,2 and D4,3 are volume area equivalent mean diameter and volume mass equivalent mean, respectively, di is the diameter of the ith protein and ni is the number of proteins of diameter di.
Rheological property
The fresh chicken liver mashed with a GM 200 agitator (Retsch Grindomix) at a speed of 3000 rpm for 10 s. The dynamic rheological properties of the samples were measured by MCR 301 rotary rheometer (Anton Paar Company, Austria). The sample was weighted about 50 g and mixing evenly with 1.8% sodium chloride. Using a 50 mm flat test, the sample was uniformly coated on the test platform and bubbles were driven off. Ten grams sample of raw liver batter was placed between the two flat plates with the perimeter coated with a thin layer of silicone oil to prevent dehydration of the sample edge and moisture evaporation from the sample. Then the entire gelling unit was enclosed in an insulated shell to further minimise heat loss. After initial equilibration at 20 °C for 5 min, the sample was heated continuously from 25 °C to a final temperature of 80 °C at a rate of 2 °C/min (gap = 1.0 mm). Measurements were conducted within the linear range at a strain of 0.002 and a constant frequency of 1 Hz. After setting parameters, changes in storage modulus (G′, elasticity), loss modulus (G″, viscidity) and the phase angle (δ, total viscoelasticity) were recorded. Each sample was measured in triplicate.
Light microscopy of chicken liver
The distribution of proteins and plant oil in emulsions were assessed by Scope. A1 Upright Fluorescence Microscope (Carl Zeiss Scope.A1, Germany) according to the method of Hu et al. (Citation2016), with slight modification. One millilitre of above emulsion was diluted at 1:100 (v:v) with deionised water and mixed thoroughly. Approximately a drop of emulsion was placed on a microscope slide, covered and observed under the microscope using a 40× objective lens.
Statistical analysis
All tests were carried out at least in triplicate. One-way analysis of variance (ANOVA) was performed to analyse the results using a statistical programme for social sciences (IBM SPSS STATISTICS 20.0), and the significant differences among the means was determined at p < .05 using t-test. The statistics was expressed with ‘average ± standard deviation’.
Results and discussion
Colour analysis
From the appearance, the NCCLs and DCCLs were showed obvious different colours (Figure ). The L* and b* values of DCCLs were significant higher (p < .05) than those of NCCLs, whereas the a* value was significantly lower (p < .05) (Table ). An important factor for the different colour of chicken liver is that the total pigment content of NCCLs is nearly twice as high as that of DCCLs, and the content of myoglobin in NCCLs is far higher than that of DCCLs (Xiong et al. Citation2017). The abnormal fat accumulation in the hepatic cells of the chicken may have contributed to the decreased intensity of the liver colour (King and Chen Citation2006). Therefore, the colour of NCCLs was reddish and reddish-brown, and the colour of DCCLs was yellow-brown, which was contributed with the results of Xiong et al. (Citation2017).
Table 1. The L*, a*, b* values and cooking loss of normal colour and discolouration chicken livers.
Cooking loss
The cooking loss of NCCLs was significantly higher (p < .05) than that of DCCLs in Table . One reason may be that the moisture content of NCCLs was higher than DCCLs (Xiong et al. Citation2017). Another reason for higher cooking loss is during the heating process, evaporation of moisture, melting of fat (Gujral et al. Citation2002) and denaturation of protein. With the increase of cooking temperature, the protein network structure of DCCLs maybe came into being and formed loose protein gel. The loose protein network structure could provide a large amount of interspace for water and fix more moisture to retain temporarily in it. Other factors except for protein denaturation, the pH of raw chicken livers also effects cooking loss. Xiong et al. (Citation2017) reported that DCCLs’ pH (6.18) is close to the isoelectric point for the majority of muscle proteins, causing the protein solubility decrease (Zou et al. Citation2017). The pH plays a positive role in gel information, and indirectly effects the water retention ability of chicken livers (Ramirezsuarez and Xiong Citation2003; Omura et al. Citation2020). However, both of them were lower than the cooking loss of buffalo liver (26.85%) (Suresh et al. Citation2004). This may be attributed to the difference of animal species, proximate composition, cooking temperature and cooking time (Combes et al. Citation2004; Vasanthi et al. Citation2007).
Emulsion stability
The results regarding emulsion stability of NCCLs and DCCLs are shown in Table . In this study, the water retention (WR) rate of two kinds of fresh chicken liver emulsions was not significantly different (p > .05). Emulsion stability was the expression of water retention and fat capacity in emulsification process (Luruena-Martinez et al. Citation2004), which is related to the hydrophilic and lipid characteristics of proteins and dictated by protein–protein and protein–lipid interaction (Carli et al. Citation2018). The fat release of NCCLs emulsions was significantly lower (p < .01) than that of DCCLs emulsions, which may be contributed that the content of unsaturated fatty acid (UFA) in NCCLs emulsions was higher than that of DCCLs emulsions. Xiong et al. (Citation2016) reported that the higher content UFA was contributed to the stability of emulsion. Due to the addition of sodium chloride, the salt-soluble protein were increasingly separated out and increased the utilisation value of fat for the processing of emulsion, which influenced the released of fat (Steen et al. Citation2014). More fat and less protein in DCCLs were available to act as emulsifier, which led to a heterogeneous emulsion with larger fat globules and the occurrence of non-emulsified zones and fat channels (Choe and Kim Citation2019). During centrifugation, more fat moved along the channel to the surface of the product (Chan et al. Citation2011), which caused fat release and increased the oil leakage. In the further processing, in order to improve the quality of the emulsified chicken liver products, the problem of fat leakage must be solved for DCCLs.
Table 2. The emulsion stability of normal colour and discolouration fresh chicken livers.
Particle size and size distribution of chicken liver protein
The particle sizes of different colour chicken liver protein were shown in Figure . The average droplet sizes were represented by mean volume diameter D4,3 which was more sensitive to fat droplet flocculation/coalescence than D3,2. Peak value of droplet size distribution at the range of 1 µm to 10 µm was no significant between two kind of chicken liver emulsions (p > .05). The particle size of DCCLs emulsions was significantly higher than that of NCCLs emulsions in the extent from 100 µm to 10,000 µm (p < .05). The extents of flocculation were listed in Table . The emulsion of NCCLs had more protein in the emulsion system than DCCLs, which could be promoted to form stable and uniformed emulsion. This may be also attributed to the protein degradation or denaturation in DCCLs resulted in forming no-uniform emulsion and larger size droplets, and decreased the emulsifying capacity (Sun et al. Citation2006). The D4,3 values of DCCLs were significantly higher than that of NCCLs, and the results were consistent with rheological properties. This may be explained to the uniform size particles resulted the formed of stabilise the emulsion for NCCLs. Light microscopy also showed a smaller and even droplets for NCCLs in Figure .
Figure 2. Particle size distribution of emulsions of different colour chicken livers. NCCLs: normal colour chicken livers; DCCLs: discolouration coloured chicken livers.
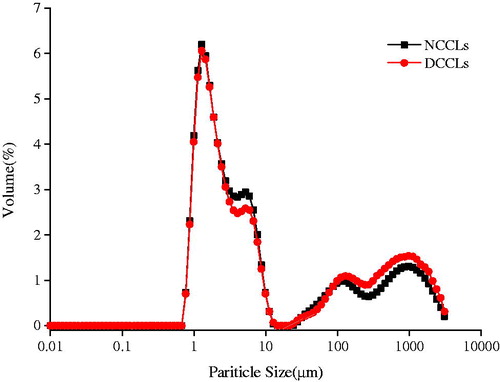
Table 3. Particle size comparison of different colour chicken livers.
Rheological properties
The gelation curves of NCCLs and DCCLs are shown in Figure . From Figure , during the heating, the G′ value of NCCLs did not appreciably change before reaching 45 °C, and then it increased slowly from 45 °C to 55 °C. Later, it increased sharply from 55 °C to end, indicating an increase in elastic properties. The G′ of DCCLs increased quickly after 57 °C, which indicated that the onset of network structure formation was resulted from the protein denaturation. The temperature of the network structure formation was similar with the result of Zhang and Barbut (Citation2005). The values of G′ of NCCLs were significantly higher than that of DCCLs after 45 °C, which usually indicated that the NCCLs were more rigid and less ductile, whereas the DCCLs were indicated softer texture. The storage modulus of both samples was corresponded with the hardness value in texture. In this study, the rheological transition was slow transformation and not observed stepwise structural changes and interactions of myofibrillar protein (Wu et al. Citation2009; Wang et al. Citation2013), which may be related to the type of protein and pH (Westphalen et al. Citation2005, Citation2006).
Figure 3. The change of rheological properties of normal colour fresh chicken livers and discolouration fresh chicken livers during heating from 25 to 80 °C at a rate of 1 °C/min. (A) Storage modulus (Gˊ, Pa); (B) loss modulus (G˝, Pa); (C) phase angle (δ, o). NCCLs: normal colour chicken livers; DCCLs: discolouration chicken livers.
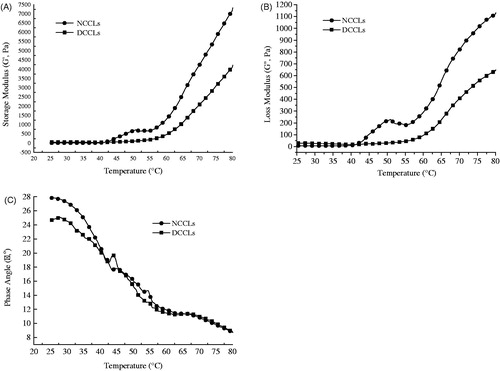
As shown in Figure , the G″ of NCCLs began ascending at 42 °C, indicated the onset of protein denaturation, which enhanced the viscous component of the protein suspension. The G″ curve of NCCLs reached first peak around 50 °C and then continuously increased from 55 °C to 80 °C. While the G″ of DCCLs increased at approximately 55 °C. However, the G′ of both chicken livers was always higher than G″, which indicated that the elasticity exceeded viscosity. This was contributed that the collagen wrapped on the surface of the fat ball and flowed into the continuous phase with heating, which changed the emulsifying properties of the whole system (Wang et al. Citation2013). The formation of protein networks was less viscous in lower G″, which was related to the lower protein solubility and less capability of protein to form a hydrodynamic mass at the initial stage of gel formation (Danika et al. Citation2020).
The phase angles of NCCLs and DCCLs gradually decreased with the increase of temperature and there was no significant different between both chicken livers (p > .05) (Figure ). The phase angles of NCCLs and DCCLs were at the lower value of 9.6° and 8.7°, respectively. The gel state was basically completed and showed stronger gel characteristics (Wu et al. Citation2009). A change in the phase angle indicated the type of network formed; lower phase angle value represents a better three-dimensional network formation (Chan et al. Citation2011). When the temperature over 60 °C, the change of phase angle tended to be gentle, and the phase angle of DCCLs was little different from that of NCCLs, which indicated that the two kinds of chicken livers could form better viscoelasticity in the end. At 70 °C, the δ decreased again, which might be related to the increases of temperature affecting the gel structure of the protein. This might be attributed to an increased structural ‘puffy’ of protein upon heating produced a more viscous feature, and at the initial heating stage the ‘viscous’ feature of the gelling system outweighed the ‘elastic’ component of the pre-gel (Wang et al. Citation2019).
Light microscopy of chicken liver
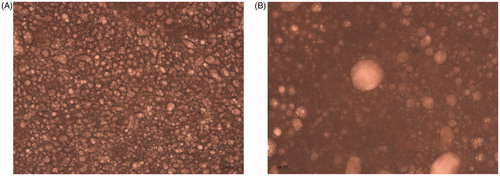
The optical microscope can truly reflect the droplet distribution of the emulsion. As shown in Figure , the droplets of DCCLs emulsions exhibited uneven and irregular droplets. The droplets showed irregularly distributed and relatively large droplets in the emulsion. While it clearly observed that the droplets of NCCLs emulsions were small and evenly distributed in the continuous phase (Figure ). The uniform distribution of the droplets was beneficial to form a stable emulsion by the stabilisation of the protein layer at the interface (Steen et al. Citation2014). In addition, the interface of the droplets formed from NCCLs protein maybe had the very low electrostatic interactions causing the droplets to repel each other and distribute uniformly throughout the emulsion (Li et al. Citation2015). In the previous studies, NCCLs had a higher protein content and formed an elastic gel-like network at the oil–water interface, which can play a physical barrier to droplet aggregation and form stable emulsion (Hu et al. Citation2016). The emulsion formed from DCCLs had large size oil droplets and greatly differences of the particle size, indicating flocculation between droplets. The morphologies of the emulsion obtained by optical microscope were consistent with the results of the particle size.
Figure 4. Microscopy (magnification, 40×) of emulsions of different colour chicken liver protein. (A) Emulsion of normal colour chicken liver protein; (B) emulsion of discolouration chicken liver protein.
Conclusions
The results acquired in this work clearly demonstrated that the NCCLs and DCCLs presented all positive emulsion stability, water and fat binding capacity. The NCCLs were superior to DCCLs in colour, water retention and emulsifying stability. This study could provide some data support for the deep processing of NCCLs and DCCLs. As far as emulsifying processing characteristics are concerned, in order to ensure the favourite quality, the amount of NCCLs should be increased when produced emulsified chicken liver products such as chicken liver paste because of their better emulsifying properties. Considering improvement economic benefits, DCCLs may be more suitable to directly stew and boil due to the lower cooking loss.
Ethical approval
The ethical protocol was reviewed and approved in this experiment by the ethics committee of Anhui Agriculture University.
Disclosure statement
No potential conflict of interest was reported by the author(s).
Additional information
Funding
References
- Abu-Salem FM, Abou Arab EA. 2010. Chemical properties, microbiological quality and sensory evaluation of chicken and duck liver paste (foie gras). Grasas Aceites. 61(2):126–135.
- Carli DC, Moraes-Lovison M, Pinho SC. 2018. Production, physicochemical stability of quercetin-loaded nanoemulsions and evaluation of antioxidant activity in spreadable chicken pâtés. LWT-Food Sci Technol. 98:154–161.
- Chan JTY, Omana DA, Betti M. 2011. Functional and rheological properties of proteins in frozen turkey breast meat with different ultimate pH. Poult Sci. 90(5):1112–1123.
- Choe J, Kim HY. 2019. Quality characteristics of reduced fat emulsion-type chicken sausages using chicken skin and wheat fiber mixture as fat replacer. Poult Sci. 98(6):2662–2669.
- Combes S, Lepetit J, Darche B, Lebas F. 2004. Effect of cooking temperature and cooking time on Warner-Bratzler tenderness measurement and collagen content in rabbit meat. Meat Sci. 66(1):91–96.
- Danika KM, Nuria CA, Steven ML, Joseph GS, Rodrigo T. 2020. Rheological characteristics of mechanically separated chicken and chicken breast trim myofibril solutions during thermal gelation. Food Chem. 307:125557.
- FAO. 2018. FAOSTAT Domains. Livestock Primary. Food and Agriculture Organization of the United Nations. Retrieved from http://www.fao.org/faostat/zh/#data/QL
- Fernández-Fígares I, Prieto C, Nieto R, Aguilera JF. 1997. Free amino acid concentrations in plasma, muscle and liver as indirect measures of protein adequacy in growing chickens. Anim Sci. 64(3):529–539.
- Fernández-Martín F, Lopez-Lopez I, Cofrades S, Colmenero FJ. 2009. Influence of adding Sea Spaghetti seaweed and replacing the animal fat with olive oil or a konjac gel on pork meat batter gelation. Potential protein/alginate association. Meat Sci. 83(2):209–217.
- Gujral HS, Kaur A, Singh N, Sodhi NS. 2002. Effect of liquid whole egg, fat and textured soy protein on the textural and cooking properties of raw and baked patties from goat meat. J Food Eng. 53(4):377–385.
- Hu HY, Xing LJ, Hu YY, Qiao CL, Wu T, Zhou GH, Zhang WG. 2016. Effects of regenerated cellulose on oil-in-water emulsions stabilized by sodium caseinate. Food Hydrocoll. 52:38–46.
- Kim KH, Renkema JMS, Vliet T. 2001. Rheological properties of soybean protein isolate gels containing emulsion droplets. Food Hydrocoll. 15(3):295–302.
- King YT, Chen TC. 2006. Chemical and physical characteristics of chicken livers following adrenocorticotropic hormone-induced stress. J Food Sci. 63(4):589–591.
- Lasekan A, Bakar FA, Hashim D. 2013. Potential of chicken by-products as sources of useful biological resources. Waste Manag. 33(3):552–565.
- Li Y, Li QH, Wang HQ, Wang ZJ, Feng ZQ, Jiang LZ. 2015. Property studies on emulsion system of soybean isolate protein-phospholipase hyfrolysis production. J Chinese Inst Food Sci Technol. 15(11):41–47.
- Luruena-Martinez MA, Vivar-Quintana AM, Revilla I. 2004. Effect of locust bean/xanthan gum addition and replacement of pork fat with olive oil on the quality characteristics of low-fat frankfurters. Meat Sci. 68(3):383–389.
- Martínez B, Rincón F, Ibáñez MV. 2006. Dialysability of trace elements in infant foods containing liver. Food Chem. 94(2):210–218.
- Martín-Sánchez AM, Ciro-Gomez G, Vilella-Espla J, Perez-Alvarez JA, Sayas-Barbera E. 2017. Physicochemical and sensory characteristics of spreadable liver pâtés with annatto extract (Bixa orellana L.) and date palm co-products (Phoenix dactylifera L.). Foods. 6(11):94.
- Omura F, Takahashi K, Okazaki E, Osako K. 2020. A novel and simple non-thermal procedure for preparing low-pH-induced surimi gel from Alaska pollock (Theragra chalcogramma) using glucose oxidase. Food Chem. 321:126722.
- Ramirezsuarez JC, Xiong YL. 2003. Effect of transglutaminase-induced cross-linking on gelation of myofibrillar/soy protein mixtures. Meat Sci. 65(2):899–907.
- Steen L, Fraeye I, Goemaere O, Sifre L, Goderis B, Paelinck H, Foubert I. 2014. Effect of salt and liver/fat ratio on microstructure, emulsion stability, texture and sensory mouth feel of liver paste. Food Bioprocess Technol. 7(10):2855–2864.
- Steen L, Glorieux S, Goemaere O, Brijs K, Paelinck H, Foubert I, Fraeye I. 2016. Functional properties of pork liver protein fractions. Food Bioprocess Technol. 9(6):970–980.
- Sun ZH, Huang JB, Zhao MM. 2006. Effect of small molecular emulsifiers on emulsifying properties of food proteins. Shipin Gongye Keji. 27(5):189–194.
- Suresh D, Mendiratta SK, Kondaiah N. 2004. Quality characteristics of loaves from buffalo meat, liver and vegetables. Meat Sci. 67(3):377–383.
- Vasanthi C, Venkataramanujam V, Dushyanthan K. 2007. Effect of cooking temperature and time on the physico-chemical, histological and sensory properties of female carabeef (buffalo) meat. Meat Sci. 76(2):274–280.
- Wang JY, Li ZY, Zheng BD, Zhang Y, Guo ZB. 2019. Effect of ultra-high pressure on the structure and gelling properties of low salt golden threadfin bream (Nemipterus virgatus) myosin. LWT-Food Sci Technol. 100:381–390.
- Wang P, Wang HW, Shao JJ, Sun J, Zhao YY, Xia TL, Xu XL, Zhou GH. 2013. Rheological and low-field NMR characteristics of chicken liver emulsion composite gel. Food Sci. 34(23):11–14.
- Westphalen AD, Briggs JL, Lonergan SM. 2005. Influence of pH on rheological properties of porcine myofibrillar protein during heat induced gelation. Meat Sci. 70(2):293–299.
- Westphalen AD, Briggs JL, Lonergan SM. 2006. Influence of muscle type on rheological properties of porcine myofibrillar protein during heat-induced gelation. Meat Sci. 72(4):697–703.
- Wu MG, Xiong YL, Chen J, Tang XY, Zhou GH. 2009. Rheological and microstructural properties of porcine myofibrillar protein-lipid emulsion composite gels. J Food Sci. 74(4):207–217.
- Xiong GY, Chen X, Zhang XX, Miao Y, Zou Y, Wang DY, Xu WM. 2020. Process optimization and the relationship between the reaction degree and the antioxidant activity of Maillard reaction products of chicken liver protein hydrolysates. Poult Sci. [Accepted, 31 Mar 2020]: [9 p.] http://doi.org/10.1016/j.psj.2020.03.027
- Xiong GY, Gao XQ, Zheng HB, Li X, Xu XL, Zhou GH. 2017. Comparison on the physico-chemical and nutritional qualities of normal and abnormal colored fresh chicken liver. Anim Sci J. 88(6):893–899.
- Xiong GY, Wang P, Zheng HB, Xu XL, Zhu YY, Zhou GH. 2016. Effects of plants oil combinations substututing pork back-fat combined with pre-emulification on physicochemical, textural, microstructural and sensory properties of spreadble chicken liver PÂTÉ. J Food Qual. 39(4):331–341.
- Zhang L, Barbut S. 2005. Rheological characteristics of fresh and frozen PSE, normal and DFD chicken breast meat. Br Poult Sci. 46(6):687–693.
- Zou Y, Li PP, Zhang K, Wang L, Zhang MH, Sun ZL, Sun C, Geng ZM, Xu WM, Wang DY. 2017. Effects of ultrasound-assisted alkaline extraction on the physiochemical and functional characteristics of chicken liver protein isolate. Poult Sci. 96(8):2975–2985.
- Zou Y, Shi HB, Chen X, Xu PP, Jiang D, Xu WM, Wang DY. 2019. Modifying the structure, emulsifying and rheological properties of water-soluble protein from chicken liver by low-frequency ultrasound treatment. Int J Biol Macromol. 139:810–817.