
 ?Mathematical formulae have been encoded as MathML and are displayed in this HTML version using MathJax in order to improve their display. Uncheck the box to turn MathJax off. This feature requires Javascript. Click on a formula to zoom.
Abstract
In bovine milk, Ca and P are partitioned between micellar (MP) and soluble phase (SP), both having important effects on coagulation properties. In particular, greater mineral content in the MP translates into better milk coagulation ability. Nevertheless, the high analytic costs of gold standard methods hamper the possibility to deepen partition of minerals in MP and SP on a large scale. In this study, MP and SP of Ca and P were predicted from 111,653 milk mid-infrared spectra of Holstein cows to investigate genetic parameters. The average coefficient of determination of the prediction models in cross validation was 0.73. Heritability estimates of MP and SP of Ca and P ranged from 0.472 to 0.548 and the two phases of the same mineral were negatively correlated. The MP of Ca was genetically associated with protein yield (0.284) and content (0.658); in the case of MP of P, the latter were equal to 0.262 and 0.808, respectively. The current selection index of Italian Holstein places positive emphasis on protein percentage and yield, thus it is likely that the MP of the investigated minerals is increasing at the expense of the SP. In perspective, it would be important to assess genetic correlations between measured and predicted phenotypes to corroborate the use of such predictions for management and breeding purposes.
Micellar and soluble fractions of Ca and P predicted from milk spectra are heritable.
Micellar fraction of Ca and P is favourably genetically associated with traits of interest for the dairy industry, such as milk protein and coagulation properties.
The Italian Holstein selection index emphasises protein percentage and yield, and thus it is indirectly improving micellar phase of Ca and P.
Highlights
Introduction
Milk and dairy products are important sources of minerals in human nutrition because they provide around 55 and 25% of recommended daily intakes of Ca and P, respectively (Górska-Warsewicz et al. Citation2019). The amount of certain minerals in milk largely affects technological properties such as enzymatic coagulation and synaeresis. Moreover, soluble Ca acts as molecular bridge between micelles during the formation of paracasein reticulum. Previous studies highlighted differences in micellar content of Ca and P between naturally occurring ‘good’ and ‘poor’ coagulating samples (Malacarne et al. Citation2014).
Mid-infrared spectroscopy (MIRS) is a cost-effective and non-destructive technique for the analysis of several milk features, including difficult-to-measure traits (Benedet et al. Citation2020; Grelet et al. Citation2021) and milk coagulation properties (MCP) (Chessa et al. Citation2014; De Marchi et al. Citation2014). Some authors have demonstrated the feasibility of MIRS to predict minerals from milk spectra (Soyeurt et al. Citation2009; Visentin et al. Citation2016) but they did not distinguish between micellar (MP) and soluble phase (SP) (Malacarne et al. Citation2018). On the other hand, a recent study has demonstrated that SP and MP of Ca and P of individual bovine milk can be predicted using backward interval partial least squares analysis (Franzoi et al. Citation2019).
To the best of our knowledge, no studies have characterised the genetic background of SP and MP of Ca and P in cow milk. Therefore, the aim the present study was to estimate genetic parameters of such new MIRS-predicted traits and to assess their associations with traits of interest for the dairy industry.
Materials and methods
A total of 473,816 test-day records of 23,450 HO cows collected from January 2011 to February 2019 during the monthly recording procedures in Bolzano province were originally available. Each record had information on milk yield (MY, kg/d), percentage of protein (P%) and fat (F%), somatic cell count (cells/μL), parity, days in milk (DIM), birth date, and calving date. Protein yield (PY, kg/d) and fat yield (FY, kg/d) were calculated from MY and P% and F%. Parity ranged from 1 to 15 and DIM from 5 to 305 d. Milk samples were analysed according to International Committee for Animal Recording guidelines using MilkoScan FT6000 until February 2017 and MilkoScan FT7 afterwards (FOSS Electric A/S, Hillerød, Denmark). Standard samples were routinely used to calibrate instruments according to manufacturer’s instructions (Juhl Citation2017). Somatic cell count was determined using Fossomatic (FOSS Electric A/S, Hillerød, Denmark) and was log2-transformed to somatic cell score (SCS, units).
Spectral data of all samples from 5000 to 900 cm−1 were stored to allow a posteriori application of the available MIRS models to predict MCP, total mineral composition (Visentin et al. Citation2016), and mineral phases (Franzoi et al. Citation2019). Coefficients of determination (root mean square error) in external validation were 0.54 (2.90 min), 0.56 (1.22 min), and 0.52 (9.00 mm) for rennet coagulation time (RCT), curd-firming time (k20), and curd firmness 30 min after enzyme addition to milk (a30), respectively, and 0.67 (122.00 mg/kg) and 0.68 (88.12 mg/kg) for total Ca and total P, respectively.
The models developed by Franzoi et al. (Citation2019) were used for prediction of MP, SP, and the MP to SP ratio (MP/SP) for Ca and P. Briefly, 93 HO samples covering DIM from 6 to 373 were analysed for the content of Ca and P in both SP and MP (Franzoi et al. Citation2018). Calibration models were developed using backward interval partial least squares algorithm, ending up with coefficients of determination (root mean square error in cross-validation) of 0.77 (2.69) mg/100 mL for SP of Ca, 0.76 (5.30) mg/100 mL for MP of Ca, 0.69 (0.36) for MP/SP of Ca, 0.73 (2.56) mg/100 mL for SP of P, 0.73 (4.76) mg/100 mL for MP of P, and 0.68 (0.22) for MP/SP of P. Belay et al. (Citation2017) reported that such accuracies allow the predictions to be considered good estimates of the actual phenotype.
Spectra with Mahalanobis distance greater than three from spectral centroid were considered as outliers. Moreover, observations with predicted values outside the range of the reference data used for calibrations were set to missing to avoid data extrapolation. Traits deviating more than three standard deviations from the corresponding mean were set to missing. Lactations and contemporary groups (herd-test-date, HTD) with less than 5 test-days and 5 cows, respectively, were discarded from the dataset. The final data consisted of 111,653 test-day records of 9519 HO cows in 338 herds.
Variance components and solutions for the fixed effects were estimated in ASReml v4.1 (Gilmour et al. Citation2015) through univariate analyses, and covariance components between the traits were estimated through bivariate analyses. The general form of the linear model, in matrix notation, was:
where y is the vector of dependent variable(s); b is the vector of fixed effects of HTD (n = 10,504), parity (1, 2, 3, 4, and ≥5), and stage of lactation (30 classes); w is the vector of solutions for the random permanent environmental effect of the cow; a is the vector of solutions for the random additive genetic effect of the animal; and e is the vector of random residuals. The incidence matrices X, Zw, and Za linked the corresponding effects to the dependent variable(s) y. Random effects were assumed to be normally distributed with means zero and variance–covariance structures of additive genetic, permanent environmental, and residual effects in the bivariate analyses that were G⊗A, W⊗I, and R⊗I, respectively, where G is the 2 × 2 additive genetic (co)variance matrix, W is the 2 × 2 (co)variance matrix of permanent environmental effects, R is the residual (co)variance matrix, A is the additive genetic relationship matrix among individuals (n = 31,645) which included cows with phenotypic records and 6 generations of ancestors, I is an identity matrix of appropriate order, and ⊗ is the Kronecker product. Heritability (h2), repeatability (t), phenotypic correlation (rp), and genetic correlation (rg) were computed as reported by Costa et al. (Citation2019b).
Assuming a given number of offspring per bull, it is possible to estimate the ratio between correlated (ΔGC) and direct response (ΔG) to selection for a specific trait (y). This is of interest whether two traits (x and y) are correlated, and genetic selection is already in progress for a trait x (Syrstad Citation1970). For the calculations of this study, the number of offspring per bull was set to 70 in the formula:
where i is the selection intensity; rg is the genetic correlation between x and y; n is the number of daughters with information;
is the heritability of trait x (i.e., MIRS-predicted minerals in the present paper); and
is the heritability of trait y.
Results and discussion
Average MY and composition (Table ) agreed with official national statistics of Italian HO breed (AIA Citation2020). As regards mineral traits, de la Fuente et al. (Citation1996) reported that MP/SP of Ca and P are strongly affected by the method used for their quantification. Previous studies reported values of MP/SP for Ca that ranged from 2.20 to 2.68 w/w, using filtration methods (Holt and Jenness Citation1984; de la Fuente et al. Citation1996; Malacarne et al. Citation2014), and 4.06 w/w based on rennet coagulation procedure (de la Fuente et al. Citation1996). The MP/SP of P (1.55 w/w) was very close to the value of 1.45 w/w obtained on 12 milk samples by de la Fuente et al. (Citation1996), but higher than values (0.80–1.26 w/w) reported in other studies using different quantification methods (Holt and Jenness Citation1984; de la Fuente et al. Citation1996; Malacarne et al. Citation2014). For the present study, calibrations were developed from reference data using a modified version of the rennet coagulation procedure (Franzoi et al. Citation2018) and thus results intermediate to those available in the literature were somehow expected.
Table 1. Mean, range, and coefficient of variation (CV) of milk yield and quality traits, mineral fractions, and coagulation properties predicted by mid-infrared spectroscopy.
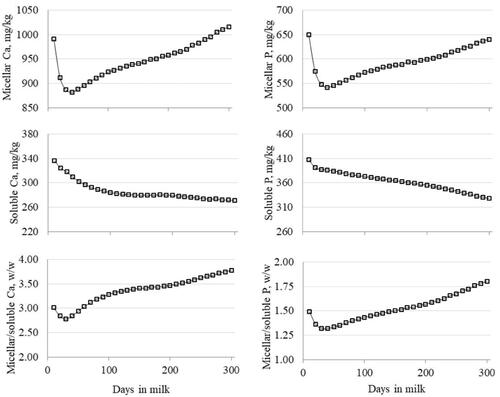
All the fixed effects included in the statistical model significantly affected the variation of Ca and P in MP and SP (p<.001). The greatest MP/SP was observed in first-parity cows for Ca and in second-parity cows for P (Figure ). The MP of Ca and P decreased from parity 1 to parity ≥5, whereas the SP of Ca had an opposite trend to that of P (Figure ). The increase of Ca SP with parity order was likely due to a reduction of casein and thus to a shift of the equilibrium to the SP. The pattern of Ca and P in MP across DIM (Figure ) resembled the typical lactation curve of F% and P%. Ca and P in SP decreased from early to late lactation; as a result, the MP/SP of both minerals decreased during the first 30 DIM and increased thereafter.
Figure 1. Effect of parity on micellar and soluble phases of Ca and P, and their ratio.
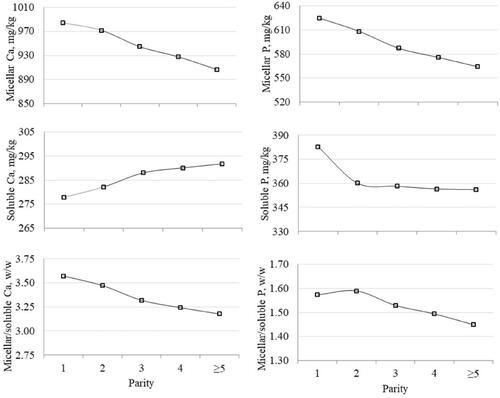
Figure 2. Effect of lactation stage on micellar and soluble phases of Ca and P, and their ratio.
In this study, h2 and t of MIRS-predicted MP, SP, and MP/SP of Ca and P from univariate analyses averaged 0.520 and 0.630, respectively, and they were very close to estimates from bivariate models (Table ). Heritability of mineral phases mirrored that of P% (0.469 ± 0.014) and it was greater than h2 of F% (0.356 ± 0.011). The lowest h2 was estimated for MP/SP of P (0.472 ± 0.013). Costa et al. (Citation2019a) reported h2 of 0.423, 0.430, 0.446, and 0.531 for MIRS-predicted P%, casein percentage, total Ca, and total P, respectively, in Italian HO. Similarly, in the same population, Visentin et al. (Citation2019) estimated average h2 of 0.540 and 0.420 for MIRS-predicted Ca and P, respectively. Apart from the MP/SP of P, the t of other Ca and P fractions was greater than 0.600, suggesting that few predicted records are adequate to explain the variability of the phenotype and get reliable estimates of cows’ mean and breeding values for the phenotype itself.
Table 2. Additive genetic variance (σ2a), permanent environmental variance (σ2w), heritability (h2), and repeatability (t) of Ca and P phases from univariate analysesa, and average, minimum and maximum heritability estimates from bivariate analyses.
The strongest and weakest rp were estimated between the two MP (0.896 ± 0.002) and between the two SP (–0.132 ± 0.008), respectively. As regards rg, the MP and MP/SP of Ca were positively strongly correlated with MP and MP/SP of P, and for both minerals the SP was negatively genetically associated with the MP and the ratio (Table ). The strong relationship between MP of Ca and MP of P is likely attributable to their complementary and structural role in casein micelle, whereas the weak association between SP of Ca and SP of P suggests that they have different genetic background. Moreover, within mineral, the MP was negatively genetically correlated with the SP, meaning that it is possible to adopt selection strategies to shift mineral equilibrium according to the desired objective. In particular, from cheesemakers’ point of view, a shift to MP is preferred.
Table 3. Phenotypic (below diagonal) and genetic correlationsa (above diagonal) between Ca and P phases and their ratio.
The rp and rg of MIRS-predicted minerals fractions with MY, P%, PY, F%, FY, SCS, and MCP are displayed in Table . The MP of Ca and P was negatively genetically associated with MY, whereas the rg between MY and SP was 0.277 ± 0.036 in the case of Ca and close to zero in the case of P. As a result, the MP/SP of Ca and P was negatively associated with MY. However, the ratio was positively genetically associated with PY and FY for both Ca and P. In general, the negative correlation between MP and MY confirms the lower concentration of micellar Ca and P in high-producing cows, in accordance with studies that dealt with rg and rp of MY with P% and casein content (Cassandro et al. Citation2008). The MP of both minerals was positively associated with P% and F%, both phenotypically and genetically (Table ), which is favourable for milk destined to produce cheese. Correlations of predicted Ca and P fractions with SCS were weak or close to zero (Table ). Finally, all fractions of Ca and P were favourably associated with RCT, except for SP of P, while MP and MP/SP of both minerals were favourably correlated with k20 and a30 (Table ).
Table 4. Phenotypic (rp) and genetic (ra) correlationsa of milk Ca and P phases (mg/kg) and their ratio (w/w) with yield and quality traits, and coagulation properties.
An indirect favourable selection for the MP of Ca and P likely exists in the Italian HO, since the official selection index emphasises P% (3%), PY (36%), F% (2%), and FY (8%), and does not place any weight to MY (ANAFIJ Citation2019). Supporting this, in the case of P% the ratio between ΔGC and ΔG was 0.65 for Ca and 0.80 for P; in the case of PY, the ratio was 0.23 for Ca and 0.21 for P. Such results based on MIRS-predicted traits, suggested that an indirect selection for MP of both minerals seems to be currently present and favourable. As expected, for both minerals, indirect selection based on P% or PY was less efficient than direct selection on the MP itself.
Conclusions
In the present study, MIRS-predicted micellar and soluble fractions of Ca and P showed exploitable genetic variation and were associated with traits of interest for the dairy industry. The current selection index of Italian Holstein places positive emphasis on protein yield and content thus, according to the findings obtained for the MIRS-predicted traits, this is expected to indirectly increase the micellar Ca and P and to favourably affect milk coagulation ability. Future studies should investigate the feasibility of enhancing the robustness of MIRS models to predict minerals fractions. This could be achieved by increasing the reference dataset and testing different prediction algorithms. Having a larger dataset would allow to assess genetic correlations between measured and predicted phenotypes, and corroborate the use of such predictions for management and breeding purposes.
Acknowledgments
The South Tyrolean Dairy Association (Bolzano, Italy), the Breeders Association of Bolzano Province (Bolzano, Italy), and the Italian Holstein and Jersey Breeders Association (Cremona, Italy) are gratefully acknowledged for providing data used in this study.
Ethical approval
The approval of the Ethical Committee for the Care and Use of Experimental Animals was not required for this study because the data were extrapolated from an existing database.
Disclosure statement
This article has been accepted for publication in Italian Journal of Animal Science, published by Taylor & Francis. The authors are fully responsible for the content of the manuscript and declare that there is no conflict of interest associated with the paper.
References
- AIA 2020. Bollettino online. [accessed 2021 March 29]. http://bollettino.aia.it/.
- ANAFIJ 2019. Index calculation cards. [accessed 2021 March 30]. http://www.anafi.it/it/indici-genetici/schede-di-calcolo-indici.
- Belay TK, Dagnachew BS, Kowalski ZM, Ådnøy T. 2017. An attempt at predicting blood β-hydroxybutyrate from Fourier-transform mid-infrared spectra of milk using multivariate mixed models in Polish dairy cattle. J Dairy Sci. 100(8):6312–6326.
- Benedet A, Costa A, De Marchi M, Penasa M. 2020. Heritability estimates of predicted blood β-hydroxybutyrate and nonesterified fatty acids and relationships with milk traits in early-lactation Holstein cows. J Dairy Sci. 103(7):6354–6363.
- Cassandro M, Comin A, Ojala M, Dal Zotto R, De Marchi M, Gallo L, Carnier P, Bittante G. 2008. Genetic parameters of milk coagulation properties and their relationships with milk yield and quality traits in Italian Holstein cows. J Dairy Sci. 91(1):371–376.
- Chessa S, Bulgari O, Rizzi R, Calamari L, Bani P, Biffani S, Caroli AM. 2014. Selection for milk coagulation properties predicted by Fourier transform infrared spectroscopy in the Italian Holstein–Friesian breed. J Dairy Sci. 97(7):4512–4521.
- Costa A, Lopez-Villalobos N, Visentin G, De MM, Cassandro M, Penasa M. 2019a. Heritability and repeatability of milk lactose and its relationships with traditional milk traits, somatic cell score and freezing point in Holstein cows. Animal. 13(5):909–916.
- Costa A, Visentin G, De Marchi M, Cassandro M, Penasa M. 2019b. Genetic relationships of lactose and freezing point with minerals and coagulation traits predicted from milk mid-infrared spectra in Holstein cows. J Dairy Sci. 102(8):7217–7225.
- de la Fuente MA, Fontecha J, Juárez M. 1996. Partition of main and trace minerals in milk: effect of ultracentrifugation, rennet coagulation, and dialysis on soluble phase separation. J Agric Food Chem. 44(8):1988–1992.
- De Marchi M, Toffanin V, Cassandro M, Penasa M. 2014. Invited review: mid-infrared spectroscopy as phenotyping tool for milk traits. J Dairy Sci. 97(3):1171–1186.
- Franzoi M, Niero G, Penasa M, Cassandro M, De Marchi M. 2018. Technical note: development and validation of a new method for the quantification of soluble and micellar calcium, magnesium, and potassium in milk. J Dairy Sci. 101(3):1883–1888.
- Franzoi M, Niero G, Penasa M, De Marchi M. 2019. Development of infrared prediction models for diffusible and micellar minerals in bovine milk. Animals. 9(7):430.
- Gilmour AR, Gogel BJ, Cullis BR, Welham SJ, Thompson R. 2015. ASReml User Guide. Hemel Hempstead, UK: VSN Int Ltd.; p. 364.
- Górska-Warsewicz H, Rejman K, Laskowski W, Czeczotko M. 2019. Milk and dairy products and their nutritional contribution to the average polish diet. Nutrients. 11(8):1771.
- Grelet C, Dardenne P, Soyeurt H, Fernandez JA, Vanlierde A, Stevens F, Gengler N, Dehareng F. 2021. Large-scale phenotyping in dairy sector using milk MIR spectra: key factors affecting the quality of predictions. Methods. 186:97–111.
- Holt C, Jenness R. 1984. Interrelationships of constituents and partition of salts in milk samples from eight species. Comp Biochem Physiol A Comp Physiol. 77(2):275–282.
- Juhl HV. 2017. Method for compensating amplitude drift in a spectrometer and spectrometer performing said method [accessed 2021 March 29]. https://patents.google.com/patent/US9606050/en?oq=Method+of+standardizing+a+spectrometer.
- Malacarne M, Franceschi P, Formaggioni P, Sandri S, Mariani P, Summer A. 2014. Influence of micellar calcium and phosphorus on rennet coagulation properties of cows milk. J Dairy Res. 81(2):129–136.
- Malacarne M, Visentin G, Summer A, Cassandro M, Penasa M, Bolzoni G, Zanardi G, De Marchi M. 2018. Investigation on the effectiveness of mid-infrared spectroscopy to predict detailed mineral composition of bulk milk. J Dairy Res. 85(1):83–86.
- Soyeurt H, Bruwier D, Romnee J-M, Gengler N, Bertozzi C, Veselko D, Dardenne P. 2009. Potential estimation of major mineral contents in cow milk using mid-infrared spectrometry. J Dairy Sci. 92(6):2444–2454.
- Syrstad O. 1970. Estimating direct and correlated response to selection. A note for clarification. Acta Agric Scan. 20(3):205–206.
- Visentin G, Niero G, Berry DP, Costa A, Cassandro M, De Marchi M, Penasa M. 2019. Genetic (co)variances between milk mineral concentration and chemical composition in lactating Holstein–Friesian dairy cows. Animal. 13(3):477–486.
- Visentin G, Penasa M, Gottardo P, Cassandro M, De Marchi M. 2016. Predictive ability of mid-infrared spectroscopy for major mineral composition and coagulation traits of bovine milk by using the uninformative variable selection algorithm. J Dairy Sci. 99(10):8137–8145.