
 ?Mathematical formulae have been encoded as MathML and are displayed in this HTML version using MathJax in order to improve their display. Uncheck the box to turn MathJax off. This feature requires Javascript. Click on a formula to zoom.
Abstract
Seven non-linear growth models were compared in the Andalusian turkey, an endangered native breed. To this aim, turkeys were weekly weighted until they reached 35 weeks. The goodness-of-fit and flexibility criteria of Brody, Von Bertalanffy, Verhulst, Logistic, Gompertz, Richards, and Sinusoidal growth models were evaluated to quantify their ability to describe the biological growth curve. Goodness-of-fit criteria were assessed comparing the mean squared error (MSE) and adjusted determination coefficient (Pseudo-R2), while the flexibility criteria of Akaike (AIC) and Bayesian information criteria (BIC) were evaluated to quantify the explanatory and predictive ability of the models tested. Afterward, all criteria were considered in a combined index to determine the most efficient model to describe and predict growth patterns. The best-fitting model for males growth was Logistic (MSE: 250,349.87; Pseudo-R2: 0.97) which also reported the best explanatory and predictive properties (AIC: 18,949.25; BIC: 18,963.24), while best goodness-of-fit criteria, explanatory and predictive capacity in females were reported for the Richards model (MSE: 144,432.45; Pseudo-R2: 0.95; AIC: 17,529.83; BIC: 17,549.02, respectively). Von Bertalanffy and Richards models underestimated the weight at early age stages, contrary to Logistic and Verhulst models. The asymptotic weight was higher in males than in females at all evaluated models, being 11,085.37 g for Logistic and 5,706.38 g for Richards, respectively. In conclusion, a marked sexual dimorphism is evident, with females reaching maturity earlier than males. The higher inflection point in males may enable their relatively easier commercial standardisation than in turkey hens.
Logistic was the best fitting model for males' growth and Richards for females.
Females reach maturity earlier than males with higher rates of maturity.
Andalusian turkey breed shows an intense sexual dimorphism.
Highlights
Introduction
The Andalusian turkey is an endangered Spanish native turkey breed distributed across the Southeast of Iberian Peninsula. As described by Canales Vergara et al. (Citation2019), Andalusian turkeys probably descend from the first imported turkeys from Mexico in the early sixteenth century, during the colonisation period, when conquerors disembarked them in the port of Seville (Spain) upon their arrival in the Old World to then distribute these animals across the villages flanking the Guadalquivir river (Fernández et al. Citation2009). Nowadays its breeding and husbandry practices related are generally limited to rural areas of Andalusia and Extremadura, where Andalusian turkeys are mainly raised under semi-grazing conditions by backyard producers, taking advantage of their high rusticity, paired with their lightness and agility which confers them a high capacity to feed themselves by foraging the brush for insects and vegetation, diminishing their supplementary food intake requirements. The Andalusian turkey is mainly characterised by its black and roan feather patterns. Traditionally, a meat aptitude has been ascribed to the breed. However, by-product production of eggs weighing between 81 and 86 g (Arando et al. Citation2019) is regarded as an extra contribution to the familiar economy, out of the breeding season.
However, during the twentieth century, like many other native breeds, their populations significantly decreased as a consequence of the introduction of commercial hybrid lines, which displaced them, and in many cases, derived in the hybridisation seeking improved production parameters (González-Ariza et al. Citation2019).
One of the main differences between native turkey breeds and commercial meat-type turkey lines is the bodyweight that individuals reach, which is approximately about two or three times lower in native breeds (10 kg in Andalusian male turkey; 5–6.8 kg in Mexican backyard male turkeys and 20 kg in commercial line males) (López-Zavala et al., Citation2008; Zampiga et al. Citation2019). These bodyweight variations are usually associated with low growth rates and worst feed conversion in native breeds (Mata-Estrada et al. Citation2020). However, native turkey breeds have developed a genetic resistance to some diseases as a consequence of greater diversity which provides them with greater resistance than commercial lines (Kamara et al. Citation2007; Camacho‐Escobar et al. Citation2008), since heterogeneous populations are less susceptible to viral infections (Mpenda et al. Citation2019). In addition, in the last years, there has been an increasing interest in food produced under environmentally sustainable conditions, for which native breeds have a great potential (Nogales et al. Citation2017).
Animal growth is defined as the changes in volume, size, or shape over time until individuals reached maturity (Ulutas et al. Citation2010). Growth can be represented using models which provide the opportunity to mathematically describe growth patterns, with biologically interpretable parameters which have become a useful tool to estimate growth evolution at different ages (Lupi et al. Citation2015). Besides, growth parameters are highly heritable (Narinc et al. Citation2014; Kaplan et al. Citation2016). Growth describes a sigmoid-type curve with three differentiated stages until mature weight is reached: initial slow growth, steady acceleration, and an afterward period of deceleration (Lawrence et al. Citation2012).
In addition, fitting growth curves to growth functions not only allows to determine different management factors, such as the most suitable slaughtering age, sexual maturity age, health status, dairy dietary requirements but also it helps to measure the effect of selection on growth traits (Sariyel et al. Citation2017; Mata-Estrada et al. Citation2020).
As described by Narinc et al. (Citation2017), the most widely used functions to model the poultry growth performance are Gompertz, Logistic, Richards, and Von Bertalanffy models and have been applied to fit growth in different species, such as guinea fowl (Nahashon et al. Citation2006), partridge (Sariyel et al. Citation2017), chicken (Mata-Estrada et al. Citation2020), ostrich (Ramos et al. Citation2013), quail (Narinc et al. Citation2010), and turkey (Porter et al. Citation2010).
Considering interspecies variability together with the characteristics and limitations of each particular non-linear growth model, it is necessary to carefully assess goodness-of-fit criteria to determine which best model to define the growth performance is. Furthermore, since growth has been reported to be affected by sex, breed, diet, lighting program, or rearing period (Farghly et al. Citation2018; Ciurescu et al. Citation2020; Van Staaveren et al. Citation2020), additional factors must be considered.
Therefore, the present study aimed to evaluate goodness-of-fit and flexibility criteria in seven growth models to determine the non-linear function that best describes and predicts the growth patterns of the Andalusian turkey.
Materials and methods
Animal data and management
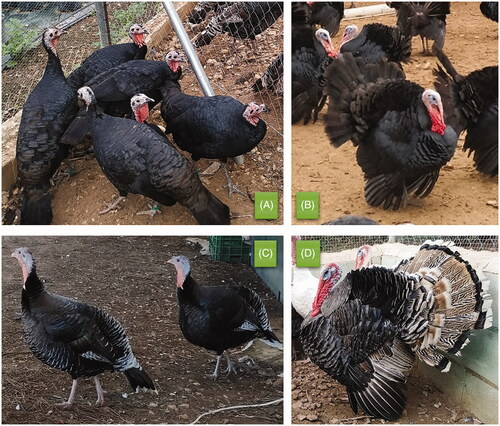
This study was conducted in the Agropecuary Provincial Centre of Diputacion of Cordoba (Spain, 37°54′50.9″N–4°42′40.4″W). The eggs used in the study were obtained from the Andalusian Turkey base population (Figure ) comprising in the conservation program of the breed (18 female and three male, reared in three different groups and whose ages ranged from 12 to 16 months). Base population animals were randomly collected from the backyards of rural areas around Andalusia to gather and maintain the highest levels of diversity considering that the severe endangerment status of the Andalusian turkey population.
Figure 1. Andalusian turkey breed males and females according de feather colour. (A) Black female; (B) Black male; (C) Roan female; (D) Roan male.
The eggs were daily collected during the breeding season (February to April 2019) and were stored at 17 °C and 85% of humidity until they were placed in the incubator (7 days maximum since collection). The eggs were incubated for 26 days in an incubator (Masalles, M240-I, Barcelona, Spain) at 37.2 °C, 55% humidity, and followed an automatic turning programme. On the 26th day of incubation, all eggs were placed in a tray at the hatchery cabinet (Masalles, 25-N HLC, Barcelona, Spain) maintained at 36.7 °C and 60% of humidity until hatching (two more days).
Considering the low egg production rate of turkey hens, four different incubations were performed to ensure that a sufficient number of eggs was obtained for the present study. A total of 140 eggs were incubated out of which 116 finally hatched (58 for each sex) and were considered in the study. Animals were wing-banded and individually weighed for the whole period during which the study took place. As a result, 3,000 observations were obtained once the database was filtered. The data file was purged and values that were twice the standard deviation above and below the average weight were removed to ensure normality of residuals assumption was met (Lupi et al. Citation2015). As a result of this purging process, data of 98% of the total animals was considered for the statistical analyses performed in the study. As suggested by Pizarro et al. (Citation2019), normality was tested on all the observations, but also across the individuals of the same life status (age group or productive moment). Each bird was weighed at hatching and weekly until it reached 35 weeks of life using an electronic balance (measurement precision = 0.01 g, Cobos, CSB-600C, Barcelona, Spain) for birds weighing up to 600 g. For animals exceeding this weight (>600 g), a suspended electronic balance was used (measurement precision = 5 g, Kern CH50K100, Kern & Sohn, Balingen, Germany). The birds were subjected to the hatchery prophylaxis procedure (Newcastle, fowl pox, chronic respiratory disease, and fowl cholera vaccines). Electric heaters (Copele LGA, Copele, Murcia, Spain) were placed in the room where the animals were hosted for their first six weeks of life to help them to regulate body temperature. Afterward, turkeys were free-ranged (temperature, humidity, and photoperiod) until the end of the experimental period, which lasted for 35 weeks on the whole.
Food and water supplies were provided ad libitum. However, animals were supplemented with two different commercial diets depending on their physiologic status as reported in Table . A starter diet was supplied for the first four weeks, while a grower diet was provided to the animals from the end of the fourth week until the experimental period finished. Animal management was conducted by European Union Direction regulations (2010/63/EU) as transposed to Spanish Royal Decree Law 53/2013. The study protocol was submitted to a legally constituted ethics committee and deemed exempt from review (The Ethics Committee of Animal Experimentation of the University of Cordoba, Spain).
Table 1. Recipe and chemical composition of experimental diets.
Model development
Table presents the functions for the seven non-linear models selected in the present study which were namely; Richards, Brody, Logistic, Verhulst (a variant of Logistic model), Gompertz, Sinusoidal, and Von Bertalanffy (Ersoy et al. Citation2006; Nogales et al. Citation2017; Kuhi et al. Citation2019). The fitting procedure was developed using multiple observations of the dependent variable (weight) for each point of the independent variable (day of life). The assumption of residuals normality was tested using Shapiro–Wilk Francia’s tests (recommended for samples from 50 < n < 2,500) with StataCorp Stata version 14.2 (StataCorp, College Station, TX). Autocorrelation analysis was performed by testing the Durbin-Watson method. Residual values derive from the difference between observed and predicted values. Well-fitted models do not describe variable patterns when the residuals are plotted against the fitted values. If the variance of the residuals is non-constant then the residual variance is said to be heteroscedastic. Durbin Watson and Scatter plots were performed using SPSS Statistics for Windows statistical program, Version 25.0.
Table 2. Mathematical description of growth models, biological parameters and growth evaluators.
Weight data were used to fit growth models. Due to the detection of high numbers of outliers, Pseudo-R2 was used to correct for the potential inflation of variance explanatory ability to avoid the use of data that may distort the results (Lupi et al. Citation2015). The curve shape parameters considered (three for all models except from Richards model with four) were as follows: ‘a’, mature or asymptotic weight reached when time tends to infinity; ‘b’, integration constant that allows to calculate the inflexion age, that allows to calculate the inflexion age; ‘k’, which represents the exponential growth rate and ‘m’ which denotes the shape of the growth curve and determines the inflection point, when the animal starts the auto-deceleration stage until it reaches adult (Darmani Kuhi et al. Citation2010). For the sinusoidal model, parameters were: ‘a1’, weight at inflexion; ‘a2’, the overall rate parameter of the total growth development; ‘θ’, the phase shift (Kuhi et al. Citation2019). The most appropriate model was chosen as suggested by Lupi et al. (Citation2015) and Pizarro et al. (Citation2020a ) considering the following best fitting and flexibility criteria:
The lowest value of mean square error (MSE) for each corresponding function, as a measure of the variability of other potentially non-considered factors.
The highest value of the adjusted determination coefficient (Pseudo-R2), taking into account that the determination coefficient (R2) in non-linear models could overestimate results (Lupi et al. Citation2015). Pseudo-R2 can be computed as:
The lowest value of the Akaike information criterion (AIC). This coefficient was estimated as AIC = n * ln (SSE/n) +2p, where n is the number of observations; SSE is the sum of squares of the error and p is the number of parameters + 1. AIC coefficient estimates variations in the quality of fit for present data and the differences in the number of parameters between both models.
The lowest value of Bayesian information criterion (BIC, Leonard and Hsu Citation2001), which is a model-order selection criterion:
where n is the number of observations; SSResidual is the sum of squares of the residuals and k is the number of parameters.
The goodness-of-fit criteria of Pseudo-R2, MSE, and the flexibility criteria, of AIC and BIC were individually considered and used to rank the seven fitting models depending on their best performance. Those models presenting a higher ability to capture data variability (Pseudo-R2) and better explanatory (AIC) and predictive properties (BIC and MSE) scored higher in the rank. Computationally, those models presenting the lowest scores for AIC, BIC, and MSE, and the highest scores for Pseudo-R2 presented higher scores in the rank. When the same value for a specific criterion was reported for two or more models, these were ranked equally.
Afterward, as goodness-of-fit and flexibility criteria may differ in terms of which their most desirable values are and what their magnitude is, a combined selection index (ICO) was developed following the premises in Van Vleck (Citation1993) to summarise the position in the rank for each of the goodness-of-fit and flexibility criteria determined for each model. The combined index used (ICO) was as follows:
where, W1: the weight for Pseudo-R2 rank position; W2: the weight for MSE rank position; W3: the weight for AIC rank position;W4: the weight for BIC rank position. All criteria were given the same relevance in the ICO, hence, no coefficient was used, that is the proportion of 1: 1: 1: 1 was followed. The model presenting superior ICO values was selected as a model with the best fitting, explanatory and predictive properties.
Statistical analysis
NLIN procedure of the SAS statistical package (v. 9.0 software, SAS Institute Inc., Cary, NC, USA) was used for data processing, using individual observations to fit the population and considering the Marquardt iterative method as the estimation procedure to reduce the residuals and improve the goodness-of-fit.
Results
Residuals for growth observations of all animals and animals of the same age were normally distributed (p > .01) and heteroscedastic p < .01). Consequently, fitting non-linear regression models were suggested as the most appropriate approach. A summary of the results derived from biological curve data model fitting and flexibility criteria evaluation is reported in Table . As it can be observed, the adjusted determination coefficient (Pseudo-R2) was slightly higher in males than in females across all studied models, with similar values being reported between models within each sex, except for the Brody model, for which the results are lower. After the goodness-of-fit and flexibility criteria were considered and the ICO index was used to rank the models, the best goodness-of-fit criteria were reported for Richards model in the case of females, while for males, the best goodness-of-fit criteria were reported by the Logistic model. For males, Gompertz model offered similar Pseudo-R2 values to those reported by Logistic model, however, MSE, AIC, and BIC values in the later were slightly higher, while the Richards model did not converge with data. Similarly, the Sinusoidal model did not converge for both sexes and was discarded.
Table 3. Biological growth curve estimation parameters for each model by sex in Andalusian turkey.
In regards to curve shape parameters present in the mathematical expressions, mature or asymptotic weight ‘a’ was higher in males than in females in all evaluated models, being 11,085.37 and 5,553.76 g, respectively, when best-fitting models were considered. However, the ‘a’ values obtained when Brody model was fitted did not report any coherence with the observed weights, hence this model was discarded.
With respect to the ‘b’ parameter, in terms considerably higher values were generally observed in Verhulst model. By contrast, ‘k’ parameter values were higher for females in all studied models.
The observed and predicted weights for the different models fitted are presented in Figure . As it can be appreciated, observed weights of males were higher than those of females, except for hatching (58.7 and 59.7 g, respectively). Predicted weights by Richards model (Figure ), underestimated females weight at early stages (14.1 g at hatching and 40.3 g at day 7), same as Von Bertalanffy model (0 g at hatching and 5.5 g at day 7 for females and 1 g at hatching and 15.3 g at day 7 for males), By contrast, the Logistic and Verhulst models overestimated weight at early stages (Figure ). Contrarily, when mature predicted and observed weights were compare, all models overestimated these weights, except Verhulst model for males.
Figure 2. Growth curves for both sexes of Andalusian turkey breed, observed and predicted with each model (F: female; M: male).
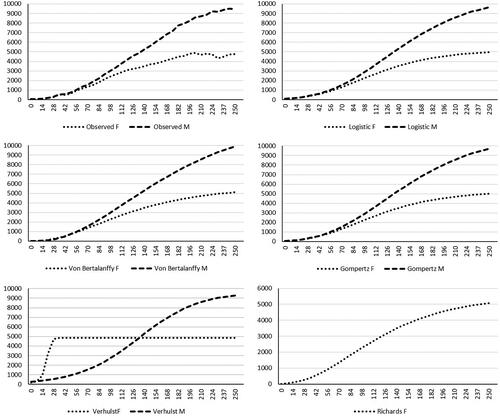
Finally, information about the inflection weight and age, and the growth rate at this specific moment for the studied models are presented in Table . Considering the most appropriate models, the inflection point was achieved at 12 weeks (83.68 days) and 1,798.26 g in females and 20 weeks (144.08 days) and 5,542.69 g in males, observing a difference in the time to reach an inflection weight of 61 days between both sexes.
Table 4. Inflection weight, inflection age and growth rate at the inflection point of fitting models for the biological curve of Andalusian turkey breed.
Discussion
Model choice decision rationale
Non-linear models have been widely contrasted as suitable methods to fit for growth in turkey hens and sires (Porter et al. Citation2010; Pérez-Lara et al. Citation2013; Segura-Correa et al. Citation2017). However, other alternatives, such as mixed models with random and fixed effects, have been formerly suggested in the literature to fit for the same aim (Testik et al. Citation1999). Mixed models (random and fixed) have several desirable properties, but their use needs to stick to certain assumptions (El Halimi Citation2005).
As suggested by Harrison et al. (Citation2018), mixed models, either it is using fixed or random effects, need at least five ‘levels’ (groups) for a random intercept term to achieve robust estimates of variance. This was also supported by Gelman and Hill (Citation2007) and Harrison (Citation2015), who suggested the fact that fixed or random effects, with lower than five levels may not accurately estimate between population variance, due to variance estimate collapsing to zero, which in turn makes the model equivalent to non-linear modelling (Gelman and Hill Citation2007) or be non-zero, but incorrect when the small number of levels (groups) from which samples were taken is not representative of the true distribution of means. This was also addressed to be a potential source for variance and covariance distortion as a direct consequence of too few levels of a fixed or random effect as suggested by (Silk et al., Citation2020). Furthermore, fixed effects are generally inconsistent in the non-linear model as n grows (Newey Citation2007). This rationale may make it compulsory to apply integration methods, such as the adaptive Gaussian Quadrature method to prevent distortion from occurring (Afrouziyeh et al. Citation2021), which in turn increases the complexity of the methods used.
In our study, sex only accounts for two levels, strongly preventing against the use of non-linear mixed (random) models due to the aforementioned reasons. Sex must be considered a fixed effect rather than a random effect. In this context, randomising sex may lead to model degeneracy, biased estimation of random effect variance, inaccurate estimation of random effect variance, and high error potential for questions related to random effects. The random effects of other factors, such as the animal, could have been considered as well. However, as the same animals were repeatedly measured along the course of the study, those random effects corresponding to the same animal are correlated, hence, this acts against the fulfillment of the independence of observations assumption (Chan and Kuk Citation1997). As a result, and given the only additional factor considered was sex and animals were measured repeatedly, we decided to run non-linear procedures for both levels (male and females) separately.
Second, the present study aims to serve as a model for the evaluation of growth in native turkey populations. Randomly mixed models can be unstable if sample sizes across groups are highly unbalanced, which is likely to occur in native poultry populations for which sex censuses may be highly skewed, with male groups containing very little data or for which female/male ratio favours one of the sexes as it has been reported in the literature (Mata-Estrada et al. Citation2020; González-Ariza et al. Citation2021), for which separate sex modellisation has been suggested the most appropriate alternative.
Third, although fitting a factor as a fixed effect may provide a statement of the significance variation (differences across groups) in a relatively easy manner, testing differences among levels of a random effect is much more difficult for frequentist analyses, which may call for the application for Bayesian inference approaches to be considered (Kéry Citation2010). Last but not least, incorrect parameterisation of the random effects in the model could yield unreliable model estimates. Among others, failing to identify dependency structures, that is meet the assumption of non-independence (multiple clutch measures from a single bird), failing to specify random slopes to prevent constraining slopes of predictors to be identical across clusters in the data (Barr et al. Citation2013); and testing the significance of fixed effects at the wrong level may eventually lead to pseudoreplication and inflated Type I error rates which could be prevented by using residual degrees of freedom for fixed effects.
As above explained, non-linear models were chosen to fit for the time evolution of growth in male and female turkeys. No additional term was considered in the model, such as sex as a fixed effect, but sexes were modelled separately. The different models used comprised a variable number of curve shape parameters, thus they differed in terms of model complexity. The number of parameters considered in a model and the nature of its mathematical function may indeed be responsible for the better fitting properties of certain models against others as suggested by Pizarro et al. (Citation2020a, Citation2020b). Consequently, and given ICO was used to sort models depending on their better fitting and flexibility properties, the discussion was divided into the following two sections.
Fitting and flexibility criteria model comparison
The present results agree with those in Ersoy et al. (Citation2006), who reported Richards model to be the best-fitting model for turkey growth. Ersoy et al. (Citation2006) suggested male turkeys matured more slowly and reached mature body weight later than female turkeys. Determination coefficient values were high (>0.98) but slightly differed across sexes. The same authors reported residual mean square error (RMSE) to be higher for male turkeys, for which a lower record number was used. By contrast, Richards model fails to converge for males in the present study, which resembles which was previously reported by other authors, such as Segura-Correa et al. (Citation2017), for male and female hybrid turkeys and Porter et al. (Citation2010) for turkey hens who considered larger samples during longer study periods. This suggests sample limitations in the aforementioned studies may have been a source for erroneous convergence in Richards model.
The Sinusoidal model did not converge for both sexes in the present study, even if contextually, recent studies conducted in turkeys have reported the Sinusoidal model to be the best-fitting model for growth (Kuhi et al. Citation2019). These differences may be a consequence of the properties of the data that was used, since Kuhi et al. (Citation2019) used average values, while in the current study, the results were obtained from individual observations taken from the studied population.
Recent studies in turkeys reported better fitting properties, such as for Morgan Mercer Floding, polynomial regression, or Von Bertalanffy (Porter et al. Citation2010; Pérez-Lara et al. Citation2013; Segura-Correa et al. Citation2017). Such differences may derive from the specific growth patterns described by the species used in each particular case, breeds considered, or the rearing period during which the study took place (Segura-Correa et al. Citation2017).
Observed and predicted curve shape parameter comparison
Asymptotic weight (‘a’) in Andalusian turkeys was around 50% lower in females at 35 weeks of age, which suggested an intense sexual dimorphism across sexes, with females maturing faster than males, respectively. Similarly, recent studies reported the same trend in native Mexican bronze turkeys at 22 week of age. Specifically, a female’s body weight was reported to be 75% lower than that of male turkeys at the same age. (Pérez-Lara et al. Citation2013). The same trend was reported for mature weight, with it being 50–85% lower in females than in males.
In addition, native breeds’ weights at 35 weeks (5,553.76 and 11,085.37 g, for females and males, respectively) were lower than those of hybrid genotypes (14.63 and 25.88 g, at 22 weeks for female and males, respectively) (Segura-Correa et al. Citation2017). Higher mature weights in hybrid genotypes may be a consequence of intensive genetic selection.
As it can be inferred from the results, ‘a’ values when Brody model was fitted did not agree with observed values, hence the model was discarded. This could have been expected as Brody model has been addressed to be effective when describing growth patterns when growth rate starts at a maximum point to then decrease.
In this regard, recent studies have reported Brody model not to converge (Segura-Correa et al. Citation2017), which suggested this model not to be appropriate to estimate growth performance in turkeys. Similarly, Brody model has been deemed as inappropriate to fit for growth performance in other species (Lupi et al. Citation2015). Conversely, Brody model may be rather efficient to accurately predict growth in other species at older ages (Gómez et al. Citation2007), such as cattle (Nogales et al. Citation2017).
Most of the models used to fit for growth in poultry, are asymptotic and have a sigmoid structure (Yang et al. Citation2006). Brody model was typically exponential, while Gompertz, Logistic, Von Bertalanffy and Richards models are classical sigmoid functions (Gbangboche et al. Citation2008; Ware and Power Citation2017). Growth accelerates during the early stages of life, thus a greater increase in weight occurs which progressively decreases as the animal approaches adulthood. As a result, when the growth curve is graphically described, an ascending sigmoid line can be observed.
In this regard, the growth rate becomes altered as the animal reaches its adult size, which translates into an appreciable change in curve shape where the highest growth rate occurs (inflection point). Afterward, the growth rate decreases and stabilises describing a continuous trend, which mathematically coincides with a horizontal asymptote (Narinc et al. Citation2017; Nogales et al. Citation2017).
Von Bertalanffy presented the highest ‘a’ values for both sexes, while Verhulst reported the lowest ones. Similar results were reported by Segura-Correa et al. (Citation2017), who observed higher mature weights when Von Bertalanffy model was fitted. By contrast, Şengül and Kiraz (Citation2005) described higher ‘a’ values when Verhulst model was used. Verhulst model presented higher values of ‘b’ parameter as previously reported by Segura-Correa et al. (Citation2017).
Another evidence for sexual dimorphism in turkeys was the maturity rate ‘k’ found in our study. Higher values of ‘k’ are indicative of turkeys reaching maturity earlier. As described by several authors and agreeing with the results derived from the present study, the highest values for ‘k’ parameter were reported in females (0.0296) and males (0.0265) in this study when Verhulst model was fitted, while the lowest values were reported for Von Bertalanffy model (0.0130 and 0.0094, for females and males, respectively) (Şengül and Kiraz Citation2005; Segura-Correa et al. Citation2017).
When Andalusian turkey’s observed weights at 35 weeks of age were compared to those in other native breeds, such as Mexican bronze turkeys (hatching weight 46.7 g males/43 g females; mature weight 5,827 g males/3,487 g females), hatching and mature weights were higher (58.7 g males/59.7 g females; 9,465 g males/4,762 g females) (Pérez-Lara et al. Citation2013).
Richards and Von Bertalanffy models tended to underestimate female and conjoined (female and males) predicted hatching body weight, respectively. This supports the results reported by Segura-Correa et al. (Citation2017).
As described by Segura-Correa et al. (Citation2017) while Von Bertalanffy model tends to underestimate hatching body weight in hybrid turkeys, the Logistic and Verhulst models tend to overestimate hatching body weight. This different behaviour may derive from the similarities and differences in their mathematical functions. For instance, Richards, Von Bertalanffy, Logistic, and Verhulst fix the origin through which the curve originates. In this context, the Gompertz model reported the best-predicted values for weight at hatching across sexes, and does not fix the curve to the origin, but uses the ‘a’ parameter instead.
By contrast, some studies conducted in turkeys and non-selected native chicken breeds suggest Gompertz model overestimate hatching body weight (Magothe et al. Citation2010; Segura-Correa et al. Citation2017; Mata-Estrada et al. Citation2020). Additionally, for females, a slight decrease in observed weights at 210 days of age (30 weeks) was observed. Such a slight decrease probably coincided with the beginning of the laying period of turkey hens, when the energetic requirements of females likely increased. For instance, the beginning of the laying period in native turkeys has been reported to occur later than in commercial turkey hen lines, for which the earliest ages for egg production that have been reported have been dated around 22–25 weeks (Siopes Citation2010), indicative of the lower precocity found in native breeds.
The results showed sharp inflection weight, ages, and growth rate fluctuations across sexes and models, with sharper inflection weights being reported in males for the Logistic model. Exceptionally, Verhulst model reported superior growth rates than the rest of the models fitted. This may evidence females may reach puberty before males, even if it is at lower weights. These results agree with those reported in recent studies conducted in hybrid and native turkey breeds (Ersoy et al. Citation2006; Pérez-Lara et al. Citation2013; Segura-Correa et al. Citation2017), and other species (Fernandes et al. Citation2020).
The economic importance of the inflection point bases on the fact that it represents the point of maximum growth rate and marks the moment when growth acceleration ceases. This point frequently coincides with puberty and its control in commercial turkey hens is crucial. The excessive energy production requirements derived as a consequence of fat tissue deposition collaterally occur in cases of premature puberty in turkey hens, which is associated with fertility disorders and deregulation in the follicle hierarchy (Dewez et al. Citation2018).
Therefore, it is essential to define this inflection point to design adequate feeding programmes or to accurately set slaughtering ages. The definition of slaughtering age is closely linked to turkey meat quality traits, such as pH, colour, and water holding capacity. As described by some authors, animals slaughtered at a lower age presented higher breast pH values, less dark, and lower drip and cooking losses (Sarica et al. Citation2011; Mauri et al. Citation2017). These variations in meat quality are associated with myoglobin concentration, collagen cross-links, or muscle fibre diameter (Lepetit Citation2008; Listrat et al. Citation2016).
In Andalusian turkeys, the defined slaughtering age for males at 20 weeks and 5,542.69 g could be an interesting alternative, which may recommend the commercialisation of turkey carcasses as whole individual pieces, provided their size may be suitable to fit in a home oven, hence making the product rather accessible.
However, lower weights reached by females at the inflection point (12 weeks and 1,798.26 g) may reduce their market opportunities, since their lower carcase weights may be insufficient to seek turkey hens standardised commercialisation. Consequently, the production of females may better focus on these females producing the individuals that supply for multiplication farms, as it occurs in other poultry meat lines.
Conclusions
In conclusion, limited samples may be a source for erroneous convergence in Richards model, which especially affects growth in turkey males. Differences in Sinusoidal model fitting may also be ascribed to how data is collected or considered. Contextually, when individual weight observations are used against when population data is averaged. A marked sexual dimorphism is evident, as denoted by higher values of maturity rate ‘k’, with females reaching maturity earlier but with lower weights than males. Lower mature weights may be a consequence of the lack of intensive genetic selection in local breeds. Models presenting a Sigmoid profile better graphically described growth in turkeys than exponential ones. These models represent growth acceleration in early stages as individuals approach adulthood up to the points of maximum weight. Afterward, the growth rate asymptotically decreases and stabilises. Underestimation or overestimation of hatching body weight may derive from origin being fixed or ‘a’ parametrised in functions. The higher inflection point in Andalusian male turkeys may enable their relatively easier commercial standardisation than in Andalusian turkey hens.
Ethical approval
The study follows the national guidelines and premises described in the Declaration of Helsinki. The Spanish Ministry of Economy and Competitivity through the Royal Decree Law 53/2013 and its credited institution the Ethics Committee of Animal Experimentation from the University of Córdoba permitted the application of the protocols. This Decree Law follows the European Union Directive 2010/63/UE, from the 22nd of September of 2010.
Acknowledgements
The authors would like to acknowledge the Association of Andalusian Turkey Breeders, Agropecuary Provincial Centre of Diputacion of Cordoba, and PAIDI AGR 218 research group for providing the animals and their support.
Disclosure statement
No potential conflict of interest was reported by the authors.
Data availability statement
The authors confirm that the data supporting the findings of this study are available within the article.
References
- Afrouziyeh M, Kwakkel RP, Zuidhof MJ. 2021. Improving a nonlinear Gompertz growth model using bird-specific random coefficients in two heritage chicken lines. Poult Sci. 100(5):101059.
- Arando A, González-Ariza A, León JM, Doctor J, Marín C, Navas-González FJ, Gallardo M, Delgado JV, Camacho ME. 2019. Resultados preliminares de la calidad externa del huevo en el pavo Andaluz (Meleagris gallopavo). XX Simposio Iberoamericano sobre Conservación y Utilización de Recursos Zoogenéticos. Corumbá, Mato Grosso do Sul.
- Barr D, Levy R, Scheepers C, Tily H. 2013. Random effects. Annual Conference of the Cognitive Science Society. p. 197–202.
- Camacho‐Escobar MA, Arroyo‐Ledezma J, Ramirez‐Cancino L. 2008. Diseases of backyard turkeys in the Mexican tropics. Ann NY Acad Sci. 1149(1):368–370.
- Canales Vergara AM, Landi V, Delgado Bermejo JV, Martínez A, Cervantes Acosta P, Pons Barro Á, Bigi D, Sponenberg P, Helal M, Hossein Banabazi M, et al. 2019. Tracing worldwide turkey genetic diversity using D-loop sequence mitochondrial DNA analysis. Animals. 9(11):897.
- Chan JS, Kuk AY. 1997. Maximum likelihood estimation for probit-linear mixed models with correlated random effects. Biometrics. 53(1):86–97.
- Ciurescu G, Vasilachi A, Grosu H. 2020. Efficacy of microbial phytase on growth performance, carcass traits, bone mineralization, and blood biochemistry parameters in broiler turkeys fed raw chickpea (Cicer arietinum L., cv. Burnas) diets. J Appl Poult Res. 29(1):171–184.
- Darmani Kuhi H, Porter T, López S, Kebreab E, Strathe AB, Dumas A, Dijkstra J, France J. 2010. A review of mathematical functions for the analysis of growth in poultry. World's Poult Sci J. 66(2):227–240.
- Dewez MF, Etourneau P, Lecompte F, Briere S, Froment P. 2018. Use of computed tomography to determine body composition of heavy strain turkey hens (Meleagris gallopavo) from rearing to early laying. Poult Sci. 97(11):4093–4106.
- El Halimi R. 2005. Nonlinear mixed effects models and non parametric inference. A Method based on bootstrap for the analysis of non-normal repeated [doctoral thesis]. Barcelona: University of Barcelona.
- Ersoy IE, Mendeş M, Aktan S. 2006. Growth curve establishment for American Bronze turkeys. Arch Anim Breed. 49(3):293–299.
- Farghly MF, Mahrose KM, Cooper RG, Ullah Z, Rehman Z, Ding C. 2018. Sustainable floor type for managing turkey production in a hot climate. Poult Sci. 97(11):3884–3890.
- Fernandes TJ, Souza FACD, Ribeiro RA, Cunha FO, Meirelles SLC, Moura RSD, Muniz JA. 2020. Growth curve for height at withers and body length of Mangalarga Marchador horses. Cienc Rural. 50(12):e20200140.
- Fernández M, Gómez M, Delgado J, Adán S, Jiménez M. 2009. Guía de campo de las razas autóctonas españolas. Madrid: SERGA. p. 683–684.
- Gbangboche AB, Glele-Kakai R, Salifou S, Albuquerque LGD, Leroy PL. 2008. Comparison of non-linear growth models to describe the growth curve in West African Dwarf sheep. Animal. 2(7):1003–1012.
- Gelman A, Hill J. 2007. Data analysis using regression and hierarchical/multilevel models. New York (NY): Cambridge.
- Gómez DAA, Muñoz MFC, Restrepo LF. 2007. Modelación de funciones de crecimiento aplicadas a la producción animal. Revista Colombiana de Ciencias Pecuarias. 20(2):157–173.
- González-Ariza A, Navas-González FJ, Arando A, León JM, Barba CJ, Camacho ME. 2019. Non-parametrical canonical analysis of quality-related characteristics of eggs of different varieties of native hens compared to laying lineage. Animals. 9(4):153.
- González-Ariza A, Nogales S, Lupi TM, Arando A, Navas-González FJ, León JM, Delgado JV, Camacho ME. 2021. Characterization of biological growth curves of different varieties of an endangered native hen breed kept under free range conditions. Ital J Anim Sci. 20(1):806–813.
- Harrison XA. 2015. A comparison of observation-level random effect and Beta-Binomial models for modelling overdispersion in Binomial data in ecology & evolution. PeerJ. 3:e1114.
- Harrison XA, Donaldson L, Correa-Cano ME, Evans J, Fisher DN, Goodwin CE, Robinson BS, Hodgson DJ, Inger R. 2018. A brief introduction to mixed effects modelling and multi-model inference in ecology. PeerJ. 6:e4794.
- Kamara D, Gyenai KB, Geng T, Hammade H, Smith EJ. 2007. Microsatellite marker-based genetic analysis of relatedness between commercial and heritage turkeys (Meleagris gallopavo). Poult Sci. 86(1):46–49.
- Kaplan S, Narinc D, Gurcan EK. 2016. Genetic parameter estimates of weekly body weight and Richard's growth curve in Japanese quail. Eur Poultry Sci. 80: 1–10.
- Kéry M. 2010. Introduction to WinBUGS for ecologists: Bayesian approach to regression, ANOVA, mixed models and related analyses. Cambridge: Academic Press.
- Kuhi HD, Lopez S, France J, Mohit A, Shabanpour A, Hosssein-Zadeh NG, Falahi S. 2019. A sinusoidal equation as an alternative to classical growth functions to describe growth profiles in turkeys. Acta Sci Anim Sci. 41(1):e45990.
- Lawrence TLJ, Fowler VR, Novakofski JE. 2012. Growth of farm animals. Cambridge: Cabi.
- Leonard T, Hsu JS. 2001. Bayesian methods: an analysis for statisticians and interdisciplinary researchers, Vol. 5. Cambridge: Cambridge University Press.
- Lepetit J. 2008. Collagen contribution to meat toughness: theoretical aspects. Meat Sci. 80(4):960–967.
- Listrat A, Lebret B, Louveau I, Astruc T, Bonnet M, Lefaucheur L, Picard B, Bugeon J. 2016. How muscle structure and composition influence meat and flesh quality. Sci World J. 2016:1–14.
- López-Zavala R, Monterrubio-Rico TC, Cano-Camacho H, Chassin-Noria O, Aguilera-Reyes U, Zavala-Páramo MG. 2008. Native turkey (Meleagris gallopavo gallopavo) backyard production systems' characterization in the physiographic regions of the State of Michoacan, Mexico. Técnica Pecuaria En México. 46(3):303–316.
- Lupi TM, Nogales S, León JM, Barba C, Delgado JV. 2015. Characterization of commercial and biological growth curves in the Segureña sheep breed. Animal. 9(8):1341–1348.
- Magothe TM, Muhuyi WB, Kahi AK. 2010. Influence of major genes for crested-head, frizzle-feather and naked-neck on body weights and growth patterns of indigenous chickens reared intensively in Kenya. Trop Anim Health Prod. 42(2):173–183.
- Mata-Estrada A, González-Cerón F, Pro-Martínez A, Torres-Hernández G, Bautista-Ortega J, Becerril-Pérez CM, Vargas-Galicia AJ, Sosa-Montes E. 2020. Comparison of four nonlinear growth models in Creole chickens of Mexico. Poult Sci. 99(4):1995–2000.
- Mauri S, Guijarro Á, Peña F, Domenech V, Avilés C. 2017. Relevance of age at slaughter on meat quality of turkeys stunned with CO2. Br Poult Sci. 58(6):656–663.
- Mpenda FN, Schilling MA, Campbell Z, Mngumi EB, Buza J. 2019. The genetic diversity of local African chickens: a potential for selection of chickens resistant to viral infections. J Appl Poult Res. 28(1):1–12.
- Nahashon SN, Aggrey SE, Adefope NA, Amenyenu A, Wright D. 2006. Growth characteristics of pearl gray guinea fowl as predicted by the Richards, Gompertz, and Logistic models. Poult Sci. 85(2):359–363.
- Narinc D, Karaman E, Aksoy T, Firat MZ. 2014. Genetic parameter estimates of growth curve and reproduction traits in Japanese quail. Poult Sci. 93(1):24–30.
- Narinc D, Karaman E, Firat MZ, Aksoy T. 2010. Comparison of non-linear growth models to describe the growth in Japanese quail. J Anim Vet Adv. 9(14):1961–1966.
- Narinc D, Öksüz Narin ÇN, Aygün A. 2017. Growth curve analyses in poultry science. World Poult Sci J. 73(2):395–408.
- Newey W. 2007. Nonlinear models with panel data. Proceedings of the Course Materials for 14.386 New Econometric Methods. MA, USA. p. 163–179.
- Nogales S, Calderón J, Lupi TM, Bressan MC, Delgado JV, Camacho ME. 2017. A comparison of the growth performance between cattle reared in conventional systems and in feral conditions. Livestock Sci. 206:154–160.
- Pérez-Lara E, Camacho-Escobar M, García-López J, Machorro-Samano S, Ávila-Serrano N, Arroyo-Ledezma J. 2013. Mathematical modeling of the native Mexican turkey's growth. OJAS. 3(4):305–310.
- Pizarro MG, Landi V, Navas-González FJ, León JM, Delgado JV. 2019. Non-parametric analysis of the effects of αS1-casein genotype and parturition non-genetic factors on milk yield and composition in Murciano-Granadina goats. Ital J Anim Sci. 18(1):1021–1034.
- Pizarro MG, Navas-González FJ, Landi V, León JM, Delgado JV, Fernández J, Martínez MA. 2020a. Software-automatized individual lactation model fitting, peak and persistence and Bayesian criteria comparison for milk yield genetic studies in Murciano-Granadina goats. Mathematics. 8(9):1505.
- Pizarro MG, Navas-González FJ, Landi V, León JM, Delgado JV, Fernández J, Martínez MA. 2020b. Goat milk nutritional quality software-automatized individual curve model fitting, shape parameters calculation and Bayesian flexibility criteria comparison. Animals. 10(9):1693.
- Porter T, Kebreab E, Darmani Kuhi H, Lopez S, Strathe AB, France J. 2010. Flexible alternatives to the Gompertz equation for describing growth with age in turkey hens. Poult Sci. 89(2):371–378.
- Ramos SB, Caetano SL, Savegnago RP, Nunes BN, Ramos AA, Munari DP. 2013. Growth curves for ostriches (Struthio camelus) in a Brazilian population. Poult Sci. 92(1):277–282.
- Sarica M, Ocak N, Turhan S, Kop C, Yamak U. 2011. Evaluation of meat quality from 3 turkey genotypes reared with or without outdoor access. Poultr Sci. 90(6):1313–1323.
- Sariyel V, Aygun A, Keskin I. 2017. Comparison of growth curve models in partridge. Poult Sci. 96(6):1635–1640.
- Segura-Correa J, Santos-Ricalde R, Palma-Ávila I. 2017. Non-linear model to describe growth curves of commercial turkey in the tropics of Mexico. Rev Bras Cienc Avic. 19(1):27–32.
- Şengül T, Kiraz S. 2005. Non-linear models for growth curves in Large White turkeys. Turk J Vet Anim Sci. 29(2):331–337.
- Silk MJ, Harrison XA, Hodgson DJ. 2020. Perils and pitfalls of mixed-effects regression models in biology. PeerJ. 8:e9522 doi:https://doi.org/10.7717/peerj.9522.
- Siopes T. 2010. Initiation of egg production by turkey breeder hens: sexual maturation and age at lighting. Poult Sci. 89(7):1490–1496.
- Testik A, Baselga M, Yavuz C, García M. 1999. Growth performances of California and V reared turkey. Cahiers Opt Meditérr. 41:159–162.
- Ulutas Z, Sezer M, Aksoy Y, Sirin E, Sen U, Kuran M, Akbas Y. 2010. The effect of birth types on growth curve parameters of Karayaka lamb. J Anim Vet Adv. 9(9):1384–1388.
- Van Staaveren N, Leishman EM, Adams SM, Wood BJ, Harlander-Matauschek A, Baes CF. 2020. Housing and management of turkey flocks in Canada. Animals. 10(7):1159.
- Van Vleck LD. 1993. Selection index and introduction to mixed model methods for genetic improvement of animals: the green book. 04; SF105. 26, V3.
- Ware A, Power N. 2017. Modelling methane production kinetics of complex poultry slaughterhouse wastes using sigmoidal growth functions. Renew Energy. 104:50–59.
- Yang Y, Mekki DM, Lv SJ, Wang LY, Yu JH, Wang JY. 2006. Analysis of fitting growth models in Jinghai mixed-sex yellow chicken. Int J Poultry Sci. 5(6):517–521.
- Zampiga M, Tavaniello S, Soglia F, Petracci M, Mazzoni M, Maiorano G, Meluzzi A, Clavenzani P, Sirri F. 2019. Comparison of 2 commercial turkey hybrids: productivity, occurrence of breast myopathies, and meat quality properties. Poultr Sci. 98(5):2305–2315.