
 ?Mathematical formulae have been encoded as MathML and are displayed in this HTML version using MathJax in order to improve their display. Uncheck the box to turn MathJax off. This feature requires Javascript. Click on a formula to zoom.
Abstract
The current experiment was conducted to evaluate the effects of digestible threonine (dThr) on performance, egg quality, blood metabolites, and immune responses in laying hens fed a wheat-based diet during the second cycle. Also, dThr requirements were determined based on nutrient dose-response data. A total of 384, 105-week-old post-molt Hy-line-W36 laying hens were allocated to six groups, 0.02% increments, ranging from 0.44 to 0.54% dThr, with eight replicates/treatment and eight birds each, from 105 to 116 wk. By increasing, dThr levels improved egg weight with a linear trend (p <.01), and egg production (EP), egg mass (EM), and feed conversion ratio (FCR) with quadratic trends (p <.05). Hens fed diet contained 0.48% dThr, dThr/digestible Lys (dLys) of 66% showed the best egg production traits. However, feed intake, egg quality traits, blood metabolites, and immune responses were unaffected by dThr levels. Based on the quadratic broken‐line regression models, the dThr requirements of laying hens during the second production cycle for optimised the EP, EM, and FCR were estimated at 507, 514, and 520 mg/hen per day, respectively. These values correspond to 9.84–10.1 mg/g of EM. It is concluded, in the laying hens fed a wheat-based diet during the second cycle, the dietary dThr level of 0.48%, dThr/dLys of 66%, and a daily intake of 520 mg dThr/bird are adequate for optimised performance. The amino acids requirements of laying hens vary depending on trait is considered for optimisation. The dThr requirement estimated for FCR was higher than those for EP and EM.
In the laying hens that feed a wheat-based diet during the second cycle.
A dietary digestible threonine concentration of 0.48% and a daily intake of digestible threonine 520 mg/bird are adequate for optimised performance.
HIGHLIGHTS
Introduction
Modern layer hen strains have a high genetic potential for egg production and may produce eggs for more than one laying cycle by inducing moulting. It should not be overlooked that improved egg production is obtained when adequate nutrition is provided. For this reason, one of the most essential nutrients is protein, particularly the limited nutritional essential amino acids (Domingues et al. Citation2012; Khatibi et al. Citation2021). Most of the previous research has been implemented on determining the amino acid requirements of laying hens in the first production cycle. Therefore, the information on laying hens requirements in the second production cycle is minimal (Gomez and Angeles Citation2009). Nevertheless, nutrient requirements for laying hens during the second production cycle have been assumed to be similar to those observed during the first laying cycle (NRC Citation1994; mHy-Line Citation2019).
Threonine (Thr) is a crucial amino acid for poultry nutrition because it is the third most limiting amino acid. Afterward, Thr metabolites are required for normal metabolism (Kidd and Kerr Citation1996; Cardoso et al. Citation2014; Fouad et al. Citation2016). Threonine participates in the protein synthesis and maintenance of body protein turnover (Figueiredo et al. Citation2012), as well as acts to generate essential metabolic products as glycine, acetyl-CoA, pyruvate (Kidd and Kerr Citation1996), and uric acid (Martinez-Amezcua et al. Citation1999). Additionally, Thr is essential for mucin production, which plays a significant role in intestinal health and nutrient absorption (Mao et al. Citation2011), as well as for the production of antibodies (Kidd Citation2004) and feather development (Fouad et al. Citation2016). In laying hens, dietary supplementation with L-threonine enhances the egg production, egg weight, feed conversion ratio (FCR), and antibody production during different phases of production (Martinez-Amezcua et al. Citation1999; Faria et al. Citation2002; Azzam et al. Citation2011; Abdel-Wareth and Esmail Citation2014; Azzam et al. Citation2014; Cardoso et al. Citation2014). The National Research Council has reported that the requirements of laying hens for threonine are 470 mg/hen per day (NRC Citation1994).
Over the past years, genetic improvement of laying hens has increased the potential of these hens in egg production, requiring a review of nutrient requirements and dietary regulation (Figueiredo et al. Citation2012). There is some evidence that diet essential amino acids concentration higher than NRC specifications needed to achieve optimal product performance, immune competence, and disease resistance (Kidd et al. Citation2001; Quentin et al. Citation2005). The daily digestible threonine (dThr) requirement of laying hens was reported to be 460 mg/hen per day (Schutte Citation1998), 490 mg/hen per day (mHy-Line Citation2019), and 495 mg/hen per day (Coon and Zhang Citation1999).
Wheat is commonly used in many countries as the primary energy source in poultry diets (Tabatabaei et al. Citation2017). In corn-based diets, Thr is introduced as the third limiting amino acid (Fernandez et al. Citation1994). However, there have been reports that in high-protein diets, dietary threonine levels have reached the required level, and the threonine amino acid is not limiting (Kidd and Kerr Citation1996). Since wheat has a higher protein content than corn, in a wheat-based diets the amount of soybean meal is reduced and most of the dietary protein, especially in low-protein diets, will be from wheat. With regards that the ratio of threonine to protein for wheat is lower than for corn and soybean meal (NRC Citation1994). In this situation, threonine will be definite a limiting amino acid (Kidd and Kerr Citation1996). The present study was undertaken to evaluate the effects of graded levels of dietary dThr during the second laying cycle on egg production performance, egg quality, blood metabolites, and immune responses of commercial Hy-line-W36 laying hens fed wheat-based diet. Additionally, we hypothesised that it is possible to find an optimal inclusion level of dThr that allows optimum performance.
Materials and methods
The experiment was conducted with the approval of the Animal Care Committee of the Ferdowsi University of Mashhad, Mashhad, Iran (Approval no: 337/475/2018).
Feedstuffs analysis
Prior to the experiment, samples of the main feedstuff that used in feed formulation, wheat (data on as-fed basis: DM, 91.78%; GE, 4047 kcal/kg; CP, 11.37%; Thr, 0.37%; EE, 2.3%; CF, 3.0; and ash, 1.7%), soybean meal (data on as-fed basis: DM, 88.42%; GE, 4414 kcal/kg; CP, 44.47%; Thr, 1.74%; EE, 4.5%; CF, 2.3; and ash, 1.2%), and corn gluten meal (data on as-fed basis: DM, 91.96%; GE, 4870 kcal/kg; CP, 53.86%; Thr, 1.76%; EE, 6.3%; CF, 1.6; and ash, 2.2%) were analysed for their proximate composition on the methods described (AOAC Citation2002), and wheat (data on as-fed basis: ME, 3213 kcal/kg; digestible Lys, 0.32%; digestible Met, 0.16%; digestible SAAs, 0.38%; digestible Thr, 0.28%), soybean meal (data on as-fed basis: ME, 2230 kcal/kg; digestible Lys, 2.23%; digestible Met, 0.55%; digestible SAAs, 1.07%; digestible Thr, 1.44%), and corn gluten meal (data on as-fed basis: ME, 3740 kcal/kg; digestible Lys, 0.67%; digestible Met, 1.12%; digestible SAAs, 1.91%; digestible Thr, 1.46%) were measured by NIR method through Evonik Co. (Evonik Nutrition& Care GmbH) agent in Tehran, Iran.
Hens, housing, experimental design, and diets
A total of 384, 105-week-old post-molt Hy-line-W36 layers were individually weighed (mean weight was 1669 ± 94 g) and assigned in a completely randomised design with six dietary treatments, eight replicates/treatment, and eight hens each. The hens were housed four per cage (40 cm × 45 cm wire-bottomed cage, corresponding to 450 cm2 per hen), and every two adjacent cages contained eight hens served as an experimental unit. Each cage was equipped with a feeder and a nipple drinker to provide hens with free access to feed and water. The incandescent lights were used to provide 16 L: 8D cycle. All hens had free access to mash feed and water throughout the experiment period. Hens and housing facilities were inspected two times daily.
The wheat-soybean meal basal diet was formulated based on the determined ingredients analysis and met 5% exceed Hy-line-W36 recommendations (mHy-Line Citation2019) for the second egg production cycle, except for dThr (Table ), in a least‐cost equation by user-friendly feed formulation done again (UFFDA Citation1992) software, University of Georgia, Athens, GA, United States. The experimental diets were provided in a way that a batch of Thr deficient wheat-soybean meal basal diet (0.44% dThr level) was made and then divided into six equal portions, and an L-threonine Amino Acid feed‐grade supplement (Threonine AMINO, >98%, Evonik Degussa GmbH, Hanau-Wolfgang, Germany; ME = 3570 kcal/kg; CP = 72.4%) was added at the rate of 0.0, 0.21, 0.41, 0.61, 0.82 and 1.02 g/kg to the top of each portion at the expense of filler (corn starch) and mixed to provide six diets with 0.44, 0.46, 0.48, 0.50, 0.52 and 0.54% dThr levels, dThr/digestible lysine (dLys) of 60, 63, 66, 69, 72 and 75%, respectively. Experimental periods consisted of a three-week equilibration phase and 12 weeks (during 105–116 weeks of age) of data collection divided into three consecutive periods of 28 d each.
Table 1. Ingredients and nutrients composition of basal dieta.
Egg production and quality traits
Egg production (number and weight) and mortality were recorded daily, whereas performance traits were calculated and compiled every 28d intervals (105–108, 109–112, and 113–116 wk of age). During the experimental periods, the following productive performance traits were measured: feed intake, egg production, feed conversion ratio, average egg weight, and egg mass. The average daily energy, crude protein, and threonine intake were calculated using feed intake information and experimental diets composition (Table ). For egg quality traits, six eggs/replicate (48 eggs/treatment) from eggs laid during the three consecutive days at the end of each period (26–28 d) were randomly selected and transported to Egg Quality Laboratory in Ferdowsi University of Mashhad, Mashhad, Iran.
Maximum width and length were measured by passing the width or length of eggs through the digital Calliper (0.05 mm, Model 1116–150, Insize Co. Ltd., Suzhou, China) to find the maximum points and then calculating the egg shape index by the following formula (Akbari Moghaddam Kakhki et al. Citation2016a):
After weighing individual eggs by a digital electronic scale (0.001 g, Model GF 400, A&D Weighing Co. Ltd., CA.), the egg components, including yolk and albumen, were separated by a commercially hand-held egg separator. A wet cloth napkin was used to eliminate the adhering of albumen residues from the yolk, and then it was weighed. The eggshells were washed by water, dried for 48 h, and weighed. Eggshell thickness was measured using a micrometer apparatus (0.001-mm, Model 293–240, Mitutoyo Co, Ltd., Kanagawa, Japan) at three disparate sites; top, middle, and bottom, which were averaged to calculate overall eggshell thickness. The albumen weight was calculated by subtracting yolk + shell weights from the whole egg weight (Akbari Moghaddam Kakhki et al. Citation2016a). Haugh unit was calculated based on the following formula, in less than six hours h after the egg collection (Akbari Moghaddam Kakhki et al. Citation2016b):
Humoral immune response
Sheep red blood cells (SRBC), as a non-pathogenic antigen, were used to evaluating the humoral immune response. Two hens from each replicate (16 hens/treatment) were marked and injected with 0.5 ml of 5% SRBC suspension into the brachial vein at 115 wk of age. Seventh-day after the first challenge, the hens were given a booster injection of the 5% SRBC for secondary antibody production. This procedure was followed because the antibody produced during a secondary response is higher than during the primary response (Allahdo et al. Citation2018). On the seventh day post each inoculation, the blood samples were collected from the brachial vein of each bird into a non-heparinized tube. After allowing for the completion of clotting, blood samples were centrifuged at 1,900 g for 5 min at 4 °C to extract serum (Zarghi et al. Citation2020).
Serum samples were tested for total antibody (IgT) response, then specifically for IgM and IgY using the 2-mercaptoethanol technique (Allahdo et al. Citation2018). Briefly, serum pipetted into micro centrifuge tubes and inactivated by heat in a 56 °C water bath for 30 min. To assess IgT, 50 µL of PBS was placed in the first row of wells in a 96-well V-bottom micro-titration plate. To the same wells, 50 µL of serum was added, and plates were sealed and incubated at 37 °C for 30 min. Plates were removed from the incubator, and 50 µL PBS was added to the 11 remaining wells in each row. A twofold serial dilution of the samples was made on successive rows, 50 µL of a 2.5% SRBC suspension added to each well, and plates were again sealed and incubated for 30 min. The IgM (ME-sensitive) and IgY (ME-resistant) antibody titres were assessed using the same procedure as total titres, except that 50 µL of 2-ME was added to the first row of wells. Titres were read by holding plates over a lighted mirror to observe wells showing agglutination. All antibody titres were reported as log2 of the reciprocal of the last dilution in which agglutination was observed (Allahdo et al. Citation2018).
Cellular immune response
The cell-mediated immune (CMI) response was assessed by measuring the reaction of cutaneous basophils hypersensitivity (CBH) to phytohemagglutinin-P (PHA-P) by intra-dermally injection. At the end of the experiment, two hen from each replicate (16 hens/treatment) were selected and injected with 100 μg of PHA-P suspended in 0.1 mL of phosphate-buffered saline (PBS) into the web between the third and fourth inter-digital space of the right foot, while in each hen the left web (Control) was injected with 0.1 mL of PBS. The web thickness of both feet was measured with a micro-meter at 0, 6, 12, 18, and 24 h after injection. The response was determined by subtracting the skin thickness of the first measurement from the 6, 12, 18, and 24 h after injection and the values of the left foot (control) from the right foot (Allahdo et al. Citation2018).
Blood collection and analysis
At the end of the experiment, one hen from each replicate (eight/treatment) was randomly selected, and the blood sample was taken from the brachial vein of each bird into non-heparinized tubes. After allowing for the completion of clotting, blood samples were centrifuged at 1,900 xg for 5 min at 4 °C to extract serum (Zarghi et al. Citation2020). Serum calcium, phosphorus, uric acid, total protein, and alkaline phosphatase (ALP) concentration were measured, with kits from Pars Azmoon Company, Iran by using a multi-test automatic random-access system auto-analyzer (Cobas Bio, Roche Basel, Switzerland).
Statistical analysis
All data were analysed for normality using SAS 9.1 software through the Univariate plot normal procedure (SAS Citation2003). The data were analysed by using the General Linear Model procedure, orthogonal polynomials for linear and quadratic responses to diet nutrients density were calculated to explore the relationships between dietary nutrients level as independent variables and the respective traits as dependent variables. The dietary threonine level for maximum response in performance variables, that’s R2 was significant, were predicted using the quadratic broken-line regression models, using the nonlinear modelling option in SAS, with the dietary nutrients density as the independent variable (Robbins et al. Citation2006). The iterative procedure makes repeated estimates for coefficients and minimises residual error until the best-fit line is achieved. To assist in choosing an appropriate model, coefficient of determination (R2), adjusted R2 (adj. R2), root means square error (RMSE), and Akaike’s information criterion (AIC) values were calculated using the following formulas (Ghavi et al. Citation2021):
where: Y = dependent variable, L = theoretical maximum, R = requirement, X = independent variable, I = 1 (if X < R) or I = 0 (if X > R), U = rate constant, yt = observed values, ŷt = predicted values, N = number of observations, P = k + 1, and k is the number of parameters.
Results
Daily feed and nutrients intake
The effect of dietary dThr levels on feed and nutrient intake is shown in Table . Feed intake during the 105–108, 109–112, 113–116, and 105–116 wk of age periods unaffected by increasing dietary dThr levels (p > .05). Therefore, no significant differences were observed in any nutrient intake except for threonine intake (p < .05). Based on the feed intake and amino acids analysis, by adding L-threonine (0.02% increments) to the basal diet, the dThr intake significantly increased (p < .001).
Table 2. Effect of dietary digestible threonine level on feed and nutrient intake of laying hens during the second cycle (105–116 wk of age)a.
Egg production performance
This study demonstrated that L-threonine supplementation had a significant effect on egg production performance (Table ). Productive performance was improved in a linear or quadratic manner (p < .05) as an effect of increased levels of L-threonine supplementation. Egg weight increased from 64.86 g/egg when the diet contained 0.44% dThr (dThr/dLys of 60%) to 66.85 g/egg for the diet containing 0.54% dThr (dThr/dLys of 75%). The results showed that hens fed the diet containing 0.48% dThr (dThr/dLys of 66%), performed the highest hen-day egg production. Egg production increased 6.41% when the birds fed a diet with 0.48% dThr level than the birds fed basal (Thr deficient) diet. Egg mass was significantly enhanced by increasing dThr intake during all experimental periods. Lower values were observed for egg mass when the diet contained less than 0.48% dThr. The feed conversion ratio was the lowest in the hens fed a diet with 0.48% dThr level, and it was 8.40% lower than those fed a non-threonine supplemented diet.
Table 3. Effect of dietary digestible threonine level on productive performance of laying hens during the second cycle (105–116 wk of age)a.
Estimated digestible threonine requirement
The results from the quadratic broken line analysis for the requirements of dThr are shown in Table . Regression analysis for EW on the dThr intake resulted in a linear response. Egg weight increased as the dThr content of the diet increased (Figure ). No requirement was estimated for EW due to a lack of quadratic response. The dThr requirements for the optimum EP during the 105–108, 109–112, 113–116, and 105–116 wk of age periods were estimated by a quadratic broken-line fit model in the amounts of 492, 517, 512, and 507 mg/hen per day, respectively (Table and Figure ). The dThr requirements for the optimal EM estimated by the quadratic broken-line model were 492, 527, 523, and 514 mg/hen per day during the first, second, third, and the whole experimental periods, respectively (Table and Figure ). The dThr requirements for the optimal FCR estimated by the quadratic broken-line model were 490, 540, 546, and 520 mg/hen per day during the first, second, third, and the whole experimental periods, respectively (Table and Figure ).
Figure 1. Fitted plots of egg weight (Y, in g) vs. daily digestible threonine consumption (X, in mg/bird per day) of Hy-line-W36 laying hens fed from 100 to 112 weeks of age.
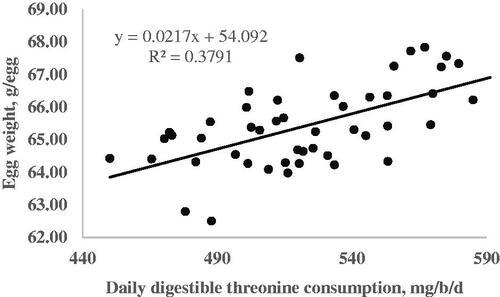
Figure 2. Fitted plots of hen-day egg production (Y, in %) vs. daily digestible threonine consumption (X, in mg/bird per day) of Hy-line-W36 laying hens fed from 100 to 112 weeks of age. Equations: Y = 78.41–0.0043(507-X)2 × I, I = 1 (if X < 507 or I = 0 (if X > 507), p <.0001, adj. R2 = 0.54. The break point occurred at 507 ± 8.8.
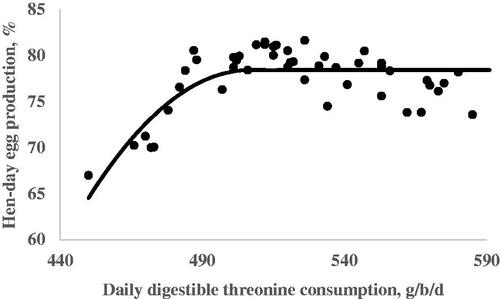
Figure 3. Fitted plots of egg mass (Y, in g/b/d) vs. daily digestible threonine consumption (X, in mg/bird per day) of Hy-line-W36 laying hens fed from 100 to 112 weeks of age. Equations: Y = 51.50 – 0.0022(514-X)2 × I, I = 1 (if X < 514 or I = 0 (if X > 514), p <.0001, adj. R2 = 0.59. The break point occurred at 514 ± 9.1.
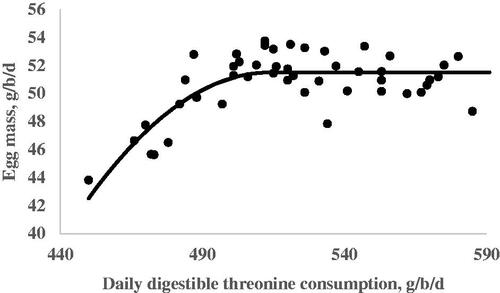
Figure 4. Fitted plots of feed conversion ratio (Y, in g feed intake/ g egg mass) vs. daily digestible threonine consumption (X, in mg/bird per day) of Hy-line-W36 laying hens fed from 100 to 112 weeks of age. Equations: Y = 2.08 + 0.000074(520 – X)2 × I, I = 1 (if X < 520 or I = 0 (if X > 520), p <.0001, adj. R2 = 0.45. The break point occurred at 520 ± 13.3.
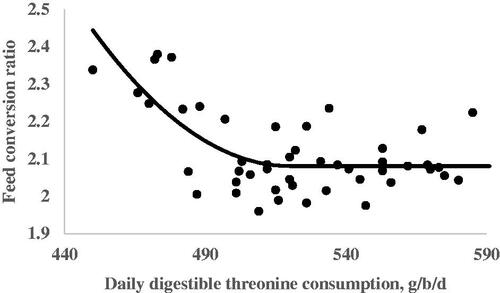
Table 4. Estimated digestible threonine requirements (mg/bird per day) for optimisation egg production parameters in laying hens during the second cycle (105–116 wk of age) by quadratic broken-line methodologya.
Egg quality traits
As shown in Tables and , no differences were observed as an effect of different dietary L-threonine levels on egg quality traits (p > .05) except haugh unit measured at the end of the first period (105–108 wk of age) that increased quadratic and significantly due to dietary L-threonine supplementation (p < .05).
Table 5. Effect of dietary digestible threonine level on egg qualitative traits of laying hens during the second cycle (105–116 wk of age)a.
Table 6. Effect of dietary digestible threonine level on egg qualitative traits of of laying hens during the second cycle (105–116 wk of age)a.
Blood metabolites
Table lists the influences of dietary treatments on the blood parameters of laying hens. Dietary supplementation with L-threonine did not significantly affect serum Ca, P, uric acid, total protein, and alkaline phosphatase concentrations (p > .05).
Table 7. Effect of dietary digestible threonine level on blood metabolites of laying hens determined at the end of the experiment (116 wk of age)a.
Immune responses
As presented in Table , dietary supplementation of L-threonine had no significant effect on the primary and secondary immune response to SRBC inoculation and the cellular immune response to PHA-P injection (p > .05).
Table 8. Effect of dietary digestible threonine levels on antibody titres responses to sheep red blood cell (SRBC) inoculation, cutaneous basophil hypersensitivity (CBH) responses elicited by phytohemagglutinin-P (PHA-M) intradermal injection, of laying hens determined 115–116 wk of agea.
Discussion
Lysine, is the reference amino acid when applying the ideal protein concept in formulation (Ghavi et al. Citation2021), was determined for digestible Lys (dLys) concentration at 0.73% for the basal diet. Digestible Thr analysed in the basal diet was 0.44, and by dietary L-threonine amino acid supplementation at the rate of 0.0, 0.21, 0.41, 0.61, 0.82 and 1.02 g/kg obtained six diets with 0.44, 0.46, 0.48, 0.50, 0.52 and 0.54% dThr levels. To these determined values for Lys and Thr, the final feeds have resulted in dThr/dLys of 60, 63, 66, 69, 72, and 75%, respectively.
Daily feed and nutrients intake
Our results are in agreement with that of previous researchers, who observed no significant differences in feed intake as the levels of dThr in the diet ranged from 0.42 to 0.53% (Martinez-Amezcua et al. Citation1999; Dozier et al. Citation2000; Faria et al. Citation2002; Azzam et al. Citation2011; Citation2014; Nunes et al. Citation2015). However, the severity of the threonine deficiency affects feed intake (Faria et al. Citation2002). In contrast, other researchers revealed that feed intake is affected by supplemental threonine (Koelkebeck et al. Citation1991; Ishibashi et al. Citation1998; Gomez and Angeles Citation2009). Ishibashi et al. (Citation1998) found that feed intake increased and then decreased linearly as dietary threonine increased. Gomez and Angeles (Citation2009) reported that feed intake was lower in layers fed a diet with 0.48% dThr (dThr/dLys of 66%) than those fed 0.42 or 0.54% dThr.
Egg production performance
Concerning egg weight, dietary supplementation with L-threonine had a linear and significant effect (Table and Figure ). This result agrees with those of other researchers (Morris and Gous Citation1988; Faria et al. Citation2002), that reported a reduction in EW, when the threonine content of the diet was reduced. In contrast, the significant influence of dietary dThr level on EW that observed in our experiment is not in agreement with several previous reports (Ishibashi et al. Citation1998; Gomez and Angeles Citation2009; Azzam et al. Citation2011, Citation2014; Nunes et al. Citation2015), that found no difference in egg weight as an effect of increased level of dietary threonine.
The egg productive performance data obtained in this experiment suggests that optimum performance was obtained when hens were fed diets containing 0.48% dThr (dThr/dLys of 66%). Our results are consistent with earlier studies in laying hens (Ishibashi et al. Citation1998; Martinez-Amezcua et al. Citation1999; Sá et al. Citation2007; Schmidt et al. Citation2011; Azzam et al. Citation2014; Cardoso et al. Citation2014) reported that increasing dietary threonine levels significantly improved production performance. In addition, Faria et al. (Citation2002) found that increasing the diet threonine concentration from 0.39% to 0.53% significantly increased egg production and the egg mass. Gomez and Angeles (Citation2009) observed that increasing the threonine levels from 0.42% to 0.48% improved the FCR in laying hens during the second production cycle. Cardoso et al. (Citation2014) recommended increasing the threonine level from 0.523% to 0.567% (dThr/dLys of 75.14%) to enhance egg production, the egg mass, and FCR in White Leghorn from 60 to 76 weeks of age. Threonine supplementation improves dietary amino acid balance and consequently promotes hen-day EP, EW, and EM by increasing protein synthesis and leading to enhanced feed efficiency. Another advantage of using synthetic amino acids is establishing an ideal ratio between all dietary amino acids by the concept of ideal protein, which contributes to the reduction of the dietary protein levels (Cardoso et al. Citation2014).
Estimated digestible threonine requirement
The summary of dThr requirements for the optimisation of EP, EM, and FCR estimated by quadratic broken-line fit models are shown in Table and Figures . Our results indicated that a certain level of dThr (0.48%) in the diet results in an optimum egg productive performance. In agreement with our result, Sá et al. (Citation2007) observed a quadratic effect (P < .05) of threonine levels on EP and EM. Also, they estimate threonine requirements of 0.499 and 0.501%, corresponding to a daily threonine intake of 570 and 573 mg/hen for production and egg mass, respectively. Schmidt et al. (Citation2011) found a quadratic effect, in which they estimated optimum dThr levels for egg production and egg mass of 0.465 and 0.459% in diets for white egg layers, corresponding to the intakes of 455 and 448 mg of dThr/hen per day, respectively. The dThr requirements of commercial laying hens for EP, EM and, FCR were estimated 507 ± 8.8, 514 ± 9.1, and 520 ± 13.3 mg/hen per day, respectively (Table ). These values correspond to 9.84–10.1 mg/1g of EM. The estimated dThr requirements are higher than 470 mg/hen per day estimated by NRC (Citation1994) and 455 mg/hen per day reported by Ishibashi et al. (Citation1998). The Dutch Bureau of Livestock Feeding, as quoted by Schutte (Citation1998), recommends 460 mg/d of dThr, which would be 534 mg total, or for 56 g of EM, a requirement of 9.54 mg/g of EM. Ishibashi et al. (Citation1998) used laying performance and plasma threonine concentration as parameters to determine the threonine requirement for laying hens. They concluded that the threonine requirement, expressed as milligrams per hen per day as determined by plasma threonine concentration, agreed with those estimated of laying performance dose-responses. These authors estimated that the threonine requirement was 455 mg per hen/d for EM, based on an average of two experiments. Coon and Zhang (Citation1999) suggested a daily requirement of 495 mg dThr. In their two experiments, they found threonine requirements of 11.1 and 8.43 mg/g of EM (the average for the two experiments of 9.77 mg/g of EM).
On the other hand, the dThr requirements determined in this research were lower than that reported by Huyghebaert and Butler (Citation1991). These researchers suggested a daily threonine requirement between 700 and 710 mg/hen for ISA Brown hens. However, maximum egg output (51.6 g) was obtained with a daily intake of 574 mg or 12.2 mg/g egg output. This wide range may be due to factors affecting the requirements such as hen strain, hen age, stage of egg production, dietary crude protein and amino acids level, environmental conditions, and even the variety of methods used in the determination of nutritional requirements (Huyghebaert and Butler Citation1991; Ishibashi et al. Citation1998; Nunes et al. Citation2015). Our result in this experiment indicated that estimation of threonine requirements depends on what production parameter is taken into consideration for optimisation. The predicted dThr requirements throughout the experiment using the quadratic broken-line model for optimal FCR was about 2.56 and 1.17% higher than those predicted for EP and EM, respectively.
Egg quality traits
No differences (p > .05) were observed as an effect of different dietary L-threonine levels on egg quality traits except HU measured at the end of the first period (105–108 wk of age) that increased with a quadratic trend (p < .05) due to dietary L-threonine supplementation. Our result agrees with previous researchers that reported that the increase in threonine intake unaffected egg quality traits (Sá et al. Citation2007; Schmidt et al. Citation2011; Cardoso et al. Citation2014), and egg component percentages (Applegate et al. Citation2009). Azzam et al. (Citation2014), reported that interior egg quality, as indicated by HU and albumen height, was improved in the hens fed the different dietary L-threonine levels. In agreement with our result, no effects were observed on eggshell quality as the level of dietary threonine increased (Azzam et al. Citation2011; Nunes et al. Citation2015). Gomez and Angeles (Citation2009) reported that increasing the threonine level from 0.42% to 0.54% had no effects on the albumen or yolk proportions. Nevertheless, the eggshell percentage declined as the dietary threonine level increased when continued for six weeks during the second cycle in laying hens. Cardoso et al. (Citation2014) found that feeding white laying hens a diet containing 0.523, 0.546, 0.569, 0.592, or 0.615% threonine for 17 weeks during the late laying period un-affects the egg quality, including the eggshell thickness, albumen, and yolk proportion. Azzam et al. (Citation2011) found that increasing the threonine level from 0.47% to 0.87% in laying hens aged 40 weeks during the summer season for eight weeks did not affect the HU, yolk colour, eggshell thickness, or strength. In addition, feeding laying hens diets supplemented with high levels of threonine (1, 2, or 3%) for two months during the post-peak period had no effects on the albumen height, HU score, yolk colour, and eggshell strength, but the eggshell thickness declined in a linear manner (Azzam et al. Citation2014). In brown laying hens, increasing the threonine level from 0.0% to 0.4% for 8 wks during the late laying period had no significant effects on the albumen height, eggshell percentage, or eggshell thickness, but the Haugh unit score was significantly improved (Abdel-Wareth and Esmail Citation2014). Also, it reported that increasing the dietary threonine levels in white or brown laying hens from 21 to 36 wk of age did not change the HU score (Valério et al. Citation2000). Moreover, Sá et al. (Citation2007) showed that the HU score was not affected by increasing the Thr levels in different strains of laying hens in an experiment conducted for 16 wk (from 34 to 50 wk of age).
Blood metabolites
The blood serum calcium, phosphorus, uric acid, total protein, and alkaline phosphatase concentration were not affected due to supplemental L-threonine (Table ). The values remained within the normal physiological range (Azzam et al. Citation2011; Weber et al. Citation2013). However, there is a lack of information on the effect of threonine on blood metabolites in layer hens. Our results in this experiment agree with that of other researchers who reported that supplementation with L-threonine had no effect on calcium, phosphorus, and alkaline phosphate of laying hens at 48 weeks of age (Azzam et al. Citation2011; Abdel-Wareth and Esmail Citation2014). Likewise, no significant effects on uric acid in plasma with increased in dietary lysine supplementation are observed (Chi and Speers Citation1976).
Immune responses
In agreement with our result, it is reported that dietary threonine levels did not affect the antibody titres to SRBC in male broilers (Takahashi et al. Citation1994). In contrast, other researchers reported that the immune system of the laying hen (Azzam et al. Citation2011), broilers (Kadam et al. Citation2008), and pigs (Defa et al. Citation1999; Wang et al. Citation2006) has a specific requirement for threonine that is higher than those required for productive performance traits. Azzam et al. (Citation2011) suggested that adding L-threonine at 0.3% of the diet resulted in linearly (p ≤ .05) increasing IgY and total Ig as compared with the control group fed with the un-supplemented L-threonine diet. They concluded that the dietary threonine levels needed to optimise immune responses might be higher than those needed to maximise egg productive performance because threonine occurs at a high concentration in γ-globulin that affects the immune function. Furthermore, Kadam et al. (Citation2008) observed that injections of 10, 20, or 30 mg of threonine into the yolk sac significantly increased the humoral response to SRBC in broilers at 21d post-hatch.
Conclusion
The outcomes of the present study showed that threonine is a limiting amino acid in laying hens fed wheat-based diets in the second production cycle needed for the optimisation of egg production. By the quadratic broken line regression fit model, the dThr requirements to optimise EP, EM, and FCR were estimated at 507, 514, and 520 mg/hen per day, respectively. The dThr requirement optimised for FCR was 2.56% and 1.17% higher than for EP and EM, respectively. The estimated dThr requirement per gram of egg mass-produced was 9.84–10.1 mg. Overall, threonine requirement depended on what parameter was considered optimisation. The dietary dThr concentration of 0.48%, dThr/dLys of 66%, and a daily dThr intake of 520 mg/bird are recommended for laying hens for optimise performance.
Acknowledgments
The authors would like to thank the Poultry Research Station and Animal Nutrition Laboratory for their valuable help, critiques, and suggestions and the Iran branch of Evonik Co. for the feedstuffs amino acid analysis.
Disclosure statement
No potential conflict of interest was reported by the authors.
Additional information
Funding
References
- Abdel-Wareth AAA, Esmail ZSH. 2014. Some productive, egg quality and serum metabolic profile responses due to l-threonine supplementation to laying hen diets. Asian J Poultry Sci. 8(3):75–81.
- Akbari Moghaddam Kakhki R, Golian A, Zarghi H. 2016a. Effect of dietary digestible lysine concentration on performance, egg quality, and blood metabolites in laying hens. J Appl Poult Res. 25(4):506–517.
- Akbari Moghaddam Kakhki R, Golian A, Zarghi H. 2016b. Effect of digestible methionine + cystine concentration on performance, egg quality and blood metabolites in laying hens. Br Poult Sci. 57(3):403–414.
- Allahdo P, Ghodraty J, Zarghi H, Saadatfar Z, Kermanshahi H, Edalatian Dovom MR. 2018. Effect of probiotic and vinegar on growth performance, meat yields, immune responses, and small intestine morphology of broiler chickens. Ital J Anim Sci. 17(3):675–685.
- AOAC. 2002. Official methods of analysis. 15th ed. Arlington (VA): Association of Official Analytical Chemists.
- Applegate TJ, Onyango EM, Angel R, Powers WJ. 2009. Effect of amino acid formulation and dietary direct-fed microbial supplementation on egg production and egg characteristics in laying hens. J App Poult Res. 18(3):552–561.
- Azzam MMM, Dong XY, Xie P, Wang C, Zou XT. 2011. The effect of supplemental L-threonine on laying performance, serum free amino acids, and immune function of laying hens under high-temperature and high-humidity environmental climates. J Appl Poult Res. 20(3):361–370.
- Azzam MMM, Yuan C, Liu GH, Zou XT. 2014. Effect of excess dietary threonine on laying performance, egg quality, serum free amino acids, and digestive enzymes activities of laying hens during the postpeak period. J Appl Poult Res. 23(4):605–613.
- Cardoso AS, Costa FGP, Ramalho de LM, Nogueira ET, Santos CS, Barboza de SR, Lima RC, Vieira DVG. 2014. Nutritional requirement of digestible threonine for white egg layers of 60 to 76 weeks of age. J Appl Poult Res. 23(4):724–728.
- Chi MS, Speers GM. 1976. Effects of dietary protein and lysine levels on plasma amino acids, nitrogen retention and egg prouduction in laying hens. J Nutr. 106(8):1192–1201.
- Coon C, Zhang B. 1999. Ideal amino acid profile for layers examined. Feedstuffs. 71(14):13–15.
- Defa L, Changting X, Shiyan Q, Jinhui Z, Johnson EW, Thacker PA. 1999. Effects of dietary threonine on performance, plasma parameters and immune function of growing pigs. Anim Feed Sci Tech. 78(3–4):179–188.
- Domingues CHF, Sgavioli S, Praes MFFM, Duarte KF, Castiblanco DMC, Santos ET, Alva JCR, Junqueira OM. 2012. Lysine and methionine + cystine for laying hens during the post-molting phase. Rev Bras Cienc Avic. 14(3):187–192.
- Dozier IWA, Moran JET, Kidd M. 2000. Threonine requirement of broiler males from 42 to 56 days in a summer environment. J Appl Poult Res. 9(4):496–500.
- Faria DE, Harms RH, Russell GB. 2002. Threonine requirement of commercial laying hens fed a corn-soybean meal diet. Poult Sci. 81(6):809–814.
- Fernandez SR, Aoyagi S, Han Y, Parsons CM, Baker DH. 1994. Limiting order of amino acids in corn and soybean meal for growth of the chick. Poult Sci. 73(12):1887–1896.
- Figueiredo GO, Bertechini AG, Fassani EJ, Rodrigues PB, Brito JÁ, Castro SF. 2012. Performance and egg quality of laying hens fed with dietary levels of digestible lysine and threonine. Arq Bras Med Vet Zootec. 64(3):743–750.
- Fouad AM, Zhang HX, Chen W, Xia WG, Ruan D, Wang S, Zheng CT. 2016. Estimation of L-threonine requirements for Longyan laying ducks. Asian-Australas J Anim Sci. 30(2):206–210.
- Ghavi S, Zarghi H, Golian A. 2021. Estimation of digestible sulphur amino acids requirements for growth performance and immune responses to Newcastle disease and avian influenza vaccination in broilers. Ital J Anim Sci. 20(1):1002–1014.
- Gomez S, Angeles M. 2009. Effect of threonine and methionine levels in the diet of laying hens in the second cycle of production. J Appl Poult Res. 18(3):452–457.
- Huyghebaert G, Butler EA. 1991. Optimum threonine requirement of laying hens. Br Poult Sci. 32(3):575–582.
- Ishibashi T, Ogawa Y, Itoh T, Fujimura S, Koide K, Watanabe R. 1998. Threonine requirements of laying hens. Poult Sci. 77(7):998–1002.
- Kadam MM, Bhanja SK, Mandal AB, Thakur R, Vasan P, Bhattacharyya A, Tyagi JS. 2008. Effect of in ovo threonine supplementation on early growth, immunological responses and digestive enzyme activities in broiler chickens. Br Poult Sci. 49(6):736–741.
- Khatibi SMR, Zarghi H, Golian A. 2021. Effect of diet nutrients density on performance and egg quality of laying hens during the post-peak production phase of the first laying cycle under subtropical climate. Ital J Anim Sci. 20(1):559–570.
- Kidd MT. 2004. Nutritional modulation of immune function in broilers. Poult Sci. 83(4):650–657.
- Kidd MT, Gerard PD, Heger J, Kerr BJ, Rowe D, Sistani K, Burnham DJ. 2001. Threonine and crude protein responses in broiler chicks. Anim Feed Sci Tech. 94(1-2):57–64.
- Kidd MT, Kerr BJ. 1996. L-threonine for poultry: a review. J Appl Poult Res. 5(4):358–367.
- Koelkebeck KW, Baker DH, Han Y, Parsons CM. 1991. Research note: effect of excess lysine, methionine, threonine, or tryptophan on production performance of laying hens. Poult Sci. 70(7):1651–1653.
- Mao X, Zeng X, Qiao SY, Wu G, Li D. 2011. Specific roles of threonine in intestinal mucosal integrity and barrier function. Front Biosci. 3(1192):1192–1200.
- Martinez-Amezcua C, Laparra-Vega JL, Avila-Gonzalez E, Fuente F, Jinez T, Kidd MT. 1999. Dietary L-threonine responses in laying hens. J Appl Poult Res. 8(2):236–241.
- mHy-Line. 2019. Hy-line variety W-36 commercial management guide 2016. West Des Moines (IA): Hy-Line International. Hy-Line International.
- Morris TR, Gous RM. 1988. Partitioning of the response to protein between egg number and egg weight. Br Poult Sci. 29(1):93–99.
- NRC. 1994. Nutrient requirements of domestic animals: Nutrient Requirements of Poultry. 9th ed. Washington DC: National Academy Press.
- Nunes RV, Agustini MAB, Takahashi SE, Murakami AE, De Souza C, Schneiders SE, Polese C. 2015. Nutritional requirement of digestible threonine for brown-egg laying hens from 50 to 66 weeks of age. Sem Ci Agr. 36(6):3877–3885.
- Quentin M, Bouvarel I, Picard M. 2005. Effects of the starter diet, light intensity, and essential amino acids level on growth and carcass composition of broilers. J Appl Poult Res. 14(1):69–76.
- Robbins KR, Saxton AM, Southern LL. 2006. Estimation of nutrient requirements using broken-line regression analysis. J Anim Sci. 84:155–165.
- Sá LM, Gomes PC, Rostagno HS, Albino LFT, D’Agostini P. 2007. Exigência nutricional de lisina digestível para galinhas poedeiras no período de 34 a 50 semanas de idade. R Bras Zootec. 36(6):1829–1836.
- SAS. 2003. SAS User’s guide: Statistics. Version 9. 1st ed. Cary (NC): SAS Inst. Inc.
- Schmidt M, Gomes PC, Rostagno HS, Albino LFT, Nunes CGV, Nunes RV. 2011. Níveis nutricionais de treonina digestível para poedeiras leves no segundo ciclo de produção. R Bras Zootec. 40(1):148–153.
- Schutte JB. 1998. The ideal amino acid profile for laying hens and broiler chicks. Pages 33–39 in Proceedings of the 1998 Arkansas Nutrition Conference; Fayetteville, AR.
- Tabatabaei Y, Golian A, Zarghi H, Varidi M. 2017. Effect of wheat-soy diet nutrient density and guanidine acetic acid supplementation on performance and energy metabolism in broiler chickens. Ital J Anim Sci. 16(4):593–600.
- Takahashi K, Konashi S, Akiba Y, Horiguchi M. 1994. Effects of dietary threonine level on antibody production in growing broilers. Anim Feed Sci Tech. 65(10):956–960.
- UFFDA. 1992. User-friendly feed formulation done again University of Georgia. Athens (GA): UFFDA.
- Valério SR, Soares PR, Rostagno HS, Almeida e Silva M, Albino LFT, Lana GRQ, Goulart C, Kill JL. 2000. Determination of threonine nutritional requirement for white-egg and brown-egg laying hens. Rev Bras Zootec. 29(2):518–524.
- Wang X, Qiao SY, Liu M, Ma YX. 2006. Effects of graded levels of true ileal digestible threonine on performance, serum parameters and immune function of 10–25 kg pigs. Anim Feed Sci Tech. 129(3–4):264–278.
- Weber GM, Machander V, Schierle J, Aureli R, Roos F, Pérez-Vendrell AM. 2013. Tolerance of poultry against an overdose of canthaxanthin as measured by performance, different blood variables and post-mortem evaluation. Anim Feed Sci Tech. 186(1–2):91–100.
- Zarghi H, Golian A, Nikbakhtzade M. 2020. Effect of dietary digestible lysine level on growth performance, blood metabolites and meat quality of broilers 23–38 days of age. J Anim Physiol Anim Nutr. 104(1):156–165.