
Abstract
Psychological assessment scales need to be psychometrically sound, but previous research on the factorial structure of one of the most common measures of trait reactance, the Hong Psychological Reactance Scale (HPRS), has provided multiple latent structures and contradicting findings, and the statistical methodology of previous research can be criticized. These issues raise questions regarding the interpretability and usefulness of the HPRS as a measure of trait reactance. In this two-part study, we followed contemporary statistical recommendations and tested the fit of 12 previously observed factor solutions of the HPRS using confirmatory factor analysis in two relatively large Finnish samples (n = 624 & 518). Furthermore, we tested what factor structure was supported by a data-driven exploratory factor analysis approach. Both our confirmatory and exploratory factor analyses supported a one-factor solution for the HPRS. However, in the exploratory analyses, the single factor accounted for only approximately 40% of the total variance. Our results also indicated that a reduced scale provided the best fit in our confirmatory analyses. Combined, these findings imply that the HPRS could use some improvement. Finally, to shed more light on the reactance construct and the construct validity of the HPRS, we replicated previous research showing negative associations between trait reactance and the Big Five Agreeableness and Conscientiousness traits.
1. Introduction
Brehm (Citation1966) defined psychological reactance as a motivational state that is triggered when a person perceives that their freedom of behavior is threatened. Later research has suggested that this motivational arousal (i.e., reactance) is best understood as an intermingling of affect (anger) and negative cognitions (Dillard & Shen, Citation2005; Quick et al., Citation2012; Rains, Citation2013). As a consequence of experiencing reactance, a person will want to restore or defend their perceived freedom. In this context, freedom refers to behaviors that a person values and feels entitled to, and consequently individuals will differ in what restrictions they consider threatening (Brehm & Brehm, Citation1981).
During its 50-year existence, psychological reactance theory has garnished substantial scientific inquiry, and it has impacted and received input from both clinical psychology and communication research (Rosenberg & Siegel, Citation2018). Although reactance was originally conceptualized as a temporary state, it was later reconceptualized as also reflecting a stable trait that predicts how prone a person is to experiencing reactance (Rosenberg & Siegel, Citation2018). However, the validity of trait reactance has been questioned by critics who argue that reactance is context-bound and therefore not stable across situations (Miron & Brehm, Citation2006; Shoham et al., Citation2004; see also Silvia, Citation2006). On the other hand, the Hong Psychological Reactance Scale (HPRS, Hong & Page, Citation1989), a measure of trait reactance, has shown an acceptable 6-week test-retest reliability (Hong & Faedda, Citation1996), and trait reactance measures possess utility, as they have been associated with several important outcomes in, for example, therapeutic treatment (Beutler et al., Citation2002), self-reported work performance (Yost et al., Citation2019), and health behavior (e.g., Miller et al., Citation2006; Miller & Quick, Citation2010). For example, Hornsey et al. (Citation2018) observed in a large multinational study that trait reactance was positively associated with antivaccination attitudes. The authors suggest that knowledge of such attitudinal barriers could help in creating and providing tailor-made interventions that take this predisposition into account (see also, e.g., Finkelstein et al., Citation2020).
1.1. The Hong Psychological Reactance Scale and the current two-part study
As trait reactance has been shown to have both scientific and practical utility, and as trait reactance scales are widely used, it is important to ascertain that the assessment scales are psychometrically sound. Hence, we have opted to scrutinize the HPRS that is one of the most commonly used trait reactance scales, as previous research has provided multiple latent structures for the scale. These contradicting findings raise questions concerning the interpretability of the scale and the reactance trait more generally.
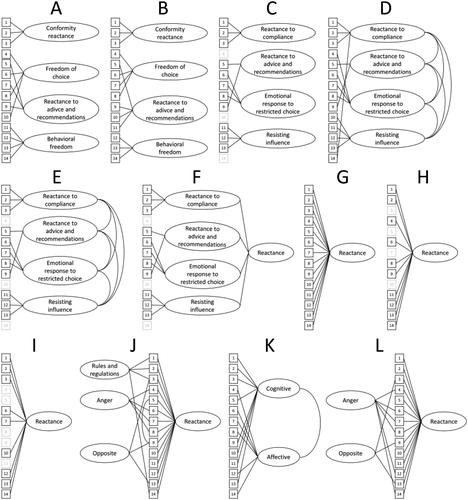
The HPRS was developed from an English translation of Merz’s Psychological Reactance Scale (Tucker & Byers, Citation1987; see also Hong & Ostini, Citation1989; Merz, Citation1983). For the following rundown of previous research on the factorial structure of the HPRS, please use as a visual aid and see Supplementary material A for exact scale items. The HPRS originally included 14 Likert-scale items that produced a four-component orthogonal structure: (1) freedom of choice, (2) conformity reactance, (3) behavioral freedom, and (4) reactance to advice and recommendations (Hong & Page, Citation1989). Later work by Hong and Faedda (Citation1996) led to a refined 11-item version. However, the orthogonal four-factor structure of the HPRS has been challenged in several more recent studies, which have collectively produced a multitude of candidate models for the underlying structure of the HPRS. Using confirmatory factor analysis (CFA), Thomas, Donnell, and Buboltz (Citation2001) observed that an oblique four-factory structure provided a better fit than the originally proposed orthogonal structure. Shen and Dillard (Citation2005) argued for the addition of a unidimensional second-order factor. Jonason and Knowles (Citation2006) argued for a one-factor solution (see also Jonason et al., Citation2010). Brown et al. (Citation2011; see also Yost & Finney, Citation2018) and Moreira et al. (Citation2019) argued for somewhat different bifactor models, while De las Cuevas et al. (Citation2014) observed that a two-factor model (cognitive, affective) provided the best fit in a sample of psychiatric outpatients. Regarding statistical methodology, Hong’s original work has been criticized for implementing principal components analysis with orthogonal rotationFootnote1 (Brown et al., Citation2011; Jonason & Knowles, Citation2006). Furthermore, only one of the relevant studies (Moreira et al., Citation2019) report using estimation methods appropriate for ordinal data (such as robust WLS; see recommendations by e.g., Brown, Citation2015) and parallel analysis in deciding how many factors to extract in exploratory analyses (for recommendations, see Baglin, Citation2014; Hayton et al., Citation2004; Ledesma & Valero-Mora, Citation2007; Timmerman & Lorenzo-Seva, Citation2011).
Figure 1 Previously reported factor-structures for the Hong Psychological Reactance Scale. Numbers 1–14 represent the scale items.
A = Hong and Page (Citation1989). Principal component analysis on 14-item scale, n = 257.
B = Hong (Citation1992). Principal component analysis on 14-item scale, n = 462.
C = Hong and Faedda (Citation1996). Principal component analysis on 11-item scale, n = 3085.
D = Thomas et al. (2001 A). Confirmatory factor analysis (CFA) on 14-item scale, n = 905.
E = Thomas et al. (2001 B). CFA on 11-item scale, n = 539.
F = Shen and Dillard (Citation2005). CFA on 11-item scale, n = 621.
G = Jonason and Knowles (Citation2006 A). CFA on Tucker and Byers (Citation1987) 18-item scale (only 14 items included here), n = 288.
H = Jonason and Knowles (Citation2006 B). CFA on Tucker & Byers’ (1987) 18-item scale (reduced scale, only 14 items included here), n = 288.
I = Jonason et al. (Citation2010). Principal component analysis and CFA on 18-item scale (Tucker & Byers, Citation1987) (reduced scale, only 14 items included here), n = 240.
J = Brown et al. (Citation2011). CFA on 14-item scale, n = 1286.
K = De las Cuevas et al. (Citation2014). Principal component analysis and CFA on 14-item scale, n = 354.
L = Moreira et al. (Citation2019). CFA on 14-item scale, n = 1301 & 327 (adolescents).
The present two-part study implemented the abovementioned methodological recommendations and investigated the factorial structure of the HPRS in two separate Finnish samples. In Study 1, the main aim was to investigate the factorial structure of the HPRS in a sample of Finnish parents with both confirmatory and exploratory factor analyses. Study 2 focused on investigating the HPRS from a methodological and generalizability-related perspective by testing how minor alterations in wording in some of the HPRS items affected response distributions and the factor structure of the scale in a separate sample of Finnish participants recruited via Facebook. Additionally, in Study 1, a secondary aim was to investigate the construct validity of the HPRS by replicating previous research that had shown negative associations between the HPRS and especially the Agreeableness and Conscientiousness Big Five personality traits. These negative associations were hypothesized to result from more agreeable individuals being more accepting towards relinquishing personal freedom due to their cooperative and compliant nature. On the other hand, those lower in Conscientiousness tend to be less responsible and dependable, which could also be related to a higher dislike of rules and regulations that should be relevant for reactance-propensity (Yost & Finney, Citation2018). This replication was motivated by the need to establish a nomological network of trait reactance, that is, demonstrate how trait reactance is related to other established individual difference variables (Dowd & Wallbrown, Citation1993; Seemann et al., Citation2005).
2. Study 1
In Study 1, we assessed the fit of previously suggested factor structures of the HPRS in Finnish parents, which is a hitherto unstudied population within this context. Additionally, we attempted to replicate previous research indicating that trait reactance is negatively associated with the Big Five traits Agreeableness and Conscientiousness (Yost & Finney, Citation2018).
2.1. Method
2.1.1. Ethics statement
The study was approved by the Ethics Committee of the Hospital District of Southwest Finland. Informed consent was obtained from all participants.
2.1.2. Participants and procedure
The HPRS and Ten Item Personality Inventory (TIPI; Gosling et al., Citation2003) were included in a larger survey study that investigated vaccine attitudes among Finnish parents. Therefore, all participants were parents or caregivers to at least one child that was younger than 4.5 years. The survey invitation was sent in the end of May 2018 per mail to 3401 participants in the FinnBrain Birth Cohort Study (www.finnbrain.fi) (Karlsson et al., 2018). Included in the invitation was a participant-specific web-address with which the participant accessed the online survey.Footnote2 The entire survey took approximately 20 minutes to complete. Our sample consisted of 739 respondents who had complete HPRS data (disregarding item 11, see section 2.2): 624 respondents completed the survey in Finnish and 115 in SwedishFootnote3 (see for descriptive information).
Table 1 Descriptive statistics of the subsamples in Study 1.
2.1.3. Measurement scales
We included Finnish and Swedish translations of the 14-item HPRS (Hong & Faedda, Citation1996; Hong & Page, Citation1989). The English HPRS was translated into Swedish by the authors of this study, and this Swedish translation was in turn translated into Finnish by a private translation agency. Responses were given on a 5-point Likert-scale (1 = completely disagree, 2 = partly disagree, 3 = neither agree nor disagree, 4 = partly agree, and 5 = completely agree). A higher score indicated higher trait reactance. The Big Five personality traits were assessed with Finnish and Swedish translations of the TIPI (Gosling et al., Citation2003). The Swedish TIPI was retrieved from the GozLab webpage,Footnote4 and this Swedish version was translated into Finnish by the same private translation agency that had translated the HPRS. The TIPI consists of ten items (two for each Big Five trait) that are scored on a 7-point Likert-scale (1 = disagree strongly, 2 = disagree moderately, 3 = disagree a little, 4 = neither agree nor disagree, 5 = agree a little, 6 = agree moderately, 7 = agree strongly).
2.1.4. Statistical analyses
As only 115 respondents completed the HPRS in Swedish, we restricted our statistical analyses to the Finnish-speaking subsample. However, we report response distributions of the Swedish-speaking sample in Supplementary material A and discuss their implications, as it sheds light on important methodological considerations. In order to assess the factorial structure of the HPRS, we used both confirmatory and exploratory factor analysis. In all analyses, we only included the 624 respondents who had complete HPRS data (i.e., we allowed no missing values on any of the relevant items).
2.1.4.1. Confirmatory factor analyses
In our CFAs, we tested to what degree the 12 previously observed factor solutions of the HPRS fitted our data (see ). All CFA models were created to correspond as closely as possible to the models that had been proposed by the respective authors. The items that were specified to load on each factor are displayed in . In Models A-C, we tested the three different versions of the four-factor model proposed by Hong and Page (Citation1989), Hong (Citation1992), and Hong and Faedda (Citation1996). These factor solutions were observed using principal component analysis with orthogonal rotation, and therefore, the factor co-variances in these models were fixed to zero. Models D-E tested the two four-factor solutions proposed by Thomas et al. (2001) where the factors were allowed to co-vary. Hence, in these models, we specified the co-variances as freely estimated. In Model F, we tested the second-order factor solution proposed by Shen and Dillard (Citation2005). Models G-I tested the three different one-factor solutions suggested by Jonason and Knowles (Citation2006) and Jonason et al. (Citation2010), who used an 18-item scale (Tucker & Byers, Citation1987). As the present study employed the 14-item scale, fewer items were specified as indicators. Model J tested the bi-factor solution of Brown et al. (Citation2011, see also Yost & Finney, Citation2018). In Model K, we tested the two-factor solution proposed by De las Cuevas et al. (Citation2014). Here, factor co-variances were specified as freely estimated. Lastly, in Model L, we tested the bi-factor solution of Moreira et al. (Citation2019). In all models, cross-loadings and error correlations between indicators were fixed to zero. All models were statistically identified with df > 0.
The CFAs were computed with version 0.6-3 of the lavaan package (Rosseel, Citation2012) in R version 3.5.2 (R Core Team, Citation2018), see Supplementary material B for R script.Footnote5 As the fitting function, we used robust WLS (WLSMV), which is an estimation method suitable for ordinal and non-normal data. When indicators are measured on an ordinal scale, estimators developed for continuous data, such as maximum likelihood (ML), can result in underestimation of relationships between indicators as well as distorted test statistics. There is also a higher risk of obtaining artefactual factors due to irrelevant item qualities, such as level of difficulty or extremeness (Brown, Citation2015, p. 353). Unlike ML that uses the observed covariance matrix, WLSMV analyzes the asymptotic covariance matrix based on the polychoric correlations among the indicators. The polychoric correlations assume that the construct measured on the ordinal scale has an underlying continuous and normal distribution. The correlations utilized in WLSMV estimation are, thus, the correlations between these underlying variables, and not between the observed variables.
As indicators of model fit, we used the comparative fit index (CFI), the Tucker-Lewis index (TLI), the root mean square error of approximation (RMSEA), and the standardized root mean square residual (SRMR). For both CFI and TLI, we considered a cutoff of .95 as indicative of good model fit, for RMSEA, .06, and for SRMR, .08 (Hu & Bentler, Citation1999).
2.1.4.2. Exploratory factor analysis
Due to the multitude of candidate models, limited replications, and possible methodological shortcomings in relevant previous articles, we also wanted to explore what factor structure we would obtain by using a data-driven exploratory factor analysis approach. For the exploratory factor analysis, we used the FACTOR program (Lorenzo-Seva & Ferrando, Citation2006, Citation2013) and followed recommendations to use the polychoric correlation matrix and minimum rank factor analysis, as well as parallel analysis in defining the number of factors to extract (Baglin, Citation2014).
2.2. Results
We noticed that item 11 of our translated HPRS consistently showed low factor loadings (standardized loadings between .128 and .258 depending on the model). Upon closer inspection, it became apparent that the translated item differed from the original English version. The English item reads, “I resist the attempts of others to influence me” (Hong & Page, Citation1989),Footnote6 while our Finnish translation was more akin to “I am able to resist the attempts of others to influence me” [emphasis added]. Due to the low factor loadings and difference in wording, item 11 was not included in any analyses in Study 1.
2.2.1. Confirmatory factor analyses
depicts the model fit indices for the 12 previously observed HPRS factor solutions (Models A-L). Presently, six of the models could not be empirically identified, and none resulted in good model fit. The empirically underidentified Models C-F all included factors with only two indicators (in some instances because we excluded item 11), which is a possible source for the improper solutions produced by these models, such as out-of-range factor correlations and indicator variances. The bifactor models (Model JFootnote7 & L) both produced an out-of-range value in the form of a negative factor variance, indicating misspecification of the model. The four-factor solutions in Model A and B, where factors were specified as uncorrelated, provided the worst fit to the data. The best fitting models were the reduced one-factor Models H and I (Model H is depicted in ), although they reached good model fit on only one of the fit indices (SRMR < .08). As the identified models were not nested, we did not conduct statistical comparison in fit between models.
Figure 2 Factor loadings in the best-fitting confirmatory model H of the Hong Psychological Reactance Scale.
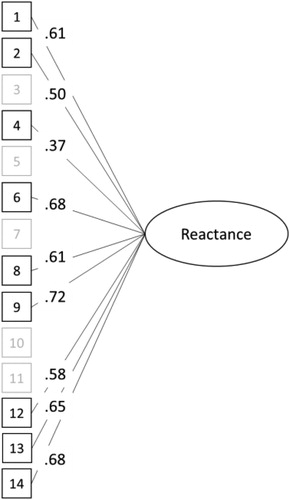
Table 2 Fit statistics of previous Hong Psychological Reactance Scale models.
2.2.2. Exploratory factor analysis
The Kaiser-Meyer-Olkin test of sampling adequacy was 0.89 and Bartlett’s test of sphericity was significant, χ2(78, N = 624) = 2085.9, p < .001, which suggested that the data were adequate for factor analysis. Parallel analysis indicated that only one factor be extracted, and that single factor explained 62.1% of the common variance and 38.0% of the total variance (see for factor loadings and communalities).
Table 3 Factor loadings and communalities in the one-factor Hong Psychological Reactance Scale.
As several of the previous exploratory analyses of the factorial structure of the HPRS have used the Pearson correlation matrix, which tends to underestimate the associations between ordinal-scale items (Gadermann et al., Citation2012; Holgado-Tello et al., Citation2010), we present a comparison of the polychoric and Pearson correlation matrices for our data in . As can be observed, the polychoric correlations tend to be higher than the Pearson correlations.
Table 4 The polychoric (below diagonal) and Pearson (above diagonal) correlation matrices of the Hong Psychological Reactance Scale.
2.2.3. The HPRS and the Big Five
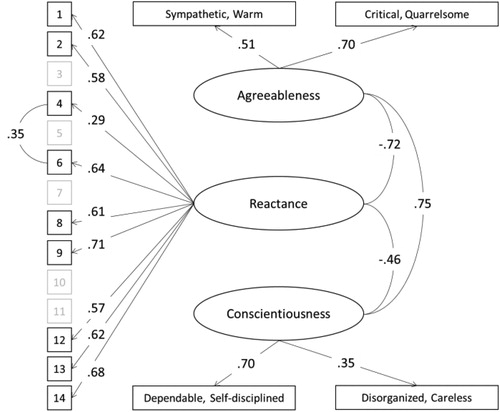
We assessed the association between HPRS trait reactance and the Big Five traits Agreeableness and Conscientiousness by specifying a three-factor model including the factors Reactance, Agreeableness, and Conscientiousness where the factor co-variances were freely estimated. For the reactance factor, we chose to implement Model H as it showed the best fit (although it was only marginally better than Model I, see ). Based on modification indices and theoretical considerations,Footnote8 we included an error correlation between items 4 and 6. The three-factor model fit the data moderately well, df = 61, χ2 = 233.73, CFI = .94, TLI = .92, RMSEA = .07, SRMR = .06 (see ).
Figure 3 Model depicting the associations between latent variables for trait reactance (Hong Psychological Reactance Scale, reduced ancillary model), Agreeableness, and Conscientiousness (Ten Item Personality Inventory). N = 624. Missing data – Sympathetic, Warm: 0.80%; Dependable, Self-disciplined: 0.32%; Disorganized, Careless: 0.64%; Number of missing patterns: 6.
2.3. Discussion
In the present, relatively large, sample (N = 624), both confirmatory and exploratory factor analyses of the HPRS supported a one-factor solution. This finding contradicts some previous results suggesting a multifactorial structure for the scale (De las Cuevas et al., Citation2014; Hong & Faedda, Citation1996; Thomas et al., 2001), but supports (Jonason & Knowles, Citation2006) or is partly in line with others who advocate the use of a unitary HPRS score (Brown et al., Citation2011; Moreira et al., Citation2019; Yost & Finney, Citation2018). This discrepancy may stem from our use of the polychoric correlation matrix, while most previous studies have assumedly used the Pearson correlation matrix and thus, potentially, underestimated the associations between the ordinal-scale HPRS items.Footnote9 Furthermore, by relying on the Kaiser criterion and/or a Scree test, previous exploratory research might have overestimated the number of factors to retain (we would have retained two factors according to the Kaiser criterion). In our exploratory analysis, we implemented parallel analysis that is considered a better method of deciding how many factors to retain (Ledesma & Valero-Mora, Citation2007).
It is, however, important to observe that our best-fitting confirmatory model was a reduced model that was based on a model by Jonason and Knowles (Citation2006).Footnote10 This model did not include items 3, 5, 7, and 10, it achieved good model fit on only one of the fit indices, and it departs from the typical 14- or 11-item versions. The absence of some of the items could in part explain why the reduced unidimensional model showed the best fit, as previous research has suggested that trait reactance is a unidimensional construct, but that the HPRS artificially produces multiple factors due to similar item wording and/or content (Moreira et al., Citation2019; Yost & Finney, Citation2018). Therefore, by removing some of the items, the wording/content-specific overlap between the remaining items might have been reduced. Be that as it may, combined, these results suggest that the HPRS is not an “optimal” scale in its current state.
Our results replicate the findings of Yost and Finney (Citation2018) in that trait reactance was significantly negatively associated with both the Agreeableness and Conscientiousness traits. However, in the present study, the associations were stronger than in the study by Yost and Finney (Citation2018), which could be a result of the TIPI that only has two items for each Big Five trait (Yost & Finney, Citation2018, used the Big Five Inventory that comprises nine items for both Agreeableness and Conscientiousness, John & Srivastava, Citation1999). This could potentially have exaggerated the presently observed associations, especially in the case of the Agreeableness-reactance association, as the Agreeableness item “Critical, Quarrelsome” is akin to some of the HPRS items (especially item 2, see Supplementary material A). Nevertheless, considering the results of both the present study and that of Yost and Finney (Citation2018), it is clear that these traits (especially reactance and Agreeableness) have quite a lot in common.
A limitation to the generalizability of our current results is the fact that we used translations instead of the original HPRS.Footnote11 This could have affected the present results as we found evidence that some of the translated items differed from the original in semantic nuance. This was most apparent in item 14, where the Finnish version had a word for “submit” that mostly corresponds to “agree” or “comply” in English. The Swedish translation, on the other hand, corresponded more strongly to the original English version, and interestingly, the two language groups’ (Finnish & Swedish) response distributions on this item were very different (see Supplementary material A). This suggests that the wording might have affected the response distributions. Therefore, in Study 2, we attempted to rectify the discrepancies in wording between our Finnish translation and the original English version, and tested whether it affected response distributions and the currently observed unidimensional factor structure of the HPRS.
3. Study 2
In Study 2, we edited some of the Finnish HPRS items so that they would more exactly reflect the original English version (see Supplementary material A), and tested if this affected the response distributions and factor structure of the scale.
3.1. Method
3.1.1. Ethics statement
The study was approved by the Joint Ethics Committee of the Departments of Psychology and Logopedics, Åbo Akademi University. Informed consent was obtained from all participants.
3.1.2. Participants and procedure
The 14-item HPRS was included in a larger study that investigated sexuality and perceived mate value, among other topics. Participants were recruited with the help of a Facebook ad that was directed at Finnish speaking Facebook users. Participants completed the survey online in SurveyAnalytics. After the first recruitment-wave, the survey had been completed by a higher number of women than men, and therefore, only men were enrolled in a subsequent recruitment-wave. After excluding those participants who did not provide answers to the 14-item HPRS, the final sample consisted of 518 respondents (see for descriptive information).
Table 5 Descriptive information of the sample recruited via Facebook.
3.1.3. The HPRS
To better match the English original version of the HPRS, we made minor changes in the wording in altogether ten of the fourteen Finnish items. The response distributions, exact items, and descriptions of the changes we made, are presented in Supplementary material A.
3.1.4. Statistical analyses
In order to assess the factorial structure of the HPRS, we made identical confirmatory and exploratory factor analyses as in Study 1. Note that item 11 was included in the analyses in Study 2.
3.2. Results
A visual inspection of the response distributions showed that the Facebook sample in Study 2 had higher HPRS trait reactance scores than the sample in Study 1 (see Supplementary material A). This pattern of results is also true for the four items that were identical in both studies.
3.2.1. Confirmatory factor analyses
Overall, the results are very similar to Study 1 (compare and ). Again, Models C-F and J were empirically underidentified. However, in Study 2, the bifactor Model L converged, but it did not provide as good measures of model fit as the reduced one-factor model that again provided the best fit to the data ().
Figure 4 Factor loadings in the best-fitting confirmatory model H of the Hong Psychological Reactance Scale.

Table 6 Fit statistics of eleven previous Hong Psychological Reactance Scale models.
3.2.2. The exploratory factor analysis
The Kaiser-Meyer-Olkin test of sampling adequacy was 0.91 and Bartlett’s test of sphericity was significant, χ2(91, N = 518) = 2203.9, p < .001, which suggested that the data were adequate for factor analysis. Parallel analysis indicated that only one factor be extracted, and that single factor explained 66.1% of the common variance and 40.2% of the total variance (see for factor loadings and communalities). As in Study 1, we have included the polychoric and Pearson correlation matrices (see ).
Table 7 Exploratory factor analysis loadings and communalities of the one-factor Hong Psychological Reactance Scale.
Table 8 The polychoric (below diagonal) and Pearson (above diagonal) correlation matrices of the Hong Psychological Reactance Scale.
3.3. Discussion
The results of our confirmatory and exploratory factor analyses in Study 2 replicated the findings we observed in Study 1, indicating that the underlying latent structure of the HPRS is best described as unidimensional.
The fact that the participants’ trait reactance scores were higher in Study 2 than in Study 1 also on items that were identical in both studies suggests that this difference is not solely due to the changes in wording that was made in some of the HPRS items (see Supplementary material A). Therefore, it is difficult to conclude whether the revised wording had affected the response distributions in Study 2. However, in item 14 of the HPRS, it seems obvious that the use of the word “comply” (in Study 1) or “submit” (in Study 2) in our Finnish translations has had an impact on the response distributions so that the item is negatively skewed in Study 1, but approximately evenly distributed in Study 2 (see Supplementary material A). This conclusion is backed up by the fact that the Swedish subsample in Study 1 and the Finnish sample in Study 2 have similar response distributions and more closely corresponding wording on that specific item.
4. General discussion
Psychological assessment scales need to be psychometrically sound, however, even though the HPRS is one of the most commonly used measures of trait reactance, previous research has failed to converge on a common factorial structure for the scale (see e.g., De las Cuevas et al., Citation2014). A possible reason for this variability may be that many previous studies on the topic have potentially been hampered by suboptimal statistical methods (Brown et al., Citation2011). This issue raises questions regarding the scale’s reliability and also about practical issues related to how the HPRS should be used and interpreted. In the present two-part study involving two relatively large Finnish samples (n = 624 & 518), we wanted to ameliorate the situation by testing the fit of 12 previously suggested latent structures of the HPRS when using appropriate statistical methods. Furthermore, to shed light on the reactance construct and the construct validity of the HPRS, we attempted to replicate previous research that showed negative associations between the HPRS and the Agreeableness and Conscientiousness Big Five traits (Yost & Finney, Citation2018).
Our confirmatory and exploratory factor analyses in both Studies 1 and 2 indicated a one-factor solution for the HPRS. The present one-factor solution supports the results of Jonason and Knowles (Citation2006; see also Jonason et al., Citation2010) and partly Brown et al. (Citation2011; see also Yost & Finney, Citation2018) and Moreira et al. (Citation2019), but contradicts several other previous studies that have obtained multifactorial structures for the scale (including Hong’s original work). As discussed in the Discussion of Study 1, the previous discrepant findings could be the result of differing statistical methods that might have resulted in a higher number of factors in some of the previous studies. The present results suggest that the HPRS is best interpreted as unidimensional. Simultaneously, however, it seems that the scale could be improved, as the confirmatory analyses supported a reduced scale that did not match the typical 14- or 11-item versions. Also, in the exploratory analyses, the single factor accounted for “only” 40% of the total variance. Moreover, previous research has shown less-than-ideal convergent validity for the Questionnaire for Measuring Psychological Reactance, which is an English translation of Merz’s reactance scale (1983) and relative/precursor of the HPRS. The correlations between that scale and the Therapeutic Reactance Scale (another measure of trait reactance, Dowd et al., Citation1991) have ranged from .50 to .58 (Buboltz et al., Citation1999; Dowd & Wallbrown, Citation1993; Dowd et al., Citation1994), which is less than a recommended .70 (Carlson & Herdman, Citation2012). On the other hand, Moreira et al. (Citation2019) reported a high association (β = .89) between the HPRS and the Therapeutic Reactance Scale in a structural equation modeling analysis with a large sample of adolescents, but the model did not show adequate model fit (CFI = .96, TLI = .87, RMSEA = .16, & SRMR = .08). The same authors reported a markedly smaller association (r = .50) for composite scores in a different smaller sample of adolescents (Moreira, et al., Citation2019). This potentially indicates that the HPRS is not a comprehensive measure of trait reactance, and further research is needed to clarify this issue. A potentially productive method for refining a future trait reactance scale is to expand the research on how specific trait reactance items are related to objectively observable behaviors and outcomes (not only self-reported attitudes, feelings, behaviors, and personality traits), and use those observations, in combination with confirmatory studies, to select items that show temporal stability and predictive value (beyond other traits such as Agreeableness) for outcomes that are relevant from a trait reactance perspectiveFootnote12 (see also Yost & Finney’s, Citation2018, recommendations for revising the HPRS items).
Our results corroborate the findings of Yost and Finney (Citation2018), in that trait reactance was negatively associated with both the Agreeableness and Conscientiousness traits (however, see Seemann et al., Citation2005Footnote13). Yost and Finney (Citation2018) suggested that because more agreeable individuals tend to be more compliant, they might experience less psychological reactance when their freedoms are threatened or restricted. Individuals lower in Conscientiousness, on the other hand, tend to be less responsible and dependable, which may be related to higher trait reactance due to a greater tendency to dislike rules and regulations. These results fit with previous personality profile accounts of predispositionally reactant individuals that describe them as aggressive, dominant, persuasive, defensive, and quick to take offense (Buboltz et al., Citation1999; Dowd & Wallbrown, Citation1993); and “less likely to follow social norms and rules and [who] may be somewhat careless about fulfilling duties and obligations” (Dowd et al., Citation1994, p. 609). Moreover, previous research has indicated negative associations between trait reactance, as assessed by the Therapeutic reactance scale, and the persistence, cooperativeness, and, to some extent, self-directedness dimensionsFootnote14 (Inman et al., Citation2019) of the psychobiological model of personality (Cloninger et al., Citation1993). This is to be expected, as Cloninger’s Temperament and Character Inventory (a self-rating scale that assesses the dimensions of the psychobiological model, Cloninger et al., Citation1993) has shown significant overlap with the Big Five (Capanna et al., Citation2012; De Fruyt et al., Citation2000; Garcia, Citation2012; Ramanaiah et al., Citation2002). More specifically, persistence and self-directedness have been significantly associated with Conscientiousness (r’s .46–.57 and .40–.45 respectively), and cooperativeness with Agreeableness (r’s .51–.64). Furthermore, trait reactance has been positively associated, albeit somewhat weakly and tentatively, with procrastination (Malatincová, Citation2015) that in turn has been negatively associated with Conscientiousness (r = −.63; van Eerde, Citation2003). Combined, these results provide some convergent validity for the currently replicated trait reactance-Big Five associations.
Interestingly, the sample recruited via Facebook in Study 2 reported substantially higher levels of trait reactance than the sample in Study 1. Based on the present study, it is difficult to draw conclusions on the reasons behind this difference. However, a feasible explanation is participant characteristics. It is possible that the parents that are active in the FinnBrain Birth Cohort Study, which includes measurements during multiple time points over several years, are more compliant by nature than the participants in Study 2 who were recruited via Facebook (who only completed one survey). Predispositionally reactant individuals may be less inclined to participate in a multi-year longitudinal study that could be perceived as restricting personal freedom. Another possible reason is that parents to small children (Study 1) could consider reactance as socially undesirable, due to the aggressive nature of reactance (e.g., Buboltz et al., Citation1999), and therefore underreport their tendencies to experience reactance. Unfortunately, we did not collect data on whether the participants in Study 2 had children, and therefore we could not test if parenthood was associated with lower HPRS scores. On the other hand, an alternative explanation is that the sample recruited via Facebook was for some reason higher in trait reactance than people on average, and that the parents in Study 1 more closely represent the general population in this regard.
The main limitation/concern in the present studies are the potential issues with comparability and generalizability due to our Finnish translation of the English HPRS. Our studies indicated that a rather subtle difference in wording in especially item 14 of the HPRS strongly affected the response distributions on that item. Therefore, the current results could be scale/translation-specific. However, even though we made changes in some of the HPRS items, we still obtained strongest support for the same unidimensional factor-structure in both Studies 1 and 2, which suggests that this underlying latent structure appears rather robust.
In conclusion, our results support a unidimensional latent structure for the HPRS, and we also observed that this latent factor was significantly negatively associated with the Agreeableness and Conscientiousness traits. However, as pointed out also by others, the HPRS does not seem optimal in its current state (e.g., Jonason & Knowles, Citation2006; Yost & Finney, Citation2018).
Supplemental Material
Download MS Word (74.6 KB)Disclosure statement
No potential conflict of interest was reported by the author(s).
Notes
1 Both principal components analysis and (exploratory) factor analysis are data reduction methods. However, while principal components analysis is a linear combination of variables that maximizes the retained variance, exploratory factor analysis attempts to identify latent variables that explain the relationships among the observed variables (Preacher & MacCallum, Citation2003). Orthogonal rotation forces the components or factors to be uncorrelated, which is rarely warranted in this kind of psychological research.
2 Due to a technical error, some responses were not registered for all participants, and in October 2018, a second batch of 3101 invitations were sent (including 448 letters with requests to redo the survey).
3 Finland is officially a bilingual nation that has a Swedish-speaking minority that constitutes approximately 5% of the total population.
5 Due to data privacy, the raw data for Study 2 cannot be shared.
6 Copyright© by Sage Publishing, reprinted with permission.
7 We also tested the slightly different bifactor model reported in Yost and Finney (Citation2018). In that model, the factor pattern coefficients were constrained to be equal for items 5 and 9 (instead of using a correlated error), but this model was not empirically identified.
8 Both item 4 and 6 are related to dependence, and their similarity was possibly pronounced in our translation as both items included a reference to independence from others (see Supplementary material A).
9 The participants in Moreira et al. (Citation2019) consisted of adolescents, which could explain why they observed best support for a different latent structure.
10 Jonason and Knowles used an 18-item scale (see Tucker & Byers, Citation1987), while we used the 14-item scale (Hong & Page, Citation1989).
11 It is also possible that the observed one-factor structure is dependent on the present sample of Finnish parents, but this seems intuitively unlikely. That is, why would the factor structure of the HPRS be more uniform among Finns than among, e.g., Australians, and/or why would it be more uniform among parents to young children than, e.g., college students?
12 Using this method, items in a trait reactance scale would be selected on the basis of their temporal stability and ability to predict (beyond other traits such as Agreeableness) a reactance responses when, e.g., avid smokers are informed that their employers will prohibit smoking during work hours, pacifists are informed that their governments will institute conscription etc.
13 Seemann et al. (200559) found a significant association between trait reactance, as measured by the Therapeutic Reactance Scale (TRS), and Agreeableness, but not between trait reactance and Conscientiousness, which potentially highlights the differences between the TRS and HPRS trait reactance scales.
14 Briefly and somewhat selectively reported, Persistence has been described to reflect perseverance despite frustration and fatigue; Cooperativeness has been described to reflect acceptance of others, agreeability, helpfulness, and compassion; and Self-directedness has been described to reflect self-determination, sense of responsibility, and an ability to control and regulate behavior (Cloninger et al., Citation1993).
References
- Baglin, J. (2014). Improving your exploratory factor analysis for ordinal data: A demonstration using FACTOR. Practical Assessment, Research & Evaluation, 19(5) 1–14.
- Beutler, L. E., Moleiro, C., & Talebi, H. (2002). Resistance in psychotherapy: What conclusions are supported by research. Journal of Clinical Psychology, 58(2), 207–217. https://doi.org/10.1002/jclp.1144
- Brehm, J. W. (1966). A theory of psychological reactance. Academic Press.
- Brehm, S. S., & Brehm, J. W. (1981). Psychological reactance: A theory of freedom and control. Academic Press.
- Brown, A. R., Finney, S. J., & France, M. K. (2011). Using the bifactor model to assess the dimensionality of the Hong psychological reactance scale. Educational and Psychological Measurement, 71(1), 170–185. https://doi.org/10.1177/0013164410387378
- Brown, T. A. (2015). Confirmatory factor analysis for applied research. The Guilford Press.
- Buboltz, W. C., Woller, K. M. P., & Pepper, H. (1999). Holland code type and psychological reactance. Journal of Career Assessment, 7(2), 161–172. https://doi.org/10.1177/106907279900700205
- Capanna, C., Struglia, F., Riccardi, I., Daneluzzo, E., Stratta, P., & Rossi, A. (2012). Temperament and character inventory-R (TCI-R) and Big Five questionnaire (BFQ): Convergence and divergence. Psychological Reports, 110(3), 1002–1006. https://doi.org/10.2466/02.03.09.PR0.110.3.1002-1006
- Carlson, K. D., & Herdman, A. O. (2012). Understanding the impact of convergent validity on research results. Organizational Research Methods, 15(1), 17–32. https://doi.org/10.1177/1094428110392383
- Cloninger, C. R., Svrakic, D. M., & Przybeck, T. R. (1993). A psychobiological model of temperament and character. Archives of General Psychiatry, 50(12), 975–990. https://doi.org/10.1001/archpsyc.1993.01820240059008
- De Fruyt, F., Van De Wiele, L., & Van Heeringen, C. (2000). Cloninger's psychobiological model of temperament and character and the five-factor model of personality. Personality and Individual Differences, 29(3), 441–452. https://doi.org/10.1016/s0191-8869(99)00204-4 https://doi.org/10.1016/S0191-8869(99)00204-4
- De las Cuevas, C., Peñate, W., Betancort, M., & de Rivera, L. (2014). Psychological reactance in psychiatric patients: Examining the dimensionality and correlates of the Hong psychological reactance scale in a large clinical sample. Personality and Individual Differences, 70, 85–91. https://doi.org/10.1016/j.paid.2014.06.027
- Dillard, J. P., & Shen, L. (2005). On the nature of reactance and its role in persuasive health communication. Communication Monographs, 72(2), 144–168. https://doi.org/10.1080/03637750500111815
- Dowd, E. T., Milne, C. R., & Wise, S. L. (1991). The therapeutic reactance scale: A measure of psychological reactance. Journal of Counseling & Development, 69(6), 541–545. https://doi.org/10.1002/j.1556-6676.1991.tb02638.x
- Dowd, E. T., & Wallbrown, F. (1993). Motivational components of client reactance. Journal of Counseling & Development, 71(5), 533–538. https://doi.org/10.1002/j.1556-6676.1993.tb02237.x
- Dowd, E. T., Wallbrown, F., Sanders, D., & Yesenosky, J. M. (1994). Psychological reactance and its relationship to normal personality variables. Cognitive Therapy and Research, 18(6), 601–612. https://doi.org/10.1007/BF02355671
- Finkelstein, S. R., Boland, W. A., Vallen, B., Connell, P. M., Sherman, G. D., & Feemster, K. A. (2020). Psychological reactance impacts ratings of pediatrician vaccine-related communication quality, perceived vaccine safety, and vaccination priority among U.S. parents. Human Vaccines & Immunotherapeutics, 16(5), 1024–1029. https://doi.org/10.1080/21645515.2019.1694815
- Gadermann, A. M., Guhn, M., & Zumbo, B. D. (2012). Estimating ordinal reliability for Likert-type and ordinal item response data: A conceptual, empirical, and practical guide. Practical Assessment, Research & Evaluation, 17(3), 1–13.
- Garcia, D. (2012). The affective temperaments: Differences between adolescents in the Big Five model and Cloninger’s psychobiological model of personality. Journal of Happiness Studies, 13(6), 999–1017. https://doi.org/10.1007/s10902-011-9303-5
- Gosling, S. D., Rentfrow, P. J., & Swann, W. B. Jr. (2003). A very brief measure of the Big-Five personality domains. Journal of Research in Personality, 37(6), 504–528. https://doi.org/10.1016/s0092-6566(03)00046-1 https://doi.org/10.1016/S0092-6566(03)00046-1
- Hayton, J. C., Allen, D. G., & Scarpello, V. (2004). Factor retention decisions in exploratory factor analysis: A tutorial on parallel analysis. Organizational Research Methods, 7(2), 191–205. https://doi.org/10.1177/1094428104263675
- Holgado-Tello, F., Chacón–Moscoso, S., Barbero–García, I., & Vila–Abad, E. (2010). Polychoric versus Pearson correlations in exploratory and confirmatory factor analysis of ordinal variables. Quality & Quantity, 44, 153–166. https://doi.org/10.1007/s11135-008-9190-y
- Hong, S.-M. (1992). Hong’s psychological reactance scale: A further factor analytic validation. Psychological Reports, 70(2), 512–514. https://doi.org/10.2466/pr0.1992.70.2.512
- Hong, S.-M., & Ostini, R. (1989). Further evaluation of Merz's psychological reactance scale. Psychological Reports, 64(3), 707–710. https://doi.org/10.2466/pr0.1989.64.3.707
- Hong, S.-M., & Faedda, S. (1996). Refinement of the Hong psychological reactance scale. Educational and Psychological Measurement, 56(1), 173–182. https://doi.org/10.1177/0013164496056001014
- Hong, S.-M., & Page, S. (1989). A psychological reactance scale: Development, factor structure and reliability. Psychological Reports, 64(3_suppl), 1323–1326. https://doi.org/10.2466/pr0.1989.64.3c.1323
- Hornsey, M. J., Harris, E. A., & Fielding, K. S. (2018). The psychological roots of anti-vaccination attitudes: A 24-nation investigation. Health Psychology, 37(4), 307–315. https://doi.org/10.1037/hea0000586
- Hu, L., & Bentler, P. M. (1999). Cutoff criteria for fit indexes in covariance structure analysis: Conventional criteria versus new alternatives. Structural Equation Modeling: A Multidisciplinary Journal, 6(1), 1–55. https://doi.org/10.1080/10705519909540118
- Inman, R. A., Sousa, A. M., Cunha, D., & Moreira, P. (2019). Therapeutic reactance in adolescents: The psychometrics of the therapeutic reactance scale in adolescents. Scandinavian Journal of Child and Adolescent Psychiatry and Psychology, 7, 20–28. https://doi.org/10.21307/sjcapp-2019-003
- John, O. P., & Srivastava, S. (1999). The Big Five trait taxonomy: History, measurement, and theoretical perspectives. In L. Pervin & O. P. John (Eds.), Handbook of personality: Theory and research (2nd ed., pp. 102–138). Guilford.
- Jonason, P. K., Bryan, A., & Herrera, J. (2010). Trimming the fat reveals a one-factor construct of Hong’s psychological reactance scale. Individual Differences Research, 8, 220–228.
- Jonason, P. K., & Knowles, H. (2006). A unidimensional measure of Hong's psychological reactance scale. Psychological Reports, 98(2), 569–579. https://doi.org/10.2466/pr0.98.2.569-579
- Karlsson, L., Tolvanen, M., Scheinin, N. M., Uusitupa, H.-M., Korja, R., Ekholm, E., Tuulari, J. J., Pajulo, M., Huotilainen, M., Paunio, T., Karlsson, H., & FinnBrain Birth Cohort Study Group (2018). Cohort profile: The FinnBrain Birth Cohort Study (FinnBrain). International Journal of Epidemiology, 47(1), 15–16. https://doi.org/10.1093/ije/dyx173
- Ledesma, R. D., & Valero-Mora, P. (2007). Determining the number of factors to retain in EFA: An easy-to-use computer program for carrying our parallel analysis. Practical Assessment, Research & Evaluation, 12(2), 1–11.
- Lorenzo-Seva, U., & Ferrando, P. J. (2006). FACTOR: A computer program to fit the exploratory factor analysis model. Behavior Research Methods, 38(1), 88–91. https://doi.org/10.3758/bf03192753
- Lorenzo-Seva, U., & Ferrando, P. J. (2013). FACTOR 9.2 A comprehensive program for fitting exploratory and semiconfirmatory factor analysis and IRT models. Applied Psychological Measurement, 37(6), 497–498. https://doi.org/10.1177/0146621613487794
- Malatincová, T. (2015). The mystery of ‘‘should’’: Procrastination, delay, and reactance in academic settings. Personality and Individual Differences, 72, 52–58. https://doi.org/10.1016/j.paid.2014.08.015
- Merz, J. (1983). Fragebogen zur Messung der psychologischen Reaktanz. Diagnostica, 29(1), 75–82.
- Miller, C. H., Burgoon, M., Grandpre, J. R., & Alvaro, E. M. (2006). Identifying principal risk factors for the initiation of adolescent smoking behaviors: The significance of psychological reactance. Health Communication, 19(3), 241–252. https://doi.org/10.1207/s15327027hc1903_6
- Miller, C. H., & Quick, B. L. (2010). Sensation seeking and psychological reactance as health risk predictors for an emerging adult population. Health Communication, 25(3), 266–275. https://doi.org/10.1080/10410231003698945
- Miron, A. M., & Brehm, J. W. (2006). Reactance theory – 40 years later. Zeitschrift Für Sozialpsychologie, 37(1), 9–18. https://doi.org/10.1024/0044-3514.37.1.9
- Moreira, P., Cunha, D., & Inman, R. A. (2019). Addressing a need for valid measures of trait reactance in adolescents: A further test of the Hong psychological reactance scale. Journal of Personality Assessment, 102, 1–13. https://doi.org/10.1080/00223891.2019.1585360
- Preacher, K. J., & MacCallum, R. C. (2003). Repairing Tom Swift’s electric factor analysis machine. Understanding Statistics, 2(1), 13–43. https://doi.org/10.1207/S15328031US0201_02
- Quick, B. L., Shen, L., & Dillard, J. P. (2012). Reactance theory and persuasion. In J. P. Dillard & L. Shen (Eds.), The SAGE handbook of persuasion: Developments in theory and practice (2nd ed., pp. 167–183). SAGE Publications, Inc.
- R Core Team. (2018). R: A language and environment for statistical computing. R Foundation for Statistical Computing. https://www.R-project.org/.
- Rains, S. A. (2013). The nature of psychological reactance revisited: A meta‐analytic review. Human Communication Research, 39(1), 47–73. https://doi.org/10.1111/j.1468-2958.2012.01443.x
- Ramanaiah, N. V., Rielage, J. K., & Cheng, Y. (2002). Cloninger's temperament and character inventory and the NEO five-factor inventory. Psychological Reports, 90(3 Pt 2), 1059–1063. https://doi.org/10.1177/003329410209000301.2
- Rosenberg, B. D., & Siegel, J. T. (2018). A 50-year review of psychological reactance theory: Do not read this article. Motivation Science, 4(4), 281–300. https://doi.org/10.1037/mot0000091
- Rosseel, Y. (2012). lavaan: An R package for structural equation modeling. Journal of Statistical Software, 48(2), 1–36. https://doi.org/10.18637/jss.v048.i02
- Seemann, E. A., Buboltz, W. C., Thomas, A., Barlow, S., & Wilkinson, L. (2005). Normal personality variables and their relationship to psychological reactance. Individual Differences Research, 3, 88–98.
- Shen, L., & Dillard, J. P. (2005). Psychometric properties of the Hong psychological reactance scale. Journal of Personality Assessment, 85(1), 74–81. https://doi.org/10.1207/s15327752jpa8501_07
- Shoham, V., Trost, S. E., & Rohrbaugh, M. J. (2004). From state to trait and back again: Reactance theory goes clinical. In R. A. Wright, J. Greenber, & S. S. Brehm (Eds.), Motivational analyses of social behavior: Building on Jack Brehm’s contributions to psychology (pp. 167–185). Erlbaum.
- Silvia, P. J. (2006). A skeptical look at dispositional reactance. Personality and Individual Differences, 40(6), 1291–1297. https://doi.org/10.1016/j.paid.2005.11.013
- Thomas, A., Donnell, A. J., & Buboltz, W. C. (2001). The Hong Psychological Reactance Scale: A Confirmatory Factor Analysis. Measurement and Evaluation in Counseling and Development, 34(1), 2–13.https://doi.org/10.1080/07481756.2001.12069018
- Timmerman, M. E., & Lorenzo-Seva, U. (2011). Dimensionality assessment of ordered polytomous items with parallel analysis. Psychological Methods, 16(2), 209–220. https://doi.org/10.1037/a0023353
- Tucker, R. K., & Byers, P. Y. (1987). Factorial validity of Merz's psychological reactance scale. Psychological Reports, 61(3), 811–815. https://doi.org/10.2466/pr0.1987.61.3.811
- van Eerde, W. (2003). A meta-analytically derived nomological network of procrastination. Personality and Individual Differences, 35(6), 1401–1418. https://doi.org/10.1016/S0191-8869(02)00358-6
- Yost, A. B., Behrend, T. S., Howardson, G., Darrow, J. B., & Jensen, J. M. (2019). Reactance to electronic surveillance: A test of antecedents and outcomes. Journal of Business and Psychology, 34(1), 71–86. https://doi.org/10.1007/s10869-018-9532-2
- Yost, A. B., & Finney, S. J. (2018). Assessing the unidimensionality of trait reactance using a multifaceted model assessment approach. Journal of Personality Assessment, 100(2), 186–196. https://doi.org/10.1080/00223891.2017.1280044