
 ?Mathematical formulae have been encoded as MathML and are displayed in this HTML version using MathJax in order to improve their display. Uncheck the box to turn MathJax off. This feature requires Javascript. Click on a formula to zoom.
ABSTRACT
The performance of the photovoltaic power plant of Sourdun in France is studied for a period of seven years using the IEC 61724 standard. The 4.5 MWp photovoltaic installation is located in a warm temperate climate area and includes polycrystalline photovoltaic panels. The analysis of the collected data from the monitoring system reveals an average degradation rate of the power plant of 0.209%/year. The found degradation rate is in agreement with other values obtained for different power plants using the same method and having close characteristics. The degradation value is determined from the slope of the annual change in the performance ratio corrected regarding the temperature. The yearly performance ratio varying between 84.12% and 90.54% is higher in spring and lower in the summer with an average value of 87.18%. The average yearly evolutions of the reference yield and of the final yield are 3.92 h and 3.33 h respectively.
1. Introduction
The share of renewable energies in meeting global energy demand is expected to be raised by 20% over the next five years to attain a share of 12.4% of the global production by 2023. These green energy production systems will experience the fastest growth in the electricity sector, providing up to 30% of the electricity demand in 2023, compared to 24% in 2017. For this upcoming period, renewable energies should represent more than 70% of the global growth in the electricity generation, driven by solar photovoltaic (PV) energy (‘Renewables 2018 1’, n.d.). Global additions of new PV installations are expected to exceed 110 GW per year by 2023 (‘Power 2’, n.d.). In 2017, cumulative solar photovoltaic capacity reached nearly 398 GW and generated more than 460 TWh corresponding to about 2% of the global production. Over the next five years, solar PV is expected to create a raise in the electricity generation capacity with nearly 580 GW among other renewable sources (‘Solar 3’, n.d.).
Solar energy production in France has significantly increased over the past five years. With a rise of nearly 10%/year, it is as of now the sector considered to be the most profitable in the renewable energy field. Currently, the installed capacity of the French photovoltaic park is 8936 MW. Between July 2018 and June 2019, the production of the French photovoltaic park made it possible to meet 2.4% of the energy consumption of the country. This recent augmentation has been achieved thanks to the establishment of new photovoltaic plants of substantial sizes, including the most powerful solar plant in Europe located in Cestas in Gironde, inaugurated in December 2015 with a capacity of 300 MWp, and of late that of Meaux in the Ile-de-France region with a total capacity of 17 MWp (‘Panorama du parc photovoltaïque français’, 2019).
To investigate the efficiency of a photovoltaic power production system, the International Electrotechnical Commission (IEC) 61724 European Standard displays guidelines for measurements, data exchanges and analyses for the monitoring and the determination of the electrical performances (‘IEC61724-1:2017. Photovoltaic System Performance – Part 1: Monitoring; International Electrotechnical Commission’, 2017). It does not describe the performance of discrete components but rather concentrates on evaluating the performance of an array as a part of a system providing a performance summary suitable for comparing PV installations of various sizes operating under different climates (‘iTeh Standards’, n.d.; Srivastava, Tiwari, and Giri Citation2020). Their performances are assessed on the basis of reference conditions or production outcomes of other installations by using the performance ratio, a key parameter depending on both the characteristics of the PV installation and the time of the year (Khalid et al. Citation2016). The efficiency of a photovoltaic plant is namely related to the weather conditions defined with the irradiation, the ambient temperature, the humidity and the wind speed (Ibrahim and Anani Citation2017). It is as well influenced by other environmental factors such as dirt and dust (Adinoyi and Said Citation2013; Catelani et al. Citationn.d.; Guo et al. Citation2015; Sayyah, Horenstein, and Mazumder Citation2014), shading, ohmic DC losses, ohmic AC losses, inverter losses, the orientation of the modules and also the used technology (Quansah and Adaramola Citation2019). Beyond this, the present standard has inspired the development of techniques allowing to estimate the performance of PV installations or to monitor them. Akinyele et al. proposed a new approach called Fundamental PV Module Performance Analysis (FPVMPA) to value the performance of a single NASENI 190 W module in terms of power output, energy yield, capture losses, fill factor, and efficiency, so as to predict the performance of the pre-installation of a PV module (Akinyele, Rayudu, and Nair Citation2015). Paredes-Parra et al. experimentally developed a monitoring system of PV modules based on the IEC 61724 standard requirements (Paredes-Parra et al. Citation2018). Kunaifi et al. employed the same standard to analyse the evolution of the productions of PV systems in Indonesia and to investigate at the same time the degradation rates using the NREL/RdTools (Kunaifi et al. Citation2019).
Over the last two decades, as ground-based solar power plants or smaller PV facilities have been fast developing, a significant number of studies have been conducted on the evaluation of the performance of grid-connected PV systems installed around the world by implementing the methodology specified in the IEC 61724 standard. The performance ratio varies according to the environment, especially the ambient temperature, as easily noticed in hot areas. Consequently, a temperature-corrected performance ratio is necessary to substitute the influence of the ambient temperature in order to determine the degradation rate of PV installations (Dierauf et al. Citation2013).
Commencing in Asia, Chokmaviroj et al. inquired in 2004 on the first eight months of monitoring of a 500 kWp photovoltaic pilot plant in the North West of Thailand (Chokmaviroj, Wattanapong, and Suchart Citation2006). The PV system generated 383274 kWh with a final yield ranging from 2.91 to 3.98 h/d and a performance ratio from 70% to 90%. Also, the analysis of three 3 kW grid-connected PV systems for houses in Korea was handled by Piao et al. from January 2003 to December 2006 (Piao et al. Citation2009). The quantities of the energy generated were reported to be at 11.943 MWh, 12.9 MWh and 12.8 MWh, the final yields at 2.74 h/d, 2.94 h/d and 2.92 h/d, and the performance ratios at 67%, 72% and 72%. On the other hand, the average capture losses were found to be at 1.11 h/d and 0.74 h/d for the two other systems. Wittkopf et al. studied a 142.5 kWp grid-connected rooftop BIPV system in Singapore which displayed a performance ratio of 81% (Wittkopf et al. Citation2012). In another study, the performance and degradation of a 1 MWp utility-scale photovoltaic (PV) system located in the tropical semi-arid climate of India were investigated based on four years of monitored data (Malvoni et al. Citation2020). The reference yield, final yield, system efficiency, capacity factor, and performance ratio were 4.64 h/day 6.23 h/day, 11%, 19.33%, and 74.73% corespondingly.
Diverse installations at different places and operating under various climates in Africa were subjected to an analysis carried out with the IEC 61724 standard. The performance of a newly installed 281 kWp first grid-connected photovoltaic solar farm in Lesotho was evaluated with the parameters stated in IEC Standard 61724. The results showed a satisfactory performance, with a weighted performance ratio of 70% compared to the global average of 70–80% for sufficiently well-doing PV farms (Mpholo, Nchaba, and Monese Citation2015). In Algeria, the performance ratio was found to range from 66.66% to 85.93% for an installation of 2.5 kWp in the Saharan environment (Necaibia et al. Citation2018). This wide interval was due to the large temperature difference between the seasons. The same kind of behaviour was observed for the 954809 kWp PV plant of Sheikh Zayed in Mauritania with a monthly performance ratio varying from 61% in August to 71% in November, the monthly average value being 66% (El Hacen Jed et al. Citation2020). Moreover, in Djibouti, the performance ratio ranged between 75% and 90% for a 302.4 kWp installation operating under a dusty desert maritime climate (Daher et al. Citation2018). The monthly average daily array yield and final yield were 5.1 kWh/kWp and 4.7 kWh/kWp respectively. The average performance ratio for the PV arrays and the global grid-connected system were 90% and 84% respectively, corresponding to monthly average daily PV module and system efficiencies of 12.68% and 11.75%.
Other examples of usage of the standard can be reported for two other parts of the globe. In Southern America, the performance analysis of a 2.2 kWp photovoltaic system installed at the State University of Ceará, Fortaleza, northeast region of Brazil monitored from June 2013 to May 2014 revealed a suitable performance with an annual energy yield, an average daily reference, an array and final yields of 1685.5 kWh/kWp, 5.6 kWh/kWp, 4.9 kWh/kWp and 4.6 kWh/kWp respectively as well as a performance ratio of 82.9% and a capacity factor of 19.2% (De Lima, de Araújo Ferreira, and de Lima Morais Citation2017). A 600 Wp PV system connected to the 220 V network of the building of the Facultad de Ciencias Exactas in Corrientes, Argentina, between January 2011 and December 2012 displayed during the first 10 months of operating a performance ratio between 65% and 75% in agreement with those reported in other studies namely for systems installed on facades (Caceres et al. Citation2017). However, from November 2011, the values of the performance ratio dropped below 65% owing to some instabilities of the network parameters. In addition, in the Gulf countries, a 12-month-long performance evaluation conducted on a 85.05 kWp and a 21.6 kWp copper indium gallium selenide (CIGS) thin-film grid-connected PV systems on the rooftops of two schools in Kuwait displayed annual average daily final yields of 104 kW h/kWp. and 4.5 kWh/kWp/day, and a performance ratio maintained between 74% and 85% (Al-Otaibi et al. Citation2015, p.). For a 1.4 kWp grid-connected PV system situated in Sohar city (Oman), the capacity and the yield factors were 21% and 1875 kWh/kWp/year correspondingly and the performance factor 84.6% (Kazem et al. Citation2014).
Relevant to Europe, studies have been carried out especially in the Mediterranean countries and also a few others can be mentioned in the northern countries. Pietruszko and Gradzki studied the data acquired for 1 year of monitoring of a roof-mounted 1kWp grid-connected system set to operation in December 2000 in Warsaw, Poland (Pietruszko and Gradzki Citation2003). An annual yield of about 830 kWh and performance ratios between 60% to 80% were found there. In Germany, in the Federal State of Lower Saxony, 172 PV plants of 1–5 kWp installed on roofs had an annual final yield ranging between 430 kWh/kWp/year and 75 kWh/kWp/year with a mean value of 680 kWh/kWp/year and an annual performance ratio in the range 47.5%-81% (mean 66.5%) in 1993 and 1994 (Jahn Citationn.d.). The performance analysis of a 13 kWp roof-mounted, grid-connected photovoltaic system in Northern Ireland over three years gave a monthly average daily DC and AC performance ratios moving from 35% to 74% and 29% to 66%, respectively and annual average monthly AC performance ratios for the three years of 60%, 61% and 62% (Mondol et al. Citation2006). In France and in Belgium, Leloux et al. did a study on more than 9657 PV installations focusing on the energy produced by these installations and on their performances (Leloux, Narvarte, and Trebosc Citation2012; Leloux, Narvarte Fernández, and Trebosc Citation2011). The mean performance ratio was 76% in France and 78% in Belgium, and the mean performance index was 85% in both the countries. Besides, two grid-connected photovoltaic plants of similar size but based on different module technologies on the roofs of two buildings in Basovizza (Trieste) in Italy were studied from 15 October 2011 to 14 October 2012 (Micheli et al. Citation2014). The average performance ratio was 82.7% for the SPR300-WHT modules and 89.1% for the HIP 230 HDE1 modules. Further, the grid-connected photovoltaic park of C. Rokas SA in Sitia, Crete, with a peak power of 171.36 kWp put in service in 2002, was followed over 1 year (Kymakis, Kalykakis, and Papazoglou Citation2009) (Kymakis, Kalykakis, and Papazoglou Citation2009). The latter supplied 229 MWh to the grid in 2007, from 335.48 to 869.68 kWh. The final yield was within 1.96 to 5.07 h/d, and the performance ratio 58 to 73%, giving an annual performance ratio of 67.36%. And also, in Spain, a study of the data recorded from six PV plants in the south of the country operated for more than four years revealed annual performance values between 78.93% and 87.11% for the four plants employing a tracking system and lower ones from 60.46% to 79.38% for the two other plants without any tracking systems (Martín-Martínez et al. Citation2019).
In the present study, the performance evolution of the photovoltaic power plant of Sourdun located in France is realised according to the IEC 61724 standard for a period of seven (7) years of operating to determine the annual degradation rate. Firstly, the studied plant will be presented; secondly, the methodology to study its performance will be shown; in a third section, the climatic data and the production data will be displayed, followed by the evolution of the performance parameters and finally, the degradation rate of the performance will be given.
2. Description of the power plant Sourdun
The ground-mounted power plant of Sourdun is located in France, in the department of Seine-et-Marne (). The site is located at 3°22ʹ38”E longitude, 48°31ʹ51”N latitude and 154 m mean altitude. The climate in Sourdun is temperate with rainfall all the year-round. The Köppen-Geiger climate classification categorised the climate of Sourdun as Cfb (oceanic climate), the average temperature being 10.2°C and the average annual rainfall 647 mm (‘Köppen climate classification’, 2020).
Figure 1. Solar photovoltaic power plant of Sourdun
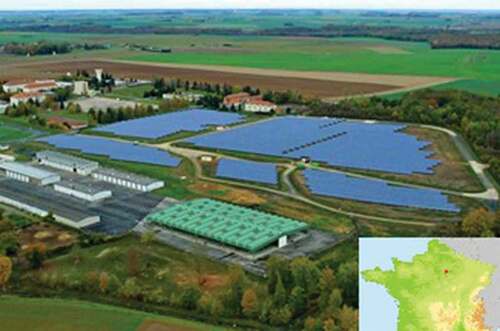
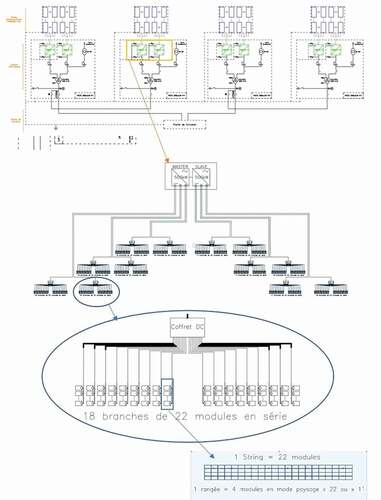
The photovoltaic power plant of Sourdun was designed within the SOVASUN project and was built by the Générale du Solaire Company (formerly SUNNCO GC) and financed by the SOVAFIM company. The 13 million € investment amount was commissioned on November 30 in 2011. The plant has a total capacity of 4.49856 MWp and is spread over 12 acres of land (‘Centrale Solaire de Sourdun’, n.d.). The arrangement of the modules in the photovoltaic power plant of Sourdun () is as follows: twenty (22) modules in series to increase the voltage from a branch, eighteen (18) branches are paralleled in one DC box put in parallel between them to raise the current. Each two (2) DC enclosures are connected to one of the twelve (12) inputs of the 1000 kW inverter from which six major boxes per inverter are found and each inverter chamber contains two inverters (a master inverter and a slave inverter each having a nominal power of 500 kW). Downstream the output of the inverter, a part of the converted energy is consumed by the auxiliaries and the rest passes through a 1000 kVA HTA/BTA step-up transformer which lifts the voltage evacuated to the delivery station and then to the network from 288 V to 20 kV. The plant is divided into four similar zones each containing 4686 photovoltaic panels, three zones involve HANWHA SOLAR 240 W polycrystalline panels and the fourth implies TENESOL 240 W polycrystalline panels. Each zone contains one (1) SIEMENS 1000 kW inverter and one transformer of 1000 kVA with a peak power of 1124.89 kWp per zone as depicted in . The modules are tilted at 25°. A table (4 × 11 or 4 × 22) is composed of four modules in the landscape format, each table is at about 4 m above the ground. The distance between the two tables is 5.2 m. The terrain has a favourable north/south slope of 1.5° on average.
Table 1. Details of the types of equipment by zone
Figure 2. Single-line diagram of the solar photovoltaic power plant of Sourdun
3. Method
The study of the evolution of the performance of the solar power plant of Sourdun was carried out according to the IEC 61724 standard (‘How to calculate PV performance ratio and performance index | Hukseflux’, n.d.) for a period of seven (7) years from March 2012 to December 2018. The meteorological data and the production data of the plant were obtained through direct access to the supervision server of the photovoltaic power plant of Sourdun, which enabled us to find the necessary data since the commissioning of the plant in 2012. The processed data were the alternative energy produced, the insolation, the solar irradiance, the instantaneous generated power, the ambient temperature, the temperature of the modules and the wind speed.
To analyse the performance of a PV solar system, the performance parameters have been specified by the International Energy Agency (IEA) and are described in the IEC 61724 standard. These parameters are the baseline efficiency, the final PV system efficiency and the performance ratio. The latter are employed to define the performance of the energy production system relative to the sunshine and to the overall effect of PV losses.
The reference yield, Yr, is the ratio between the total amount of solar radiation Ht (kWh/m2) incident on the surface of the PV solar panels and the reference radiation quantity G0 (1 kW/m2). This parameter represents the number of hours during which the illumination is equal to the reference.
The final yield, Yf, is the total energy produced by the system, Eac (kWh), compared to the installed nominal power P0 (kWp). This quantity represents the number of hours during which the PV field should operate at its rated power (under standard conditions).
The availability or disponibility, D, is the indicator representing the operating time of the PV plant during which there is no incident affecting all the power peaks.
with:
DI: the duration of the incident(s) cumulated over the whole reference period. This duration is measured by a start/end signal triggered either automatically for the event of a fault on one of the equipments, or manually by a technician working on the control panel;
TP: the rate of the affected peak power according to the level of the incident;
DPR: the duration of the reference period counted in hours. The reference period corresponds to the number of absolute hours since the beginning of the year, in other words, the number of days from 1 January to 31 December × 24 hours.
The performance ratio, PR, is the most important parameter as it indicates the overall effect of the losses on the energy production of the rows of a PV system. The PR values indicate how well a PV system approaches the ideal performance under real-world operating conditions. PR is defined by the ratio between the final yield Yf and the reference yield Yr.
The corrected performance ratio, PRc, is used to correct the performance ratio regarding the temperature. It is used to study the degradation of performance over time (Dierauf et al. Citation2013) and has been included in the last version of the IEC 61724 standard (‘How to calculate PV performance ratio and performance index | Hukseflux’, n.d.; ‘IEC61724-1:2017. Photovoltaic System Performance – Part 1: Monitoring; International Electrotechnical Commission’, 2017).
where α is the temperature coefficient, Tm is the module temperature, and Tn = 25°C is the nominal module temperature. The temperature corrected performance ratio helps to see a performance change unaffected by seasonal or annual temperature variations.
The performance ratio corrected regarding the availability, PRD, takes into account all the breakdowns and shutdowns of the PV installation.
The performance ratio corrected regarding the temperature and the availability, PRCD, is the ratio between the performance ratio PRC and the availability D.
The degradation rate, Dg, is determined directly from the slope of the annual change in the performance ratio PRCD corrected regarding the temperature and the availability. It describes the decrease in performance.
where x1, x2, y1, and y2 are the coordinates of two points on the regression line.
4. Results and discussion
4.1. Climatic data
The variations of the climatic parameters of the photovoltaic field such as the solar radiation, the ambient temperature, the module temperature and the wind speed were recorded over the study period of 7 years from January 2012 up to December 2018. As the photovoltaic power station produces electricity only during the day (between sunrise and sunset), the values recorded during the night were not taken into consideration.
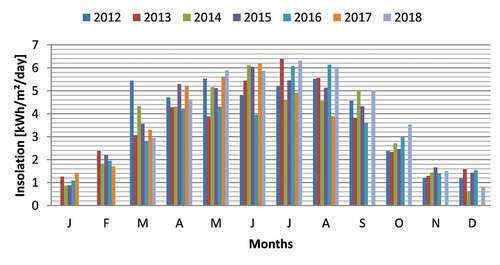
The monthly changes in the mean daily insolation over the study period are shown in . The insolation duration varies seasonally, with low values in the winter, medium ones in spring and autumn, and higher ones in the summer. For the months of October, November, December, January and February, it changes between 1.11 kWh/m2/day and 2.73 kWh/m2/day, for September, March and April between 3.64 kWh/m2/day and 4.66 kWh/m2/day and finally for May, June, July and August between 5.07 kWh/m2/day and 5.57 kWh/m2/day, with maximum and minimum values of 6.39 kWh/m2/day and 0.63 kWh/m2/day recorded in July 2013 and December 2014 respectively.
Figure 3. Average monthly changes in the daily insolation in Sourdun for the study period
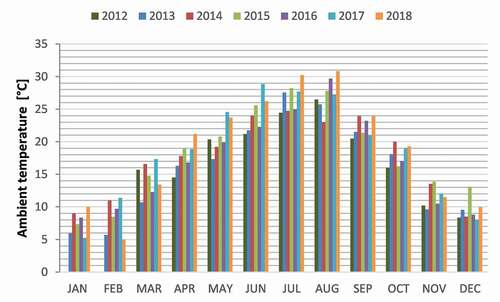
The variation of the ambient temperature is presented in . It is proportional to the variations of the solar irradiance from where there are higher temperatures in the summer (between 24.27°C and 27.25°C), average ones in spring and autumn (between 14.4°C and 22.21°C) and low ones in the winter (between 7.65°C and 11.59°C). The extreme values of the ambient temperature were recorded in August 2018 with 30.84°C and in January 2017 with 5.24°C.
Figure 4. Monthly evolution of the daily ambient temperature in Sourdun for the study period
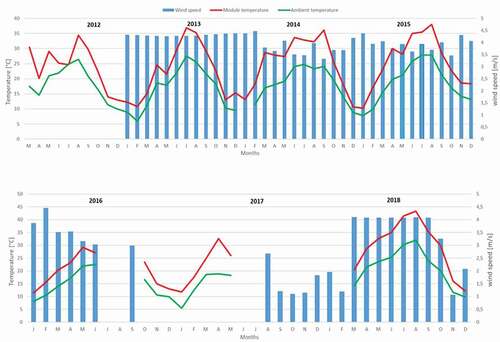
Wind speed plays an important role in the cooling of the photovoltaic modules and affects the performance of a PV power plant. depicts the average monthly variation of the wind speed and also the average daily module temperature for the period between March 2013 and December 2018. Communication problems between the measuring instruments and the data recording unit, unfortunately, caused a loss of the data for some parameters as can be observed for the years 2012 and 2017. The wind speed at the field did not undergo great variations throughout the year 2013, ranging from 4.26 m/s in spring to 4.37 m/s in the winter. More changes in the wind speed can be noticed for the other years. It can be noted that the wind speed was slightly elevated in the winter period with a maximum of 4.47 m/s in February 2014 and a minimum of 1.06 m/s in November 2018. It can also be concluded that the wind speed is inversely proportional to the temperature of the modules and that there are similarities between the evolution of the module temperature and the ambient temperature, the module temperature being always higher than the ambient temperature.
Figure 5. Average monthly change in module temperature, ambient temperature and daily wind speed
4.2. Production data
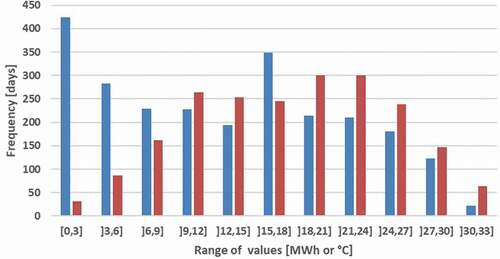
The production varies from one year to another depending on the sunshine, the ambient temperature, the other environmental parameters, and sometimes even the stops of the central for maintenance or breakdowns. The monthly variation of the production with the ambient temperature is shown in , the cumulative annual production in , and the frequency of both the daily production and of the ambient temperature is superimposed in .
Figure 6. Monthly evolution of the production and the ambient temperature
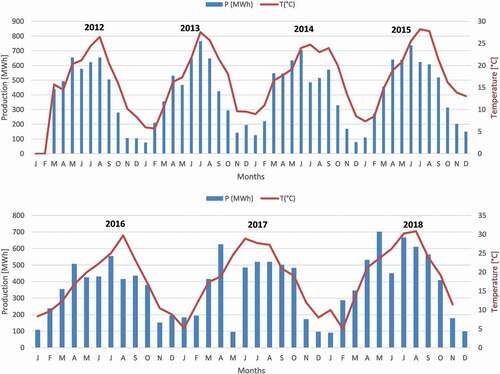
Figure 7. Evolution of the cumulated annual and total production
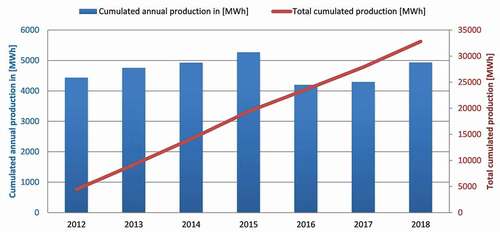
Figure 8. Frequency of the daily production and the outdoor temperatures
As can be observed in , the extreme values of the annual production were recorded in 2015 and 2016 with values of 5266.8 MWh and 4197.7 MWh respectively. The production was generally high in the summer and low in the winter, with extreme monthly values in July 2013 and in January 2013 of 766 MWh and 75.7 MWh correspondingly.
The evolution of the cumulated production given by helps to quantify the production of the installation with respect to the peak power of 4.5 MWp. Significant variations in this evolution can be seen from one year to another due to the influence of climatic parameters such as insolation, temperature and wind speed. Besides, the production depends on the maintenance shutdowns and on the breakdowns of the PV power plant. The photovoltaic power plant of Sourdun has an average annual production of 4687.2 MWh. Late 2016 to early 2017, downtimes due to a faulty inverter caused a drop in the production over these two years compared with the other ones. As well, in 2012, the photovoltaic power plant was first put into operation in March, justifying the lower production for that year.
provides a clearer view of the production and of the outdoor temperature intervals as a function of the number of days. For 425 days, the production was between 0 and 3 MWh and then began to stabilise with an average of 237 days for the productions between 3 and 27 MWh. The frequency of the daily outdoor temperature is inversely proportional to the frequency of the daily production.
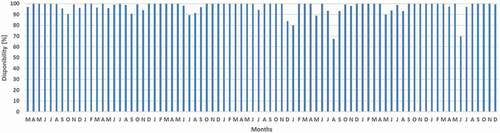
shows the average monthly availability of the Sourdun PV plant for the whole study period. It is measured as a percentage of the number of hours of downtimes during the day. The average value is 97%, with a minimum of 67%. The availability takes into account, either partially or totally, the downtimes of the production, mainly due to inverter failures or maintenance operations. Here are some examples of the causes of the shutdowns explaining the lowering of the availability appearing for some months in the graph of . In October 2012, the inverters did not restart after a power failure. The EDF company had to cut off the line and SIEMENS made only inverters 2 and 4 (circuit breakers) work again due to an insulation fault on the inverter output, obliging SIEMENS to get back on track just one inverter out of two. In December 2015, a short-circuit problem occurred on the DC input of inverter 3 and during the maintenance action handled by SIEMENS, a problem on the emergency stop arose, requiring a HV cut-off. In August 2016, a stop of the inverters 1 and 4 occured with a cut in the optical fibre and an outage by ERDF. In May 2017, an interruption had to be executed by EDF as the master inverter PTR2 failed to start and the SEPAM relay underwent a blockage. The contactor thereafter got replaced by SIEMENS and BYES fixed the SEPAM relay. Other technical troubles had to be overcome like a faulty power supply for the inverter PTR4 and a disabled information transfer from the pyranometer. The availability takes into consideration only the stops of the production. Deficiencies in communication and data recording can sometimes lead to a lack of data. As an example, for the period from September 2017 to February 2018, the absence of data was not accounted for in the availability although the production was unaffected.
Figure 9. Disponibility of the Sourdun PV power plant
successively display the monthly and the annual variations of the reference yield (Yr) and of the final yield or system yield (Yf). The lowest value of the reference yield was recorded in December 2014 with 0.63 h and the maximum value in July 2013 with 6.39 h, the monthly average over the study period being 3.62 h. The system yield had a monthly average of 2.94 h with extreme values of 0.54 h and 5.49 h in January 2013 and July 2013 respectively. Between September 2017 and February 2018, a lack of data for the insolation of the plant made it impossible to calculate the yields for this period.
Figure 10. Monthly evolution of the daily reference yield and final yield
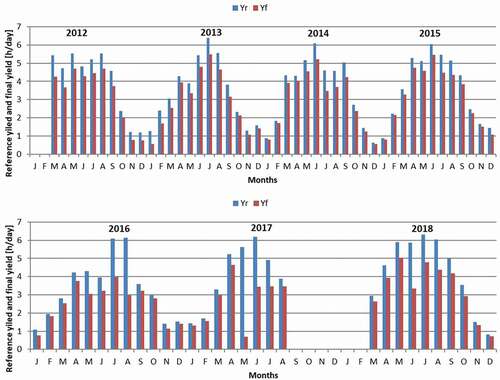
Figure 11. Annual evolution of the Reference yield (Yr) and the Final yield (Yf)
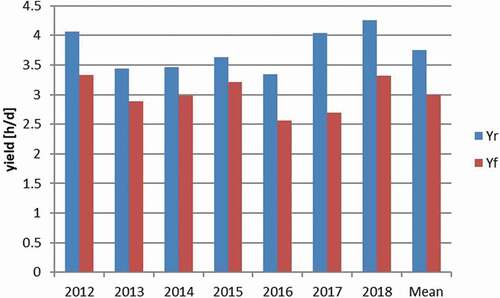
The evolution of both the reference yield and final yield () allowed us to see the difference between these two parameters. This discrepancy represents the losses of the energy conversion from the incidence of solar radiation onto the module up to the output of the inverters. The average values of Yr and Yf is 3.74 h and 2.99 h correspondingly.
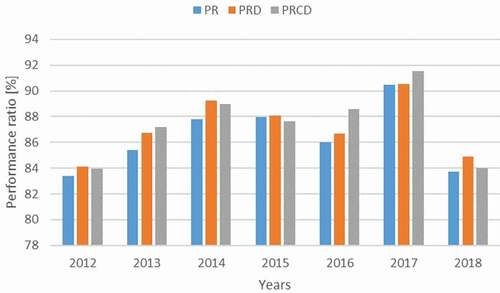
The annual evolution of the performance ratio of the photovoltaic power plant is presented in . In our study, the evolution of the annual performance report is slightly impacted by the temperature owing to the climate in France as rather cold for most of the year. It varies between 84.12% and 90.54%, with an average of 87.18%. As described above, the performance of the PV plant is affected by the downtimes for maintenance or breakdowns. Accounting for these outages, the corrected performance ratio to availability, PRD, was determined, and an increase in the performance ratio of 0.92% was found.
Figure 12. Annual evolution of the performance ratio
In order to compare and validate the performance of the Sourdun PV plant, a confrontation with several other PV plants in Europe is presented in . We have searched in the literature for studies that followed the same IEC 61724 standard, for PV plants precisely located in Europe having the same scale for the power peak. The results of the three installations (Sardinia, Spain II and Spain III) have been carefully examined as all of them also use the same polycrystalline silicon technology. The latter three present average annual performance ratios from 80.96 to 85.09%, which are in the same magnitude as the one achevied for the Sourdun PV plant without considering the availability. Nevertheless, the disponibility is usually not accounted for in this kind of performance study. Furthermore, the relatively lower insolation and ambient temperature of Sourdun (France), minimise the losses due to the temperature effect and limit the emergence of degradations such as hot spots.
Table 2. Comparison of the performance of various PV plants in Europe studied using the IEC 61724 standard
4.3. Degradation study
To determine the degradation of the production over the years of operating, the yearly evolution of the performance ratio was calculated from the average of the daily evolution. To estimate the degradation rate of the PV installation, the annual evolution of the performance ratio corrected regarding the temperature and the availability, PRCD, provided by Equationequation (7)(7)
(7) , was employed. The slope of the evolution of the performance ratio versus time describes the decrease of the latter, in other words, its degradation over time.
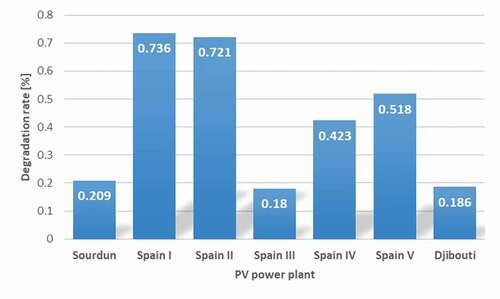
For the Sourdun photovoltaic plant, the degradation rate found is 0.209%/year. This value is calculated by solely considering the annual performance ratios between the years 2013 and 2016 on account of a partial lack of data (for 2 or 3 months per year) for the other years of the period. These shortcomings could affect the accuracy of the degradation rate. For this reason, it was decided to stick to the four years with complete data.
By comparing this rate to others acquired with studies for which the same IEC 61724 standard was used for the calculation of the performance ratio, the degradation rate is found to be reasonable (see ). The degradation rates for Spain, resulting from the performance slopes of five installations that had been operational for a period greater than or equal to 3 years, ranged from 0.18%/year to 0.736%/year (Martín-Martínez et al. Citation2019). This difference in the degradation rate of the installations obtained with almost the same climatic conditions is most likely due to the effect of dust or the malfunctioning of some modules in the strings. Furthermore, in Djibouti (Daher et al. Citation2018), a similar study revealed a degradation rate of 0.186%/year despite a tropical desert maritime climate there.
Figure 13. Degradation rate of the PV plant of Sourdun regarding other PV installations studied with the IEC 61724 standard
5. Conclusion
The objective of this study was on one hand to observe the evolution of the performance of the photovoltaic (PV) power plant of Sourdun (France) for a lengthy period of operation and, on the other, to estimate the degradation of the performance over the years. For this purpose, the IEC 61724 standard was utilised and allowed us to set a fixed method to carry out the performance study, determine the annual degradation rate, and compare it with other reported results. The power plant has a peak power of 4.5 MWp and uses polycrystalline PV modules.
The main results of this study of the performance evolution of the Sourdun PV power plant for seven years according to the IEC 61724 standard are as follows:
The reference yield and the system yield have an annual average of 3.92 h and 3.33 h respectively;
The annual performance ratio average varying from 84.12% and 90.54% with an average of 87.18% for the study period is generally low in the summer and high in the winter depending on the ambient temperature;
The average annual degradation rate between 2013 and 2016 of 0.209% is comparable with installations in neighbouring countries, namely with Spain where the average degradation rate of the studied installations is around 0.51%/year.
Acknowledgments
The authors wish to express their gratitude to the Générale du Solaire Company, to the French Consulate in Nouakchott (Mauritania) for funding the doctoral fellowship of M.E.H. Jed and also, to Mrs. Wilhelmina Logerais, a native English speaker, for proofreading this article.
Disclosure statement
No potential conflict of interest was reported by the author(s).
References
- Adinoyi, M. J., and S. A. M. Said. 2013. “Effect of Dust Accumulation on the Power Outputs of Solar Photovoltaic Modules.” Renewable Energy 60: 633–636. doi:https://doi.org/10.1016/j.renene.2013.06.014.
- Akinyele, D. O., R. K. Rayudu, and N. K. C. Nair. 2015. “Global Progress in Photovoltaic Technologies and the Scenario of Development of Solar Panel Plant and Module Performance Estimation − Application in Nigeria.” Renewable and Sustainable Energy Reviews 48: 112–139. doi:https://doi.org/10.1016/j.rser.2015.03.021.
- Al-Otaibi, A., A. Al-Qattan, F. Fairouz, and A. Al-Mulla. 2015. “Performance Evaluation of Photovoltaic Systems on Kuwaiti Schools’ Rooftop.” Energy Conversion and Management 95: 110–119. doi:https://doi.org/10.1016/j.enconman.2015.02.039.
- Caceres, M., A. Busso, L. Vera, and A. Firman. 2017. “PRIMER SISTEMA FOTOVOLTAICO CONECTADO A LA RED DE BAJA TENSIÓN DEL NORTE ARGENTINO: CARACTERIZACIÓN Y ANALISIS.” DYNAES 6 (1): [13 p.]-[13 p.]. doi:https://doi.org/10.6036/ES8151.
- Catelani, M., L. Ciani, L. Cristaldi, M. Faifer, M. Lazzaroni, and M. Rossi. n.d. Characterization of Photovoltaic Panels: The Effects of Dust, 6. 2nd IEEE ENERGYCON Conference & Exhibition, 2012 at Florence, Italy / Advances in Energy Conversion Symp.
- Centrale Solaire de Sourdun [WWW Document]. n.d. URL. ( accessed 8 2 21). https://www.construction21.org/france/infrastructure/h/centrale-solaire-de-sourdun.html
- Chokmaviroj, S., R. Wattanapong, and Y. Suchart. 2006. “Performance of a 500kWP Grid Connected Photovoltaic System at Mae Hong Son Province, Thailand.” Renewable Energy 31 (1): 19–28. doi:https://doi.org/10.1016/j.renene.2005.03.004.
- Daher, D. H., L. Gaillard, M. Amara, B. Lips, and C. Ménézo 2014. Suivi expérimental des performances d’une centrale solaire photovoltaïque à Djibouti. In: 3ième Colloque International Francophone d’Energétique et Mécanique Les Énergies Renouvelables et La Mécanique Appliquée à l’industrie, p. ART-17. Moroni, The Comoros Islands.
- Daher, D. H., L. Gaillard, M. Amara, and C. Ménézo. 2018. “Impact of Tropical Desert Maritime Climate on the Performance of a PV Grid-connected Power Plant.” Renewable Energy 125: 729–737. doi:https://doi.org/10.1016/j.renene.2018.03.013.
- De Lima, L. C., L. de Araújo Ferreira, and F. H. B. de Lima Morais. 2017. “Performance Analysis of a Grid Connected Photovoltaic System in Northeastern Brazil.” Energy for Sustainable Development 37: 79–85. doi:https://doi.org/10.1016/j.esd.2017.01.004.
- Dierauf, T., A. Growitz, S. Kurtz, J. L. B. Cruz, E. Riley, and C. Hansen. 2013. “Weather-Corrected Performance Ratio.” Technical report published by the NREL (NREL/TP–5200–57991): 1078057. doi:https://doi.org/10.2172/1078057.
- El Hacen Jed, M., R. Ihaddadene, N. Ihaddadene, S. Elhadji, C. Elb, and M. EL Bah. 2020. “Performance Analysis of 954,809 kWp PV Array of Sheikh Zayed Solar Power Plant (Nouakchott, Mauritania).” Renewable Energy Focus 32: 45–54. doi:https://doi.org/10.1016/j.ref.2019.11.002.
- Ghiani, E., F. Pilo, and S. Cossu. 2013. “Evaluation of Photovoltaic Installations Performances in Sardinia.” Energy Conversion and Management 76: 1134–1142. doi:https://doi.org/10.1016/j.enconman.2013.09.012.
- Guo, B., W. Javed, B. W. Figgis, and T. Mirza 2015. Effect of Dust and Weather Conditions on Photovoltaic Performance in Doha, Qatar. In: 2015 First Workshop on Smart Grid and Renewable Energy (SGRE). Presented at the 2015 First Workshop on Smart Grid and Renewable Energy (SGRE), Doha, Qatar: IEEE, pp. 1–6. https://doi.org/https://doi.org/10.1109/SGRE.2015.7208718.
- How to calculate PV performance ratio and performance index | Hukseflux [WWW Document]. n.d. URL. ( accessed 30 7 21). https://www.hukseflux.com/applications/solar-energy-pv-system-performance-monitoring/how-to-calculate-pv-performance-ratio
- Ibrahim, H., and N. Anani. 2017. “Variations of PV Module Parameters with Irradiance and Temperature.” Energy Procedia 134: 276–285. doi:https://doi.org/10.1016/j.egypro.2017.09.617.
- IEC61724-1:2017. Photovoltaic System Performance—Part 1: Monitoring. International Electrotechnical Commission, 2017. iTeh Standards [WWW Document], n.d. URL. ( accessed 20 10 20). https://standards.iteh.ai/catalog/standards/sist/f8b04729-0bcc-498e-9541-57bc6463944f/sist-en-61724-2001.
- Jahn, U. n.d. Performance of 170 Grid Connected Pv Plants in Northern Germany–analysis of Yields and Optimization Potentials, 7. Great Britain: Solar Energy Elsevier Science Ltd.
- Kazem, H. A., T. Khatib, K. Sopian, and W. Elmenreich. 2014. “Performance and Feasibility Assessment of a 1.4kW Roof Top Grid-connected Photovoltaic Power System under Desertic Weather Conditions.” Energy and Buildings 82: 123–129. doi:https://doi.org/10.1016/j.enbuild.2014.06.048.
- Khalid, A. M., I. Mitra, W. Warmuth, and V. Schacht. 2016. “Performance Ratio – Crucial Parameter for Grid Connected PV Plants.” Renewable and Sustainable Energy Reviews 65: 1139–1158. doi:https://doi.org/10.1016/j.rser.2016.07.066.
- Köppen climate classification. 2020. Wikipedia.
- Kunaifi, K., A. Reinders, D. Kaharudin, A. Harmanto, and K. Mudiarto. 2019. “A Comparative Performance Analysis of A 1 MW CIS PV System and A 5 kW Crystalline-Si PV System under the Tropical Climate of Indonesia.” IJTech 10 (6): 1082. doi:https://doi.org/10.14716/ijtech.v10i6.3612.
- Kymakis, E., S. Kalykakis, and T. M. Papazoglou. 2009. “Performance Analysis of a Grid Connected Photovoltaic Park on the Island of Crete.” Energy Conversion and Management 50 (3): 433–438. doi:https://doi.org/10.1016/j.enconman.2008.12.009.
- Leloux, J., L. Narvarte Fernández, and D. Trebosc. 2011. Performance Analysis of 10,000 Residential PV Systems in France and Belgium. 26th European Photovoltaic Solar Energy Conference and Exhibition at Hamburg.
- Leloux, J., L. Narvarte, and D. Trebosc. 2012. “Review of the Performance of Residential PV Systems in Belgium.” Renewable and Sustainable Energy Reviews 16 (1): 178–184. doi:https://doi.org/10.1016/j.rser.2011.07.145.
- Malvoni, M., N. M. Kumar, S. S. Chopra, and N. Hatziargyriou. 2020. “Performance and Degradation Assessment of Large-scale Grid-connected Solar Photovoltaic Power Plant in Tropical Semi-arid Environment of India.” Solar Energy 203: 101–113. doi:https://doi.org/10.1016/j.solener.2020.04.011.
- Martín-Martínez, S., M. Cañas-Carretón, A. Honrubia-Escribano, and E. Gómez-Lázaro. 2019. “Performance Evaluation of Large Solar Photovoltaic Power Plants in Spain.” Energy Conversion and Management 183: 515–528. doi:https://doi.org/10.1016/j.enconman.2018.12.116.
- Micheli, D., S. Alessandrini, R. Radu, and I. Casula. 2014. “Analysis of the Outdoor Performance and Efficiency of Two Grid Connected Photovoltaic Systems in Northern Italy.” Energy Conversion and Management 80: 436–445. doi:https://doi.org/10.1016/j.enconman.2014.01.053.
- Mondol, J. D., Y. Yohanis, M. Smyth, and B. Norton. 2006. “Long Term Performance Analysis of a Grid Connected Photovoltaic System in Northern Ireland.” Energy Conversion and Management 47 (18–19): 2925–2947. doi:https://doi.org/10.1016/j.enconman.2006.03.026.
- Mpholo, M., T. Nchaba, and M. Monese. 2015. “Yield and Performance Analysis of the First Grid-connected Solar Farm at Moshoeshoe I International Airport, Lesotho.” Renewable Energy 81: 845–852. doi:https://doi.org/10.1016/j.renene.2015.04.001.
- Necaibia, A., A. Bouraiou, A. Ziane, N. Sahouane, S. Hassani, M. Mostefaoui, R. Dabou, and S. Mouhadjer. 2018. “Analytical Assessment of the Outdoor Performance and Efficiency of Grid-tied Photovoltaic System under Hot Dry Climate in the South of Algeria.” Energy Conversion and Management 171: 778–786. doi:https://doi.org/10.1016/j.enconman.2018.06.020.
- Palmero-Marrero, A., J. C. Matos, and A. C. Oliveira. 2015. “Comparison of Software Prediction and Measured Performance of a Grid-connected Photovoltaic Power Plant.” Journal of Renewable and Sustainable Energy 7 (6): 063102. doi:https://doi.org/10.1063/1.4935376.
- Panorama du parc photovoltaïque français : Où en est la filière solaire ?. 2019. Lendopolis - Blog officiel de Lendopolis. URL. ( accessed 20 10 20). https://blog.lendopolis.com/energies-renouvelables/panorama-parc-photovoltaique/.
- Paredes-Parra, J., A. Mateo-Aroca, G. Silvente-Niñirola, M. Bueso, and Á. Molina-García. 2018. “PV Module Monitoring System Based on Low-Cost Solutions: Wireless Raspberry Application and Assessment.” Energies 11 (11): 3051. doi:https://doi.org/10.3390/en11113051.
- Piao, Z.-G., B.-I. Jung, Y.-O. Choi, and G.-B. Cho 2009. Performance Assessment of 3kW Grid-connected PV Systems in Korea. In: INTELEC 2009-31st International Telecommunications Energy Conference. Presented at the INTELEC 2009–2009 International Telecommunications Energy Conference, Incheon, South Korea: IEEE, pp. 1–5. https://doi.org/https://doi.org/10.1109/INTLEC.2009.5351953
- Pietruszko, S. M., and M. Gradzki. 2003. “Performance of a Grid Connected Small PV System in Poland.” Applied Energy 74 (1–2): 177–184. doi:https://doi.org/10.1016/S0306-2619(02)00144-7.
- Power 2 [WWW Document]. n.d. URL. ( accessed 20 6 19). https://www.iea.org/renewables2018/power/.
- Quansah, D. A., and M. S. Adaramola. 2019. “Assessment of Early Degradation and Performance Loss in Five Co-located Solar Photovoltaic Module Technologies Installed in Ghana Using Performance Ratio Time-series Regression.” Renewable Energy 131: 900–910. doi:https://doi.org/10.1016/j.renene.2018.07.117.
- Renewables 2018 1 [WWW Document]. n.d. URL. ( accessed 20 6 19). https://www.iea.org/renewables2018/.
- Sayyah, A., M. N. Horenstein, and M. K. Mazumder. 2014. “Energy Yield Loss Caused by Dust Deposition on Photovoltaic Panels.” Solar Energy 107: 576–604. doi:https://doi.org/10.1016/j.solener.2014.05.030.
- Solar 3 [WWW Document]. n.d. URL. ( accessed 20 6 19). https://www.iea.org/topics/renewables/solar/.
- Srivastava, R., A. N. Tiwari, and V. K. Giri. 2020. “An Overview on Performance of PV Plants Commissioned at Different Places in the World.” Energy for Sustainable Development 54: 51–59. doi:https://doi.org/10.1016/j.esd.2019.10.004.
- Wittkopf, S., S. Valliappan, L. Liu, K. S. Ang, and S. C. J. Cheng. 2012. “Analytical Performance Monitoring of a 142.5kWp Grid-connected Rooftop BIPV System in Singapore.” Renewable Energy 47: 9–20. doi:https://doi.org/10.1016/j.renene.2012.03.034.