
ABSTRACT
Additive Manufacturing helps to develop production alternatives with new technologies and less environmental impacts. The comparative analysis was performed between two manufacturing processes using black recycled Acrylonitrile Butadiene Styrene (ABS) pellets to evaluate the potential environmental impacts between Injection moulding and Fused Deposition Modelling (FDM). The Life Cycle Assessment (LCA) and the Unit Process Life Cycle Inventory (UPLCI) methodology were adopted, which resulted in an impact assessment separated by operation modes and subunits of the equipment. The LCA results indicate a lower environmental impact of the FDM when the aim is to produce a batch size smaller than 14 parts. For batch sizes above 50 parts, the Injection moulding process generated less impact to the Global Warming Potential (GWP) and Cumulative Energy Demand (CED). The printing stage contributed the most to generating impacts for the FDM. In the Injection moulding process, the main responsible for generating impacts were the injection phase. Mechanical tensile tests were carried out with the parts obtained by the FDM with different infills (25%, 50%, 75% and 100%), and it was observed that parts with 100% infill obtained the best relation between mechanical properties and environmental impacts.
1. Introduction
The industrial sector consumes about 54% of the total energy delivered globally (Chen et al. Citation2021). This sector has increased greenhouse gases, contributing to global warming. According to the Intergovernmental Panel on Climate Change (IPCC) global warming is responsible for the decline of biodiversity IPCC (Citation2021), natural hazards Schiermeier (Citation2011) and global food security (Wheeler and Von Braun Citation2013).
According to the IPCC report, in 2019 atmospheric concentrations of Carbon Dioxide (CO2) were the highest in the last 2 million years (reaching annual averages of 410 ppm), Methane (CH4) and Nitrous Oxide (N2O) were the highest in the last 800,000 years with 1866 ppb CH4 and 332 ppb N2O respectively IPCC (Citation2021). In the same report, it is mentioned the importance of decision makers creating and implementing zero emission plans to achieve deep reductions IPCC (Citation2021). In this sense, it is important to implement alternatives with new technologies towards sustainable manufacturing (Prado et al. Citation2021).
Additive Manufacturing (AM) or 3D-printing is considered as an emerging technology with potential to decrease environmental impacts generated by the manufacturing industry (Böckin and Tillman Citation2019). (Laverne et al., Citation2019) adds that AM can support sustainability issues, for (Caviggioli and Ughetto Citation2019), AM is a new and disruptive technology that has led many industries to reconsider their productive systems, and for Attaran (Citation2017), AM has five specific benefits over traditional manufacturing related to: quality, cost, speed, innovation/transformation and impact.
Statistics report over 150 companies are using AM with different raw materials that includes: plastic, ceramic, composite materials (Mani, Lyons, and Gupta Citation2014), thermoset Polymers, thermoplastic polymers, wood and metals (Thompson et al. Citation2016) to produce complex products such as, aerospace products, automatic parts, machine tools, production sector (Peng et al. Citation2018); (Dwivedi, Srivastava, and Srivastava Citation2017) and (Böckin and Tillman Citation2019), healthcare, dentistry and dental technology and food, architectural and construction and retail/apparel Attaran (Citation2017), jewellery, small toys, accessories and souvenirs Choi (Citation2018).
In the COVID-19 scenario many companies in the healthcare industry are using AM to produce 3D face masks, face shields, 3D printed hand sanitiser holder, hand gloves and part of medical ventilators (Equbal et al. Citation2021). The same authors added that AM will help the industries to manage uninterrupted supply chain systems and explore more possibilities the application of AM in a scenario post COVID-19. Other Advantages with AM over Conventional Manufacturing (CM) are summarised in and adapted on the areas of application cited by Attaran (Citation2017).
Table 1. Advantage with AM over CM
From another point of view, for (Dwivedi, Srivastava, and Srivastava Citation2017) the main disadvantages to AM implementation are in ten main categories: 1. Production technology limitations. 2. High costs of AM implementation. 3. Unavailability of skilled operators. 4. Difficulty in introducing change in traditional designers. 5. Worker´s resistance to AM technologies. 6. Inadequate management support. 7. Information Asymmetry. 8. Lack of trust in technology vendors. 9. Intellectual Properties Rights (IPR) threats in digital inventory and 10. Lack of government support. Other limitations are related with slow process speed, poor dimensional accuracy when compared to conventional processes, problems with process predictability and repeatability and cost effectiveness (Baumers et al. Citation2016). The summarised the disadvantages to AM implementation adapted for the categories cited by (Dwivedi, Srivastava, and Srivastava Citation2017).
Table 2. Disadvantages to AM implementation
In AM, there are still few studies that assess and quantify environmental impacts in the production phase and analyse their environmental-economic feasibility (Ford and Despeisse Citation2016); (Alister and Wood Citation2014); (Nagarajan and Haapala Citation2018); (Niaki, Torabi, and Nonino Citation2019). Thus, more tools and techniques are needed to evaluate the environmental impacts and feasibility of AM processes, their comparison with CM processes and technologies and to determine the main environmental hotspots in both cases. (Laverne et al., Citation2019) cited the necessity to develop more studies within loco data collection to create new tools, indicators and practices for a more sustainable AM.
(Niaki, Torabi, and Nonino Citation2019) compare two AM technologies, the Fused Deposition Modelling (FDM) and Inkjet machine with a traditional Computer Numerical Control (CNC) milling machine using Acrylonitrile Butadiene Styrene (ABS) as material for 3D-printing. The Life Cycle Assessment (LCA) framework was used to analyse the environmental impacts for minimal and maximal utilisation scenarios for each technology. The results showed that the FDM technology had the lowest ecological impacts per part in any case. The inkjet machine performs better and sometimes worse than CNC depending on the idle time, energy, and process parameters.
In a study conducted by (Tang, Mak, and Zhao Citation2016), a framework was used to evaluate the environmental impacts of manufacturing an engine bracket using a binder-jetting process. The results showed that binder jetting consumes less energy and generates less CO2 emissions to produce a topologically optimised part than CNC milling of the same product.
Talking about the mechanical properties of AM products, (Samykano et al. Citation2019) reported tensile strength results for printed specimens varying with process parameters such as percentage infill. Analysing specimens with 40%, 60% and 80% infill, the study shows that the higher the percentage infill of the specimen with Acrylonitrile Butadiene Styrene (ABS) made using FDM technology, the greater the tensile strength results.
(Rejeski, Zhao, and Huang Citation2018) outlined some potential research needs for AM related to five key issues: energy use; occupational health; waste; life cycle impacts and cross-cutting and policy issues. In the case of the life cycle impacts, there is still a need to develop more LCA studies for the different 3D-printing technologies and materials.
However, to the best of our knowledge, there are no studies so far combining LCA results of AM with quality requirements of printed parts, and this paper aimed to fill this research gap. Also, the comparisons of AM with CM are still limited in the current literature and more studies are desired to enhance more knowledge on this field, with a focus on better understanding the trade-offs existing in AM and CM environmental impacts and quality of manufactured parts.
Therefore, this paper performed a comparative analysis between two manufacturing processes to evaluate the potential environmental impacts and mechanical properties of specimens produced in Injection moulding process as a CM technology and Fused Deposition Modelling (FDM) 3D printer as AM.
In the following sections, the materials and methods are presented in Section 2. In Section 3, the main results are discussed in depth and finally in Section 4, the conclusions are drawn considering future research.
2. Materials and methods
For this study we used black recycled Acrylonitrile Butadiene Styrene (ABS) pellets. The recycling process was performed at a Brazilian company called Sinctronics Innovation Center using plastic from Waste Equipment Electric Electronics (WEEE).
To compare the tensile strength test results for CM and AM, specimens with 165 mm x 13 mm x 3.2 mm were used based on the ASTM D638 standard as shown in .
Figure 1. Specimen dimensions according to ASTM D638 standard
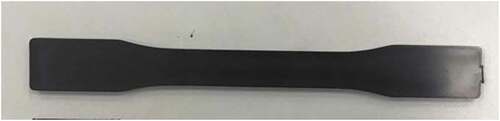
The CM specimens were injected using Tianjian PL860 injector located at Sinctronics. In . it is possible to see the ABS specimens made by injection moulding process.
Figure 2. CM specimens made by injection moulding process
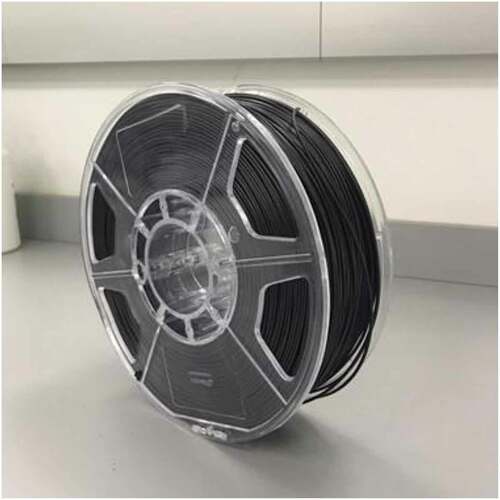
For AM, it was necessary to produce filaments (1.75 mm) with the recycled plastic. In it is possible to see the ABS filament coil. In 2019, the company recycled more than 1,000 tons of plastic and made more than 100 kg of filaments for 3D printers using recycled ABS.
Figure 3. The recycled ABS filament coil
The specimen was designed in Solidworks software and the print settings were established using the Simplify3D software tool (). The printing process was a GTMax 3D CoreAB 400 machine model also located at Sinctronics. The parameters values for printing are shown in .
Figure 4. Parameterised specimens ready to be printed
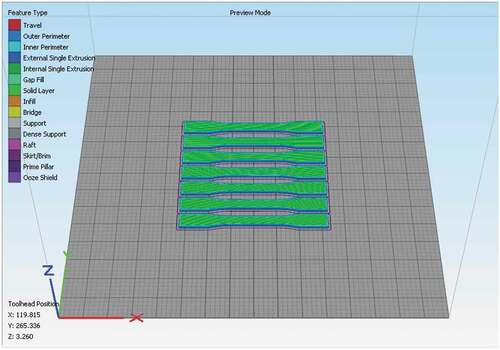
Table 3. Printer parameters
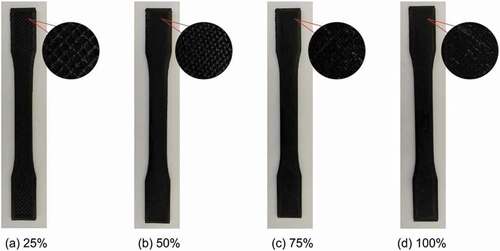
shows the different infill percentages, 25%, 50%, 75% and 100%, used for AM specimens as explained in . These scenarios were important to perform a sensitivity analysis of the LCA and strength tensile results in AM.
Figure 5. AM specimens made with 25%, 50%, 75% and 100% infill
Mechanical tensile strength tests were carried out in the Sinctronics laboratory using Instron 3366 equipment, with a load capacity of 10 kN, maximum speed of 500 mm/min, a vertical space of 1193 mm and in accordance with the ASTM D638 − 14. The Tensile Strength Limit (TSL) test, which measures traction before break, was performed on 5 samples from each of the 3 AM batches and 5 samples from the CM batch.
2.1. life cycle assessment methodology
In this section, the methodology used to develop the environmental performance assessment is explained. represents the four phases of this exploratory LCA, which are described in more details in the next paragraphs.
Figure 6. Life cycle assessment phases ISO 14040 (ISO, Citation2006)
2.1.1. Goal and scope
In the first phase, the goal and scope definition are described, and the system boundaries and functional units are established. The scope of this study is to evaluate and compare the injection moulding as CM with a 3D printing process in FDM as AM equipment using recycled ABS.
When developing the LCA, the following objectives are expected:
Compare the impacts of both manufacturing types and make this information available for decision makers;
Identify the hotspots and improvement opportunities in both, CM and AM;
Evaluate the influence of infill percentage variation in the potential impacts generated by the AM process;
Analyse and compare mechanical properties of parts made in both manufacturing situations.
2.1.2. Comparative systems description
The systems studied in this research can be seen schematically seen in . The elementary processes considered for both systems are:
Figure 7. CM and AM systems
a) Conventional Manufacturing: the process of pelletising the material at the end of the extrusion process and the injection moulding process;
b) Additive Manufacturing: the process of coiling material coming out of the extruder and 3D printing process.
First, the material in the study was extruded and pelletised. Then, it was injected (CM system) or it was coiled in filaments for AM system. The extrusion process was not considered as an integral stage of the system boundaries due to it happens in both CM and AM, thus presenting the same impacts for both the comparative systems.
Specific details for CM are detailed in . It presents the electric energy consumption and recycled ABS used as input. The gas emissions from the heating and melting of ABS and solid waste (material discarded in equipment cleaning step) are considered as output flows. However, it is important to note that the air emissions of gases were excluded from the system boundaries due to lack of data for measurement of this output.
Figure 8. System boundary for CM
The additive manufacturing system is shown in . It has electric energy consumption and recycled ABS as main inputs. The gas from the melting of extruded ABS, solid waste (from the 3D printing process) and the printed part are shown as outputs. It is important to note that gases releases were not included in the system boundaries.
Figure 9. System boundary for AM
2.1.3. Functional unit
The study has a cradle-to-gate approach and the functional unit was the reference flow defined as the 1-sample production of a specimen with the same shape and dimensions as described by the ASTM D638. Therefore, both the manufactured parts in AM and CM show the same quality requirements following the ASTM D638 standard. Also, it is important to mention that these manufactured parts are intermediate products (specimens for lab tests) and they do not perform as end use products. In this case we can limit the comparisons to cradle-to-gate approaches instead of a complete life cycle perspective, as suggested by the ILCD handbook for LCA (European Commission – Joint Research Centre – Institute for Environment and Sustainability, 2010).
The system’s boundaries included only the processes that are different from each other considering AM and CM (). The weight of the injected specimens produced by CM was 8.566 g (± 0.428) and the masses of 25%, 50%, 75% and 100% filled parts by AM were 6.224 g (± 0.048), 6.881 g (± 0.054), 7.536 g (± 0.044) and 7.912 g (± 0.064), respectively.
2.2. Life cycle inventory (LCI)
In the second phase of LCA, the data collected for the inventory was based on the Unit Process Life Cycle Inventory (UPLCI) methodology proposed by Kellens et al. (Citation2012a), whose main characteristic is to help in the inventory step of manufacturing processes.
In order to give more details in the results of the electric energy consumption, the gathered data was divided for each mode of operation and subunit of the equipment, as suggested by (Kellens et al. Citation2012a, Citation2012b). To obtain the energy consumption data of the equipment considered for AM and CM, a digital clamp metre with 0.01 A precision of the Minipa brand model ET-3200A was used. The ammeter was installed at the entrance of the equipment, and with the respective nominal electrical voltage values (V) of each equipment, it was possible to calculate the active power (W). With the power (W) and the duration of each step of the process the consumption (Wh) was obtained.
The injection process was divided into the following modes of operation:
- Stand-by: when the equipment is not operating but it is on.
- Heating: the period when the equipment has its heating system ready to reach the ideal working temperature.
- Loading/Cleaning: the process carried out at the beginning of the operation, responsible for filling the injection system and removing the residual material that may be inside the machine.
- Injection: this mode of operation consists of the injection process itself where the material is injected into the mould and ejected as a finished part.
For AM process (FDM), the following modes of operation were considered:
- Stand-by: when the printer is not operating, while its electronic panel is on.
- Filament loading: it happens when the filament is loaded in the machine.
- Table heating: the machine spends time, normally 40 minutes, heating the table before a printing process.
- Pre-printing: this mode of operation consists of a sequence of steps performed by the printer to ensure that the table is in the right place and the distance between the nozzle and the table is correct.
- Nozzle heating: heating the extruder nozzle of the printer.
- Printing: the mode of operation in which the parts with different infill % are printed.
- Filament unloading: similar to the loading mode, but taking the filament out of the tube.
In this way, it was made possible to identify, separately, the influence of the modes of operation of the equipment on the potential impacts for the comparative LCA.
2.2.1. Injection moulding process
In this research, some scenarios were considered for the preparation of CM data inventory, considering the size of the batch to be produced. Hence, inputs and outputs to produce 7, 14, 50 and 100 parts are represented in the inventory. The number of parts made by the AM per batch was 7 parts, so this quantity was used as the initial step for analysis of CM. For the other batch size, larger production values were estimated to make it possible to observe the influence of this parameter on the generated impacts. Moreover, it was necessary to evaluate the operating time in each of the operating modes of the equipment, energy consumption in each mode and the total consumption of materials, as described by (Kellens et al. Citation2012a).
The inventory for this system is shown in . It can be observed that as the batch size increases, the energy consumption of the following modes of operation, such as stand-by, heating and loading/unloading modes per part decreases. Subsequently, the greater the number of parts produced in the same batch, the greater the denominator of that division. Besides electricity, raw material consumption and waste generation in the process per part are reduced with the increase of batch size. Since at the beginning of the manufacturing process, a quantity of material must be discarded for setup, this quantity becomes more diluted among the parts produced as the batch size increases. As there is only one mould, which makes 6 different specimens at the same time, it is not possible to make only the pieces of the study (). Moreover, this division was made considering the mass of each specimen.
Figure 10. Six different specimens from the injection moulding process
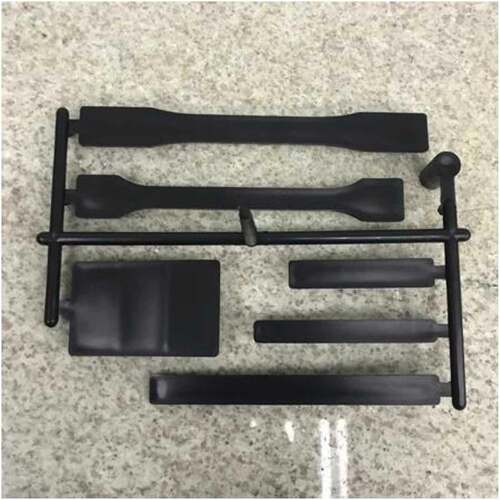
Table 4. Injection moulding process – Conventional manufacturing inventory
2.2.2. Fused Deposition Modelling (FDM) – Additive manufacturing (AM) inventory
The life cycle inventory for the AM system was developed based on some production scenarios. The infill percentages were varied to analyse the influence of this parameter on the results. In terms of the quantity of manufactured parts via AM, 7 parts were printed per each batch.
presents the inventory data for the AM system. The results of the inventory analysis for AM indicate the increase in the electric energy consumption during the manufacturing of each part when the infill increases. This happens since the printer spends more time on more infill percentages. In the same way, raw material consumption increases when varying the infill percentage. However, the amount of residue generated remains the same, regardless of the infill and the quantity of the parts, since the residues occur at the beginning of the whole process.
Table 5. Fused Deposition Modelling (FDM) technology – Additive manufacturing inventory
For the recycled ABS, the inventory data used in the life cycle assessment modelling was extracted from Campolina et al. (Citation2017). The study was conducted in the same company chosen for this research, which ensures greater accuracy in data use. (Campolina et al. Citation2017) state that the ABS from the WEEE recycling process emits 87% less CO2 and consumes 90% less energy when compared to virgin ABS production data. This background inventory was supplied in the SimaPro 8.4.1.4 LCA software tool to complete the cradle-to-gate models of CM and AM systems.
2.3. Life cycle impact assessment (LCIA)
In the third LCA phase, the LCIA step was performed based on a research pointing out three main methods: a) Impact 2002+ v2.14 [40, 33]; b) ReCiPe as proposed by (Faludi et al. Citation2015), (Malshie et al. Citation2015), and (Nagarajan et al. Citation2016) and c) the Cumulative energy demand (CED) v1.09 as suggested by (Kreiger et al. Citation2014), (Kreiger and Pearce Citation2013), and (Paris et al. Citation2016). In the SimaPro 8.4.1.4 LCA software, the ReCiPe 2016 Midpoint (H) v1.00 version was used, which is an update and expansion of the previous version of the ReCiPe method developed by (Goedkoop et al. Citation2009).
Among the impact categories in the Impact 2002+ and Recipe methods, the most relevant category according to prior studies on the topic is the Global Warming Potential (GWP). (Kreiger et al. Citation2014) and (Kreiger and Pearce Citation2013) used the impact assessment method IPCC 2007 GWP 100a to calculate this impact. Furthermore, (Barros and Zwolinski Citation2016) also highlighted GWP as a key impact category for industries.
To compare the two types of manufacturing systems, the values found by the ReCiPe 2016 method were used and compared with the LCIA results generated by the Impact 2002+ method in Section 3.1, while in Section 3.2 will be presented the CED results for CM and AM.
3. Results and discussion
3.1. Global warming potential (GWP)
From the inventory data provided in , the GWP of the AM and CM parts were calculated using the Impact 2002+ and ReCiPe 2016 methods, as shown in .
Table 6. GWP of CM and AM systems
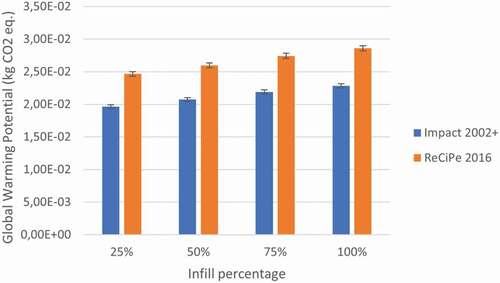
In , the GWP for additive manufacturing for four different infill percentages can be observed. The difference between 25% to 50%, 50% to 75% and 75% to 100% fillers were approximately 5%. The variation is constant due to the proportional increase of the infill, that is, the amount of material used in each part.
Figure 11. Global warming potential per functional unit in AM
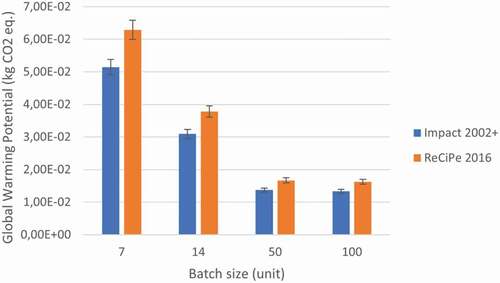
On the contrary, a reduction in GWP results of CM can be observed in , where the batch sizes vary from 7 to 14 and to 50 manufactured parts. When the batch size is increased from 7 to 14 parts, the GWP reduces up to 40%, and there was a reduction of 56% for 50 parts as compared to 14 parts per batch. This happens because the increase in the number of parts produced per batch reduces the electric energy consumption per part produced.
Figure 12. Global warming potential results per functional unit in CM
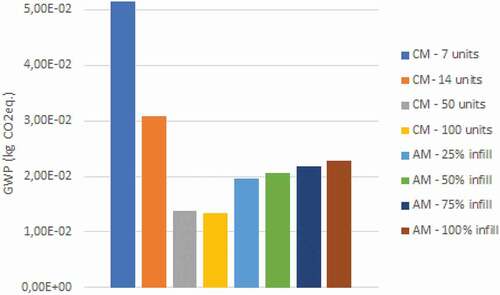
shows the GWP results of AM and CM according to the variation of the batches and different infill values for AM, making it possible to compare the two manufacturing types. Analysing all CM and AM results, it is possible to notice that the batch with 7 parts produced by CM has the highest GWP result, around 5,14E-02 kg CO2eq. Also, it shows that from a batch size higher than 14 parts, the CM can generate a lower value of GWP when compared to AM results. The lowest GWP results for AM are associated with the parts made with 25% infill, i.e. 1,97E-02 kg CO2eq. per functional unit. For CM, the batch with 100 parts has the lowest GWP (1,33E-02 kg CO2eq.), which is practically 70% of the results for AM with 25% infill. However, when the batch changes from 50 to 100 parts, the GWP differs only 2.5%. Thus, for batch sizes greater than 100 parts the differences become irrelevant and the GWP values become almost constant in CM. In summary, CM with 50 or 100 units has a similar profile compared to AM with 25% infill.
Figure 13. Comparing GWP results per functional unit between AM and CM systems
These results agree with those found in the literature (Yoon et al. Citation2014) compared AM energy consumption with two types of conventional manufacturing (injection moulding and milling) and concluded that AM showed a lower Specific Energy Consumption (SEC), depending on batch size. For (Yoon et al. Citation2014), CM became more economical in terms of energy consumption when the batch has more than 5 parts. Similarly, (Senyana and Cormier Citation2014) compared the AM with the CM and related the environmental performance by parts produced.
(Kianian and Larsson Citation2015) compared injection moulding with the Vat Photopolymerisation process of AM. They concluded that electric energy consumption was favourable to AM up to the production of 100 parts and, from this volume of production, CM consumes lower energy. (Faludi et al. Citation2015) compared two types of AM equipment with the machining process and found that AM presented better environmental performance depending on the batch size of the production.
(Chen et al. Citation2015) evaluated the embodied energy of AM and injection moulding and concluded that for a production of up to 100 parts the values found for the two types of manufacturing were equivalent. However, from 100 parts, the advantage of embodied energy was superior for the CM process. Thus, the results found in this work agree with the previous literature when evaluating the influence of the batch size in both manufacturing types.
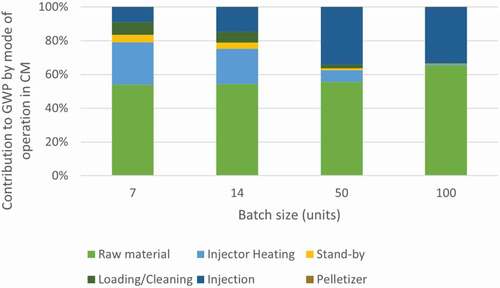
Using the UPLCI methodology, the impact of each stage of operation of the equipment and its influence on the GWP can be evaluated. and demonstrate the GWP values from the two processes considering the mode of operation and raw material utilisation.
Figure 14. Contributions of modes of operation and raw material in GWP results for AM
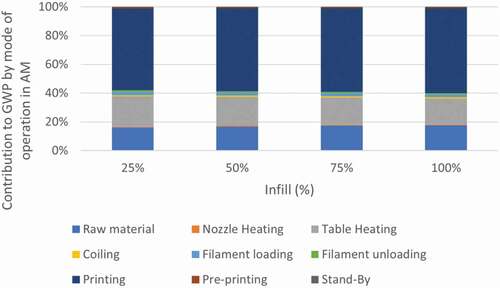
Figure 15. Contribution of modes of operation and raw material in the GWP results for CM
It can be observed from the graph that the printing stage contributes more to GWP as compared to the other stages of the process and the material. The high value of the printing process is justified by the fact that, besides being the most time-consuming stage in the production system, a large amount of energy is consumed to maintain the printer (table and head) heated. This is proven by the fact that the table heating stage is the second largest generator of impacts in the process. The study also shows similar values for the GWP category in the different percentages of infill of the parts.
The table heating process consumes energy because of the fixed heating time, regardless of whether the table was already hot or not. Apparently, the printer has a single temperature sensor, but if there were sensors in the corners checking the real temperature of the table, showing that all of the corners are heated before 40 minutes, the heating time could be reduced, which would reduce the consumption of electricity in this stage of the process.
The raw material consumption is the third largest impact generator in the AM, unlike the CM, as can be seen in and 15. The number is lower for AM because of the amount of residue. The low variation in the distribution of impacts by mode of operation, with different infill percentages is highlighted because the energy consumption values for all modes, except the printing mode, are fixed as seen in .
For injection moulding (.), the raw material consumption is the main generator of GWP. Besides the material consumption to clean the equipment, there is a formation of ducts, where the material must fill the mould until the final part is generated. The amount of material wasted in the ducts represents about 33% of the mass of the injected part. As the batch increases, the influence of the heating, stand-by and charging steps decreases. These values are diluted with the increase in the number of parts produced, and the whole generation of GWP is caused by the consumption of raw material and the injection process. Unlike the process of AM, in the injection moulding (CM), greater consumptions do not come from the heating system (about 6.2 kW), but from the motors (11 kW). This happens due to the need for high pressures to close the mould and distribute the material evenly to the mould cavities. According to the manufacturer’s manual, the power of the heating system is 6.2 kW, while the motors have power of 11 kW.
3.2. Cumulative energy demand (CED)
presents the results obtained from the LCIA, comparing the results of the CM and AM for the Cumulative Energy Demand (CED), which was one of the impact assessment methods used in studies that focused on the AM environmental performance. (Paris et al. Citation2016) used the sum of impacts generated by the CED along with six impact categories of the CML 2 Baseline 2000 LCIA method to compare the results between AM and CM. Similarly, (Kreiger and Pearce Citation2013) used the CED method to evaluate and compare AM and CM results. (Kreiger et al. Citation2014) also used aggregated values generated by the CED impact to study the recycled High-Density Polyethylene (HDPE) used to make filaments for AM. Hence, in this work the sum of the six categories of impact is used as follows: Non-renewable (fossil), Non-renewable (nuclear), Non-renewable (biomass), Renewable (biomass), Renewable (wind, solar, geothermal), and Renewable, (water) to compare the results between AM and CM.
Table 7. CED of conventional and additive manufacturing
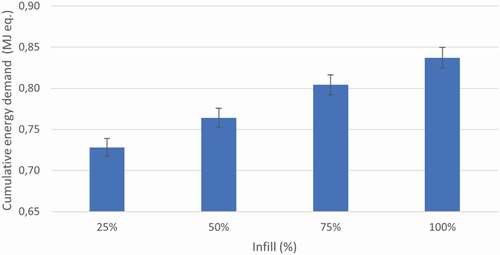
and 17 indicate the values obtained using the CED method for the AM and CM, respectively. It can be observed from that, as the infill percentage of printed parts increases for the AM, the CED also increases. Furthermore, it can be observed that while varying the infill from 25% to 50%, the CED value increases by 4.1%. For the increase from 50% to 75%, there is an increase of 5.2% in the CED and when the infill % changes from 75% to 100%, the increase in CED is 5%. This small difference in CED values is generally due to the slight difference in the printing time for the different infill percentages. Thus, the difference between the CED results of the parts with the least infill (25%) and the parts with the greatest infill (100%) is approximately 15%.
Figure 16. Cumulative energy demand (CED) results per functional unit for AM
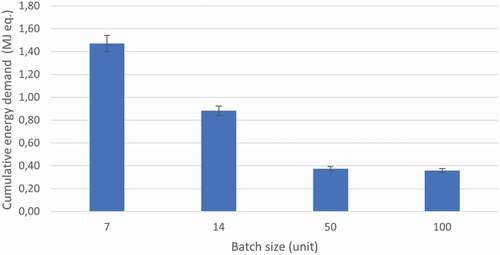
In addition, shows the CED values for the CM according to the batch size produced by the injector. It can be observed that when the batch size increases from 7 to 14 parts, there is a 40% reduction in CED values. By changing the batch size from 14 to 50 parts, 56.8% CED reduction is obtained and by increasing the batch size from 50 to 100 parts, a reduction of 5.4% is achieved. The difference between the CM results of the smallest batch (7 parts) is about 4 times greater than the result of the largest batch (100 parts). This is because, as seen in , the impacts caused by the Injector Heating stage are distributed by each unit produced, so if fewer parts are produced in a batch, those parts receive a higher percentage of the Injector Heating impacts than a larger batch.
Figure 17. Cumulative energy demand (CED) results per functional unit for CM
The differences found in the CED values obtained for both AM and CM are similar to those found when evaluating the GWP results in Section 3.1, which allows to affirm there is an alignment (positive correlation) in these results.
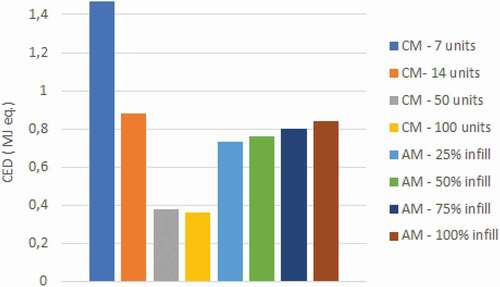
. shows the CM and AM results, making it possible to compare their CED values. Analysing all CM and AM results, it is possible to notice that the batch with 7 parts produced by CM has the highest CED result, around 1.47 MJ eq. Furthermore, it is possible to notice that the results of CM with 14 parts and AM with 100% infill are relatively similar, 0.88 MJ eq. and 0.84 MJ eq., respectively. Also, it shows that from a batch size higher than 14 parts, the CM can generate a lower value of CED when compared to AM results. The lowest CED results for AM are associated with the parts made with 25% infill, 0.73 MJ eq. For CM, the batch with 100 parts has the lowest CED value, 0.36 MJ eq. which is practically half of the results of AM with 25% infill.
Figure 18. Comparing CED results per functional units for AM and CM
Moreover, it is noted that none of the articles studied the influence of batch size for CED. (Paris et al. Citation2016) analysed the CED values together with the values found through the CML 2 Baseline 2000 LCIA method to define the ratio between the volume of material required (for a part to be made by the milling process) and the final volume of the part. It was found that the impact generated by the AM was lower than that generated by the CM. (Kreiger and Pearce Citation2013) used the CED methods and calculated the GWP through the ILCD 20107 LCIA method and concluded that the AM can generate smaller impacts due to its capacity to change the infill percentage of the printed parts. Moreover, and 20 show the contribution of each stage of operation based on the ULCI methodology application and the consumption of raw material from both the AM and CM to the CED.
Figure 19. Contribution of modes of operation and raw material in CED for AM
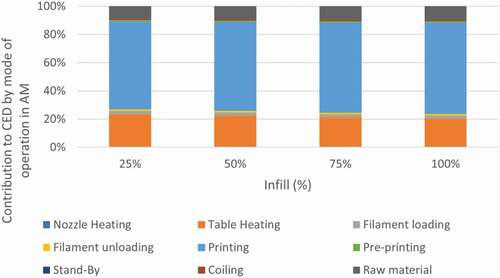
It can be noticed by analysing that the printing stage of the parts is the process that has the most impact on the CED method, followed by the table initial heating stage. Similar to GWP evaluation, the printing stage consumes a greater amount of electric energy because of the fixed time.
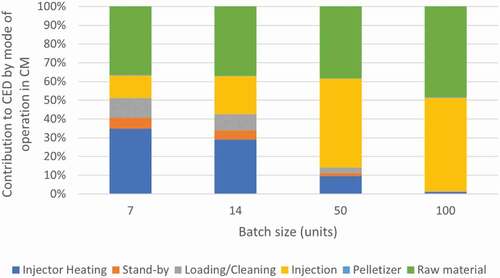
The contribution of the modes of operation and raw material in the CED results of the CM are presented in . Unlike the GWP analysis, the injection stage has a greater influence on the results of the CED values. In addition, the values referring to the raw material consumption were close to proximity only for the batch of 100 parts. Furthermore, the total value generated by the electric energy consumption in the injection stage was higher than the values for ABS consumption for the CED results. The other stages of the CM (heating, stand-by and loading) also reduced as the size of the batch increased, as observed in the GWP analysis.
Figure 20. Contribution of modes of operation and raw material in CED for CM
3.3. Mechanical tensile strength tests
The TSL is expressed as MPa by dividing the perpendicular force applied to the test body by the cross-sectional area of the test parts (ASTM, Citation2014). In addition, the results of the percentage, measuring the elongation of the material until its break during the test, were analysed. The mechanical properties of tensile strength and elongation at break are presented in . It shows a growth in TSL as the infill percentage of the printed parts increases, rising 7% of the result with 25% infill to 50% infill, 15% of the specimen with 50% to 75% and 7.5% of the specimen with 75% infill to 100% infill.
Figure 21. Mechanical properties of different infill % of AM and CM parts
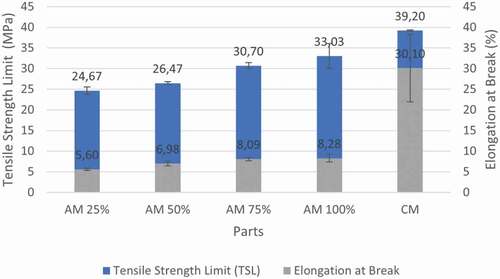
The results above agree with the results obtained by (Samykano et al. Citation2019). The authors report that for a specimen with 40% infill the tensile strength values vary from 24.56 to 30.15 MPa. For infill of 60% the tensile strength ranges from 26.51 to 31.27 MPa and for 80% infill the variation occurs between 30.78 to 33.78 MPa. Although the specimens do not have the same infill percentage as the specimens of this study it is possible to notice that the results are congruent and the tensile strength values increase with more infill.
Increasing the infill percentage of the printed parts increases its mass, and consequently reduces empty spaces within each part, which improves the ability of the body to withstand traction. When the TSL of 100% infill AM was compared to CM parts, it was observed that CM has 19% higher TSL, which means that even the AM part with the maximum infill still has a relatively lower strength than the CM part. This is because of the difference in weight of the parts and the intermolecular interaction of the material. In the CM parts, the chains are stretched in the direction of injection, which improves the TSL results. For AM parts, this does not occur, because the layers are only deposited on each other Leigh (Citation2012).
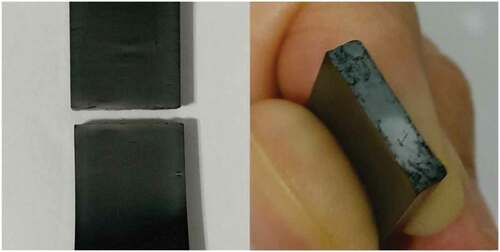
In addition, increasing the infill percentage makes the part elongate further before breaking. Comparing the 100% filled AM parts with the CM parts, it can be observed that the CM parts can stretch up to 3x more than the AM ones. This is due to the difference in mass and the intermolecular interaction; hence the AM parts do not have the same behaviour as each layer stretches individually. For a better understanding, and present the frontal and lateral view of the breaking suffered by the parts during the tensile test.
Figure 22. Front and lateral view of the breaks suffered by the printed parts during the tensile test
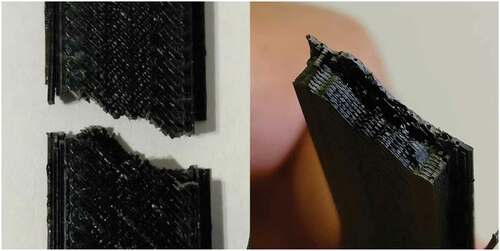
Figure 23. Front and lateral view of the breaks suffered by the injected parts during the tensile test
3.4. Mechanical eco-efficiency of AM parts
As can be seen in Section 3.1, the increase in GWP was approximately 5% when the infill of AM parts was changed. Considering the mechanical properties, for the AM parts, it was observed that the resistance to break was higher and increased the % of infill. Between the 50% and 75% infill, an increase in TSL and elongation at the break of approximately 16% was observed. When 75% and 100% filled parts were evaluated, an increase in TSL and elongation at break of 7.6% and 2.4% was observed, respectively. Moreover, when the generated GWP and the TSL of the printed parts were analysed, it was observed that the percentage increase of the GWP was smaller than the gain in the TSL, which, in general, represents that the resistance gain of the printed parts is greater than the loss generated from the environmental point of view, at least as far as the GWP is concerned. The elongation at break also obtained growth above the increase of the generated impacts, except for the printed part at 100% that had a percentage increase smaller than the increase of the GWP.
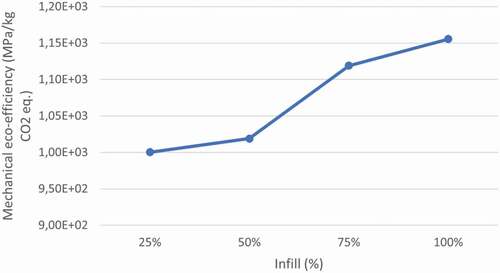
In general, it can be said that the gains in the mechanical properties of AM parts with a higher infill exceed the increase of the environmental load generated in the GWP impact category. For a better visualisation of this phenomenon, presents an overview of this indicator. This indicator relates the TSL in MPa unit with the GWP results expressed in kg CO2 eq. It can be observed that the increase in the AM part infill improves this indicator, that is, the quality of the part in terms of TSL.
Figure 24. Mechanical eco-efficiency results per functional unit for the different infill percentage in the AM
4. Conclusion
This study provided a cradle-to-gate life-cycle assessment of comparative conventional and additive manufacturing (CM and AM) using black recycled Acrylonitrile Butadiene Styrene (ABS) pellets to evaluate the potential environmental impacts and mechanical properties of specimens produced.
The results indicate a lower environmental impact of the AM when the aim is to produce a batch size smaller than 14 parts. For batch sizes above 50 parts, the CM process generated less impact to the Global Warming Potential (GWP) and Cumulative Energy Demand (CED).
Analysing the GWP and the CED results, we showed that AM presented a lower environmental impact than compared to the injection moulding (CM), as the batch size produced in the CM was greater than or equal to 50 parts.
Hotspots were also identified, and in the case of AM, both the GWP and CED values showed that the printing stage is the largest impact generator, followed by the table heating stage and the consumption of raw material. In the CM system, the GWP and CED evaluations showed that the injection stage is the most responsible for causing impacts, followed by raw material consumption.
CM with 50 or 100 units have almost the same GWP results, while CM with 7 units show more than three times more GWP impacts. However, the CM with 50 or 100 units has a similar profile compared to AM with 25% infill. Therefore, CM with higher batches can reduce GWP close to or even reduce the impacts per function unit in more units of impact than for the AM technology.
By evaluating the mechanical properties of the parts manufactured by AM, a better mechanical resistance was observed as the mass of material of each part increased. Regarding TSL, the difference between the AM part (100% infill) and the CM part represented a 19% lower performance. For elongation at break, the difference between the AM’s manufactured parts with 100% infill and the CM’s parts was approximately 300%. The difference in the TSL values was caused by the mass difference between the parts produced through AM and CM and the intermolecular interaction to which these parts were submitted. Moreover, the relevant difference in elongation at break was due to the lack of homogeneity in the AM parts, which made each deposited filament behave in an individualised way.
Finally, with the mechanical eco-efficiency indicator, it was observed that the gains in the mechanical properties of the AM parts with a greater infill percentage outweigh the increase in the environmental impact generated by them. This proposed indicator could be used by 3D-printing manufactures and researchers in future studies in AM.
Nomenclature
ABS Acrylonitrile Butadiene Styrene
AM Additive Manufacturing
CEDCumulative Energy Demand
CH4Methane
CMConventional Manufacturing
CNCComputer Numerical Control
CO2Carbon Dioxide
FDMFused Deposition Modelling
GWPGlobal Warming Potential
HDPEHigh density polyethylene
IPCCIntergovernmental Panel on Climate Change
LCALife Cycle Assessment
LCIALife Cycle Impact Assessment
LCILife Cycle Inventory
N2ONitrous Oxide
R&DResearch and Development
SECSpecific Energy Consumption
TSLTensile Strength Limit
UFPsUltrafine Particulate Emissions
UPLCIUnit Process Life Cycle Inventory
WEEEWaste Equipment Electric Electronics
Declarations
Funding (information that explains whether and by whom the research was supported)This study was financed in part by the Coordenação de Aperfeiçoamento de Pessoal de Nível Superior – Brazil (CAPES) – Finance Code 001 and by the Conselho Nacional de Desenvolvimento Científico e Tecnológico (CNPq) - 406,017/2018-2.
Conflicts of interest/Competing interests (include appropriate disclosures)
‘Not applicable’ for that section.
Availability of data and material (data transparency)
The Life Cycle Inventory (LCI) was based on the Unit Process Life Cycle Inventory (UPLCI) methodology. For Injection Molding Process -Conventional Manufacturing Fused Deposition Modelling (FDM) inventory and Additive manufacturing (AM) inventory all the data presented is from primary sources.
Code availability (software application or custom code)
‘Not applicable’ for that section.
Authors’ contributions (optional: please review the submission guidelines from the journal whether statements are mandatory)
‘Not applicable’ for that section.
Acknowledgments
We would like to thank the Sinctronics Innovation Center for their openness and trust to conduct this study on their production process. Moreover, this study was financed in part by the Coordenação de Aperfeiçoamento de Pessoal de Nível Superior – Brazil (CAPES) – Finance Code 001 and by the Conselho Nacional de Desenvolvimento Cientifico e Tecnologico (CNPq) - 406017/2018-2.
Disclosure statement
No potential conflict of interest was reported by the author(s).
Additional information
Funding
Notes on contributors
Fabricio Leon Garcia
Fabricio Leon Garcia is a chemical engineer who graduated from the Federal University of São Carlos (UFSCar) Sorocaba campus – Brazil (2012) and has a Master’s degree in Production Engineering at the Federal University of São Carlos (UFSCar) São Carlos campus – Brazil (2018). Experience in the area of Environmental Engineering, working mainly Life Cycle Assessment (LCA) area.
Andréa Oliveira Nunes
Andréa Oliveira Nunes has a Ph.D. in Process and Environmental Engineering at the Institut National Polytechnique de Toulouse - France (2015). Post-doctorate at the Federal University of São Carlos (UFSCar). Currently is an adjunct professor in the Department of Chemical Engineering at the Federal University of Rio Grande do Norte (UFRN) - Brazil. Experience in the area of Chemical and Environmental Engineering, working mainly on the following topics: solid waste recycling, Life Cycle Assessment (LCA), sustainable production, treatment of water and effluents, processes optimisation, reactors, thermal processes, composites, carbon fibres, and natural and synthetic polymers.
Mariane Guerra Martins
Mariane Guerra Martins is an industrial engineer under graduated from the Federal University of São Carlos (UFSCar), Sorocaba, São Paulo and currently she is a master’s degree student at the same university. She is a Jr engineer at the sinctronics innovation centre mainly working with circular economy projects including life cycle assessment, additive manufacturing, and plastics recycling.
Maria Cristina Belli
Maria Cristina Belli has a Master’s degree in Analytical Chemistry at the State University of Campinas (UNICAMP). Experience in the area of electroplating, PCB manufacture, processes optimisation, and additive manufacturing. Currently is Manager of Research and Development at Sinctronics (Green IT Innovation Center) working with Circular economy projects.
Yovana M.B. Saavedra
Yovana María Barrera Saavedra is an Environmental Engineering at Manuela Beltran University (UMB-Colombia). Ph.D. in Environmental Engineering Sciences at the EESC-USP and Adjunct Professor at Federal University of São Carlos (UFSCar) – Buri campus. She is a researcher in the following topics: Life Cycle Management and Engineering, Industrial Ecology, Sustainability, End-of-Life-Strategies, Circular Economy
Diogo Aparecido Lopes Silva
Diogo A. Lopes Silva is a wood industrial engineer who graduated from São Paulo State University (UNESP), Ph.D. in Production Engineering at the University of São Paulo (USP) and Adjunct Professor at Federal University of São Carlos (UFSCar) – Sorocaba campus. He is a researcher in the following topics: Life Cycle Engineering (LCE), Life Cycle Management (LCM), Life Cycle Assessment (LCA), Sustainable Manufacturing, Production Planning and Control, and Wood Products Characterization and Design.
Virgínia Aparecida da Silva Moris
Virgínia Aparecida da Silva Moris graduated in Chemical Engineering from the Federal University of Uberlândia (1995), Master in Chemical Engineering from the State University of Campinas (1998). In 2002, she obtained the title of Doctor in Chemical Engineering from the State University of Campinas and completed her post-doctorate (2009) at the State University of Campinas. Experience in the area of Chemical and Environmental Engineering, working on the following topics: Reuse of solid waste, Cleaner production, Sustainability indicators, Life cycle assessment, Reverse logistics, Circular economy, and monitoring of industrial processes.
References
- Alister, C. M., and J. Wood 2014. The Potential of 3D Printing to Reduce the Environmental Impacts of Production.ECEEE Industrial Summer Study Proceedings. 213–221. 2-5 June, 2014, Arnhem, Netherlands.
- Attaran, M. 2017. “The Rise of 3-Dprinting: The Advantages of Additive Manufacturing over Traditional Manufacturing.” Business Horizons 60 (5): 677–688. doi:https://doi.org/10.1016/j.bushor.2017.05.011.
- Barros, K. D. S., and Zwolinski. 2016. “Influence of the Use/User Profile in the LCA of 3d Printed Products.” Procedia CIRP 50: 318–323. doi:https://doi.org/10.1016/j.procir.2016.05.005.
- Baumers, M., P. Dickens, C. Tuck, and R. Hague. 2016. “The Cost of Additive Manufacturing: Machine Productivity, Economies of Scale and Technology-push.” Tech Forec. Soc. Ch 102: 193–201. doi:https://doi.org/10.1016/j.techfore.2015.02.015.
- Berman, B. 2012. “3-D Printing: The New Industrial Revolution.” Bus. Horiz 55 (2): 155–162. doi:https://doi.org/10.1016/j.bushor.2011.11.003.
- Böckin, D., and A. M. Tillman. 2019. “Environmental Assessment of Additive Manufacturing in the Automotive Industry.” J. Clean Prod 226: 977–987. doi:https://doi.org/10.1016/j.jclepro.2019.04.086.
- Campolina, J., C. Sigrist, J. Paiva, A. Nunes, and V. Moris. 2017. “A Study on the Environmental Aspects of WEEE Plastic Recycling in A Brazilian Company. Inter.” J.Life Cycle Assess 22 (12): 1957–1968. doi:https://doi.org/10.1007/s11367-017-1282-2.
- Caviggioli, F., and E. Ughetto. 2019. “A Bibliometric Analysis of the Research Dealing with the Impact of Additive Manufacturing on Industry, Business, and Society.” Inter. J. Prod Econ 208: 254–268. doi:https://doi.org/10.1016/j.ijpe.2018.11.022.
- Chen, D., S. Heyer, S. Ibbotson, K. Salonitis, G. Steingrímsson, and S. Thiede. 2015. “Direct Digital Manufacturing: Definition, Evolution, and Sustainability Implications.” J.Clean. Prod 107: 615–625. doi:https://doi.org/10.1016/j.jclepro.2015.05.009.
- Chen, X., C. Shuai, Y. Wu, and Y. Zhang. 2021. “Understanding the Sustainable Consumption of Energy Resources in Global Industrial Sector: Evidences from 114 Countries.” Environ Imp. Assess. Rev 90: 106609. doi:https://doi.org/10.1016/j.eiar.2021.106609.
- Choi, J. 2018. “The Rise of 3D Printing and the Role of User Firms in the US: Evidence from Patent Data. Tech. Anal.” Strateg. Manag 30 (10): 1–15. doi:https://doi.org/10.1080/09537325.2018.1458979.
- Dwivedi, G., S. K. Srivastava, and R. K. Srivastava. 2017. “Analysis of Barriers to Implement Additive Manufacturing Technology in the Indian Automotive Sector. Inter Jphys. Distrib.” Logist. Manag 47 (10): 972–991. doi:https://doi.org/10.1108/IJPDLM-07-2017-0222.
- Equbal, A., S. Akhter, A. K. Sood, and I. Equbal. 2021. “The Usefulness of Additive Manufacturing (AM) in COVID-19.” Annals of 3D Printed Medicine 2: 100013. doi:https://doi.org/10.1016/j.stlm.2021.100013.
- Faludi, J., C. Bayley, S. Bhogal, and M. Iribarne. 2015. “Comparing Environmental Impacts of Additive Manufacturing Vs Traditional Machining via Life-cycle Assessment.” Rap. Prototyp. J 21 (1): 14–33. doi:https://doi.org/10.1108/RPJ-07-2013-0067.
- Ford, S., and M. Despeisse. 2016. “Additive Manufacturing and Sustainability: Anexploratory Study of the Advantages and Challenges.” J. Clean. Prod 137: 1573–1587. doi:https://doi.org/10.1016/j.jclepro.2016.04.150.
- Garcia, F. L., V. A. S. Moris, A. O. Nunes, and D. A. L. Silva. 2018. “Environmental Performance of Additive Manufacturing Process – An Overview.” Rap. Prototyp. J 24 (7), 1166–1177. https://doi.org/10.1108/RPJ-05-2017-0108 7
- Goedkoop, M. J., R. Heijungs, M. A. J. Huijbregts, A. M. De Schryver, J. Struijs, and R. Van Zelm (2009). ReCiPe 2008: A Life Cycle Impact Assessment Method Which Comprises Harmonised Category Indicators at the Midpoint and the Endpoint Level; First Edition Report I: Characterisation.
- Grassi, G., S. L. Spagnolo, and I. Paoletti. 2019. “Fabrication and Durability Testing of a 3D Printed Façade for Desert Climates.” Add. Manuf 28: 439–444. doi:https://doi.org/10.1016/j.addma.2019.05.023.
- Guo, N., and M. C. Leu. 2013. “Additive Manufacturing: Technology, Applications and Research Needs.” Front. Mech. Eng 8 (3): 215–243. doi:https://doi.org/10.1007/s11465-013-0248-8.
- Gutowski, T., S. Jiang, D. Cooper, G. Corman, H. M. Manson, J. A. Schudeleit, T. Wegener, K. Sabelle, M. Ramos-Grez, and J. SekulicD.P. 2017. “Note on the Rate and Energy Efficiency Limits for Additive Manufacturing.” J. Ind. Ecol 21 (S1): S69–S79. doi:https://doi.org/10.1111/jiec.12664.
- International, A. S. T. M. 2014. “ASTM D638-14 Standard Test Method for Tensile Properties of Plastics.” West Conshohocken, PA; ASTM Int. doi:https://doi.org/10.1520/D0638-14.
- IPCC. 2021. “Summary for Policymakers. In: Climate Change 2021: The Physical Science Basis. Contribution of Working Group I to the Sixth Assessment Report of the Intergovernmental Panel on Climate Change.” In edited by V. Masson-Delmotte, P. Zhai, A. Pirani, S. L. Connors, C. Péan, S. Berger, N. Caud, et al. Press: Cambridge University Press. 42p.
- ISO (International Organization for Standardization) (UNI EN) 14040. 2006. Environmental Management–life Cycle Assessment (Lca)—principles and Framework. Switzerland: Geneve.
- Jamshidinia, M., A. Sadek, M. Wang, and S. Kelly. 2015. “Additive Manufacturing of Steel Alloys Using Laser Powder-bed Fusion.” Advan. Mater. Process 173 (1): 20–24.
- Kellens, K., M. Baumers, T. G. Gutowski, W. Flanagan, R. Lifset, and J. R. Duflou. 2017. “Environmental Dimensions of Additive Manufacturing: Mapping Application Domains and Their Environmental Implications.” Journal of Industrial Ecology v21n (S1): S49–S68. doi:https://doi.org/10.1111/jiec.12629.
- Kellens, K., W. Dewulf, M. Overcash, M. Z. Hauschild, and J. R. Duflou. 2012a. “Methodology for Systematic Analysis and Improvement of Manufacturing Unit Process Life Cycle Inventory (UPLCI) CO2PE! Initiative (Cooperative Effort on Process Emissions in Manufacturing). Part 2: Case Studies. Inter.” J.Life Cycle Assess 17 (2): 242–251. doi:https://doi.org/10.1007/s11367-011-0352-0.
- Kellens, K., Dewulf, W., Overcash, M., Hauschild, M. Z., and J. R. Duflou. 2012b. Methodology for systematic analysis and improvementof manufacturing unit process life cycle inventory (UPLCI) CO2PE! initiative (cooperative effort on process emissions in manufacturing).Part 1: Methodology description. Inter. J. Life Cycle Assess. v. 17 (2): 242–251. https://doi.org/https://doi.org/10.1007/s11367-011-0340–4
- Kianian, B., and T. C. Larsson 2015. Additive Manufacturing Technology Potential: A Cleaner Manufacturing Alternative. In ASME 2015 International Design Engineering Technical Conferences and Computers and Information in Engineering Conference (pp. V004T05A001-V004T05A001). Am. Soc. Mech. Eng. 1-10. Boston, Massachusetts, USA.
- Kreiger, M., and J. M. Pearce. 2013. “Environmental Life Cycle Analysis of Distributed Three-Dimensional Printing and Conventional Manufacturing of Polymer Products. ACS Sustain.” Chem. Eng 1 (12): 1511–1519. doi:https://doi.org/10.1021/sc400093k.
- Kreiger, M. A., M. L. Mulder, A. G. Glover, and J. M. Pearce. 2014. “Life Cycle Analysis of Distributed Recycling of Post-consumer High Density Polyethylene for 3-D Printing Filament.” Journal of Cleaner Production 70: 90–96. doi:https://doi.org/10.1016/j.jclepro.2014.02.009.
- Laverne, F., R. Marquardt, F. Segonds, I. Koutiri, and N. Perry. 2019. “Improving Resources Consumption of Additive Manufacturing Use during Early Desgin Stages: A Case Study. Inter.” J. Of Sustain. Engin 126 (6): 365–375. https://doi.org/10.1080/19397038.2019.1620897.
- Leigh, D. K. 2012. A Comparison of Polyamide 11 Mechanical Properties between Laser Sintering and Traditional Molding. In Proceedings of the 24th solid freeform fabrication symposium, The University of Texas at Austin, Austin, TX, USA. 6–8.
- Lifset, R. 2017. “3D Printing and Industrial Ecology.” Journal of Industrial Ecology 21 (S1): S6–S8. doi:https://doi.org/10.1111/jiec.12669.
- Malshie, H., H. Nagarajan, Y. Pan, and K. Haapala 2015. Profile of Sustainability in Additive Manufacturing and Environmental Assessment of a Novel Stereolithography Process. Volume 2: Materials; Biomanufacturing; Properties, Applications and Systems; Sustainable Manufacturing. Anais … ASME, Charlotte, North Carolina, USA. in: https://doi.org/10.1115/MSEC201 5–9371.
- Mani, M., K. W. Lyons, and S. K. Gupta. 2014. “Sustainability Characterization for Additive Manufacturing.” J Res Natl Inst Stand Technol: 119: 419–428. doi:https://doi.org/10.6028/jres.119.016.
- Mellor, S., L. Hao, and D. Zhang. 2014. “Additive Manufacturing: A Framework for implementation.Inter.” International Journal of Production Economics 149: 194–201. doi:https://doi.org/10.1016/j.ijpe.2013.07.008.
- Morrow, W. R., K. H. Qi, I. Mazumder,J., and S. J. Skerlos. 2007. “Environmental Aspects of Laser-based and Conventional Tool and Die Manufacturing. J.” Clean. Prod 15 (10): 932–943. doi:https://doi.org/10.1016/j.jclepro.2005.11.030.
- Nagarajan, H. P. N., H. A. Malshe, K. Haapala, and Y. R Pan. 2016. “Environmental Performance Evaluation of a Fastmask Image Projection Stereolithography Process through Time and Energy Modeling.” J. Manuf. Sci. Engin 138 (10): 101004. doi:https://doi.org/10.1115/1.4033756.
- Nagarajan, H. P. N., and K. R. Haapala. 2018. “Characterizing the Influence of Resource-energy-exergy Factors on the Environmental Performance of Additive Manufacturing Systems.” J. Manuf. Syst 48: 87–96. doi:https://doi.org/10.1016/j.jmsy.2018.06.005.
- Niaki, M. K., and F. Nonino. 2017. “Impact of Additive Manufacturing on Business Competitiveness: A Multiple Case Study, J.” Manuf. Tech. Manag 28 (1): 56–74. doi:https://doi.org/10.1108/JMTM-01-2016-0001.
- Niaki, M. K., S. A. Torabi, and F. Nonino. 2019. “Why Manufacturers Adopt Additive Manufacturing Technologies: The Role of Sustainability.” . Journal of Cleaner Production 222: 381–392. doi:https://doi.org/10.1016/j.jclepro.2019.03.019.
- Osorio, H. G., L. R. Huerta, A. C. Ruiz, H. R. Siller, and V. Borja. 2019. “Energy Consumption Analysis for Additive Manufacturing Processes.” Int J Adv Manuf 105 (1–4): 1735–1743. doi:https://doi.org/10.1007/s00170-019-04409-3.
- Paris, H., H. Mokhtarian, E. Coatané, M. Museau, and I. Flores Ituarte I. 2016. “Comparative Environmental Impacts of Additive and Subtractive Manufacturing Technologies.” CIRP Annals 65 (1): 29–32. doi:https://doi.org/10.1016/j.cirp.2016.04.036.
- Peng, T., K. Kellens, R. Tang, C. Chen, and G. Chen. 2018. “Sustainability of Additive Manufacturing: An Overwiev on Its Energy Demand and Environmental Impact. Add.” Manuf 21: 694–704. doi:https://doi.org/10.1016/j.addma.2018.04.022.
- Prado, G. B. V. D., D. V. Silva, A. L. Christoforo, J. A. Oliveira, E. A. V. Toso, and D. A. L. Silva. 2021. “Sustainable Scheduling: Development and Application of an Integrated Method Combining NEH Heuristic and Life Cycle Assessment.” J. Int. Sustain Eng 1–15. doi:https://doi.org/10.1080/19397038.2021.1970853.
- Priarone, P. C., G. Ingarao, R. Di Lorenzo, and L. Settineri. 2016. “Influence of Material Related Aspects of Additive and Subtractive Ti-6Al-4V Manufacturing on Energy Demand and Carbon Dioxide Emissions.” J. Ind. Ecol 21 (S1): S191eS202. doi:https://doi.org/10.1111/jiec.12523.
- Rejeski, D., F. Zhao, and Y. Huang. 2018. “Research Needs and Recommendations on Environmental Implications of Additive Manufacturing.” Add. Manuf 19: 21–28. doi:https://doi.org/10.1016/j.addma.2017.10.019.
- Saade, M. R. M., A. Yahia, and B. Amor. 2020. “How Has LCA Been Applied to 3D Printing? A Systematic Literature Review and Recommendations for Futures Studies.” J. Clean. Prod 244: 118803. doi:https://doi.org/10.1016/j.jclepro.2019.118803.
- Samykano, M., S. K. Selvamani, K. Kadirgama, W. K. Ngui, G. Kanagaraj, and K. Sudhakar. 2019. “Mechanical Property of FDM Printed ABS: Influence of Printing Parameters. Inter.” J. Adv. Manuf. Techn 102 (9–12): 2779–2796. doi:https://doi.org/10.1007/s00170-019-03313-0.
- Schiermeier, Q. 2011. Increased Flood Risk Linked to Global Warming. Nature 470: 316. https://doi.org/https://doi.org/10.1038/470316a.
- Senyana, L., and D. Cormier. 2014. “An Environmental Impact Comparison of Distributed and Centralized Manufacturing Scenarios.” Adv. Mater. Res 875-877: 1449–1453.
- Tang, Y., K. Mak, and Y. F. Zhao. 2016. “A Framework to Reduce Product Environmental Impact through Design Optimization for Additive Manufacturing.” Journal of Cleaner Production 137: 1560–1572. doi:https://doi.org/10.1016/j.jclepro.2016.06.037.
- Thompson, M. K., G. Moroni, T. Vaneker, G. Fadel, R. I. Campbell, I. Gibson, A. Bernard, et al. 2016. “Design for Additive Manufacturing: Trends, Opportunities, Considerations, and Constraints, CIRP Ann.” Manuf.Technol 65 (2): 737–760.
- Wheeler, T., and J. Von Braun. 2013. “Climate Change Impacts on Global Food Security.” Science 341 (6145): 508–513. doi:https://doi.org/10.1126/science.1239402.
- Yoon, H.-S., J.-Y. Lee, H.-S. Kim, M.-S. Kim, E.-S. Kim, Y.-J. Shin, W.-S. Chu, and A. S.-H. Ahn. 2014. “A Comparison of Energy Consumption in Bulk Forming, Subtractive, and Additive Processes: Review and Case Study. Inter.” J. Precis. Eng. Manuf. Green Technol 1 (3): 261–279. doi:https://doi.org/10.1007/s40684-014-0033-0.