
Abstract
Host cell protein (HCP) impurities are generated by the host organism during the production of therapeutic recombinant proteins, and are difficult to remove completely. Though commonly present in small quantities, if levels are not controlled, HCPs can potentially reduce drug efficacy and cause adverse patient reactions. A high resolution approach for thorough HCP characterization of therapeutic monoclonal antibodies is presented herein. In this method, antibody samples are first depleted via affinity enrichment (e.g., Protein A, Protein L) using milligram quantities of material. The HCP-containing flow-through is then enzymatically digested, analyzed using nano-UPLC-MS/MS, and proteins are identified through database searching. Nearly 700 HCPs were identified from samples with very low total HCP levels (< 1 ppm to ∼10 ppm) using this method. Quantitation of individual HCPs was performed using normalized spectral counting as the number of peptide spectrum matches (PSMs) per protein is proportional to protein abundance. Multivariate analysis tools were utilized to assess similarities between HCP profiles by: 1) quantifying overlaps between HCP identities; and 2) comparing correlations between individual protein abundances as calculated by spectral counts. Clustering analysis using these measures of dissimilarity between HCP profiles enabled high resolution differentiation of commercial grade monoclonal antibody samples generated from different cell lines, cell culture, and purification processes.
Abbreviations
| HCP | = | host cell protein |
| ELISA | = | enzyme-linked immunosorbent assay |
| CGO | = | Chinese hamster ovary |
| MS | = | mass spectrometry |
| MS/MS | = | tandem mass spectrometry |
| LC | = | liquid chromatography |
| UPLC | = | ultra performance liquid chromatography |
| mAb | = | monoclonal antibody |
| PSM | = | peptide spectral match |
| CID | = | collision induced dissociation |
| HCD | = | higher-energy collisional dissociation |
| NSAF | = | normalized spectral abundance factor |
| APEX | = | absolute protein expression profiling |
| API | = | protein abundance index |
| AGC | = | automated gain control |
| NCE | = | normalized collision energy |
| FDR | = | false discovery rate |
| PBS | = | phosphate buffered saline |
Introduction
Therapeutic proteins are most often produced recombinantly in host organisms such as Chinese hamster ovary (CHO), murine, and E. coli cells, and are subsequently purified from background host cell proteins (HCPs) and other cell components to generate a final drug product. Even with the employment of multistep purification processes, HCPs are difficult to remove completely, and if levels are not controlled, can potentially reduce drug efficacy or cause adverse patient reactions.Citation1,2 While the Food and Drug Administration has not set absolute control limits,Citation1 most approved biologics have low levels of total HCP (range ∼1 – 100 ppm).Citation3 Therefore, it is imperative to have sensitive and accurate methodologies that allow for a thorough characterization of HCP present in drug product.
Enzyme-linked immunosorbent assay (ELISA) is the most commonly employed method for HCP quantitation, and it typically yields a measurement in ppm for total HCP. The antibodies used for ELISA are created by injecting an animal, often a goat, with a null host cell line (i.e., the cell line used to produce the protein therapeutic, but without the actual drug DNA). The resulting antibodies are then purified from the animal, and used in the ELISA assay to bind and quantitate residual HCPs. However, there are many shortcomings to the ELISA methodology. Since ELISA yields only a global measurement of HCP, drug products with the same total HCP content as measured by ELISA may have substantially different HCP profiles. Furthermore, the antibodies generated for ELISA do not cover all possible HCPs, thus affecting the quantitation accuracy of host cell proteins.
As an alternative, mass spectrometry (MS)-based methodologies have recently shown great promise for HCP characterization.Citation4-19 In this methodology, proteins are first digested enzymatically. The resulting peptides are then separated (usually by liquid chromatography), and subsequently detected by mass/charge via a mass spectrometer. Peptides are also concurrently fragmented in the MS to yield more detection specificity, a process termed “tandem mass spectrometry” or “MS/MS.” Peptides, and thus their protein counterparts, are identified by matching the experimental MS/MS patterns with theoretical patterns generated from a protein database, which contains all protein sequences suspected to be present in a given sample. This type of mass spectrometry-based workflow solves many of the shortcomings of traditional ELISA because individual HCPs can be identified and quantified, and potentially all HCPs can be characterized in a given sample, not just ones that can be captured by an antibody.
To date, the most common liquid chromatography (LC)-MS/MS strategy employed for HCP characterization uses a 2-dimensional LC setup capable of characterizing both the active protein therapeutic and its host cell impurities simultaneously.Citation4-6,11,14 Since HCPs are several orders of magnitude lower in concentration compared to the protein therapeutic, 2-dimensional LC separation helps increase the sensitivity of HCP detection. HCP quantitation is then achieved typically by spiking in one or more protein standards at known concentrations.Citation4-6,11,20 While these methodologies have substantially increased the depth of HCP characterization, often no proteins (or very few) are detected in final, commercial-grade drug products. Another problem is that the protein standards used will likely have different response factors in the mass spectrometer compared to that of host cell impurities, thus confounding quantitation of specific HCP. Other LC-MS/MS-based techniques have sought to first enrich the HCP population in an attempt to increase the number of host cell protein identifications. Several techniques such as immunoprecipitation,Citation10 Protein A enrichment,Citation14 and combinatorial ligand librariesCitation21 have shown great promise for enriching HCPs; however, the numbers of protein impurities detected were still very low, unless a substantial amount of protein impurities were present in the samples being analyzed (i.e., levels typically observed in the beginning of purification processes). While substantial advances have been made in improving HCP analysis, due to the shortcomings in current methodologies as just described, there is still a great need for alternative techniques to improve HCP characterization.
The successes of phosphoproteomics research served as our motivation for enriching low level HCPs from drug product. The main hurdle in identifying and quantifying large numbers of phosphopeptides is their low cellular expression levels; an additional problem is that they are phosphorylated at very low stoichiometric amounts.Citation22 Therefore, enrichment of phosphopeptides is a key step in any phosphoproteomic workflow. Beginning the enrichment with a sufficient amount of starting material is one of the most critical steps for maximizing the number of phosphopeptides identified – greater than or equal to 15 mg of cells works best.Citation22 Thousands of phosphopeptides can be identified when adequate material is enriched.Citation22
Here, we present methodology capable of routinely identifying and quantifying up to nearly 700 HCPs in commercial grade monoclonal antibodies that contain very low levels of total HCP (< 1 ppm to ∼10 ppm) by depleting full dosage amounts (typically 40 – 100 mg) of drug product using various affinity depletions (e.g., Protein A, Protein L). Compared to previous methods that use significantly less drug material, the level of HCPs detected by the method described here are similar to the levels to which patients might be exposed. Furthermore, the increased number of protein identifications allows for direct, label-free quantitation of individual protein impurities via spectral counting, and rigorous multivariate analysis offers superior analytical resolution, as demonstrated in this study, by assessing biologics expressed in various cell lines, media conditions, and purified by different downstream processes. Our combination of increased HCP detection, streamlined quantitation, and comprehensive multivariate analysis provides a notable step toward the total characterization of HCPs present in commercial grade biotherapeutics.
Results
The schematic diagram of the experimental workflow can be seen in . This methodology was capable of detecting ∼100 times more HCPs in drug product samples with low starting HCP concentrations (<10 ppm range or approximately 6 orders of magnitude lower than the drug substance) as compared to other LC-MS-based HCP methods reported in the literature (). Since several hundreds of proteins can be identified for each sample, large numbers of peptide spectrum matches (often several hundred) are collected for each individual protein, which allows for accurate relative quantitation of distinct HCPs across samples via spectral counting, a simple and accurate label-free quantitation method.Citation23-31 The identification of large numbers of proteins per sample also enabled multivariate statistical analysis, which like spectral counting, relies on large numbers of data points to yield reliable results. Since many samples, generated from a variety of different cell lines and processes, were analyzed in this study, a streamlined nomenclature was adopted for sample differentiation. Therefore, each sample was given a number in the format of “ABC.D” where A is either 1 or 2 representing which therapeutic (mAb1 and mAb2, respectively) was produced, B is the specific CHO cell line used and can be a single digit number, C is the upstream/downstream process and can also be a single digit number, and D is an arbitrary lot number. For convenience, a description of each sample analyzed in this study and its associated nomenclature can also be seen in Table S1.
Figure 1. Schematic diagram of the experimental workflow.
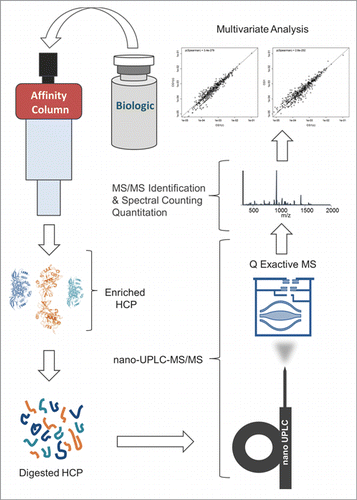
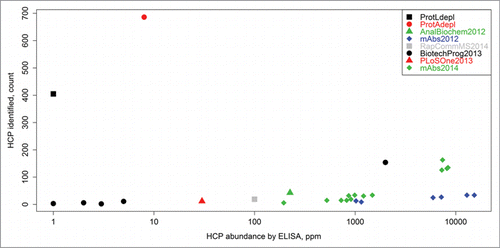
Figure 2. Counts of HCP identities versus total HCP content (ppm measurement by ELISA) as reported herein, as well as in previous LC-MS-based HCP studies. The previous works are labeled as follows: AnalBiochem2012,Citation5 mAbs2012,Citation11 RapCommMS2014,Citation14 BiotechProg2013,Citation4 PLoSOne2013,Citation10 and mAbs2014.Citation6 “ProtAdepl” and “ProtLdepl” represent the highest counts of HCPs identified in this report by either Protein A or Protein L depletion, respectively. The methodology presented in this article was able to detect ∼100 times more HCPs compared to other techniques that analyzed samples with low starting HCP concentrations (< 10 ppm range).
The effect affinity depletions play on CHO proteins
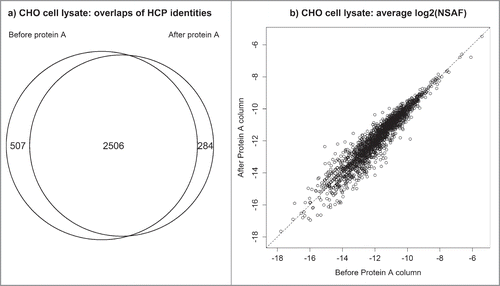
The abundances of certain host cell proteins could potentially be underrepresented by binding to the affinity resin during the depletion step (enrichment of HCPs). Therefore, two experiments were performed to assess how the depletion step affects HCP profiles. In the first investigation, protein abundances in a null CHO cell lysate were compared before and after affinity depletion by Protein A. As seen in , a substantial fraction of proteins were recovered in both samples and their abundances are strongly correlated indicating that their relative abundances after affinity depletion are highly indicative of their relative abundances prior to depletion. Over 90% of the proteins detected after depletion were also identified from the same sample that did not go through a depletion step. Furthermore, the proteins unique to each type of sample (i.e., depleted versus undepleted) were generally of very low abundance where the method is most variable (Fig. S1). In the second experiment, HCP profiles were assessed by depleting a biotherapeutic sample by both Protein A and Protein L. Each column has unique purification specificity and can shed light onto whether the depletion strategy significantly alters the makeup of the HCP pool. Protein A binds the heavy chain in Fc, and Protein L binds kappa light chains in the Fab region. Figure S2 and Figure S3 illustrate that both Protein A and Protein L yield very comparable HCP profiles with respect to the overlap of identified proteins and their associated abundances.
Figure 3. CHO cell lysate before and after Protein A depletion: (a) overlap of identified CHO proteins (b) correlation between abundances of individual HCPs detected in both samples.
Performance of characterization workflow
To test the reproducibility of the method, we analyzed four lots of commercial grade mAb1 (produced using the same cell line, upstream process, and downstream process) that had total host cell protein concentrations of approximately 8 ppm as identified by ELISA. The samples tested for reproducibility were labeled as 111.2, 111.3, 111.4, and 111.5. The number of protein impurities identified per sample after Protein A depletion of 40 mg of therapeutic protein followed by LC-MS/MS ranged from 632 to 686. For each pairwise combination of resulting HCP profiles (in total, six pairs for the four lots analyzed), the values for overlap of HCPs (quantified by Jaccard distance) and protein abundance correlation (as calculated by Spearman correlation) are listed in Table S2, which also conveniently contains all other pairwise combinations assessed in this study. Venn diagrams and scatterplots of NSAF abundances can be seen in Figure S4 and Figure S5, respectively. The % RSD of the Jaccard distances was under 10%, and the majority of HCPs were repeatedly detected in multiple replicates of the same material (Jaccard distance ≤ 0.3). Furthermore, NSAF abundances were highly correlated (Spearman p-values well below 10−100), indicating a negligibly small probability of observing such correlations by random chance. HCP analysis of samples depleted by Protein L also yielded highly reproducible Jaccard distances and Spearman p-values as shown in Supplemental Materials.
Since column-to-column variability can add significant error to analytical techniques, the reproducibility of the method was assessed when different depletion and analytical columns were used. The HCP profile of 111.5 was compared to the same lot analyzed on a different EASY-Spray nano column (labeled 111.5r) as well as a different affinity depletion column (labeled 111.5c). The overlap of HCPs and their protein abundance correlation between all three conditions were calculated as seen in Table S2 and Figure S6. In addition to evaluating different columns, variability of the method when using two different mass spectrometers was also evaluated by analyzing one drug product lot on a Q Exactive (111.3) and on an Orbitrap Velos Pro (111.3v) mass spectrometer. Data-dependent acquisition was performed in “high-low” mode for the Orbitrap Velos Pro. That is, the high resolution Orbitrap was used for detection of intact peptides while MS/MS spectra were collected via collision-induced dissociation (CID) in the low resolution Velos ion trap. For the Q Exactive, in contrast, both MS and MS/MS spectra were collected in the high resolution Orbitrap. Additionally, a different MS/MS technique, higher-energy collisional dissociation (HCD) was used on the Q Exactive for peptide fragmentation. This experiment represents a worst-case scenario with respect to instrument-to-instrument variability. The overlap of HCPs and their protein abundance correlation were calculated and can be seen in Table S2 and Figure S7. The pairwise comparisons with respect to changes in both columns and mass spectrometers illustrates that the method described herein is adequately rugged for its intended purpose as the majority of HCPs, as indicated by Jaccard distances, were repeatedly detected in multiple lots of material (Jaccard distances ≤ 0.39 ). Furthermore, NSAF abundances were highly correlated (Spearman P-values ≤ 4.8*10−160), indicating vanishingly small probabilities of such correlations to be encountered by random chance. The values are similar to, or better than those reported for the precision experiment as shown in the previous section.
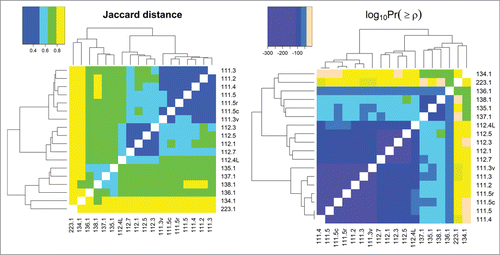
Since the presence of HCPs and their abundance can be affected significantly by cell line type, upstream processes, and downstream purification, several samples with different cell lines and processing were analyzed. shows heat maps of Jaccard distances and statistical significances of Spearman correlations of pairwise comparisons for many different samples of mAb1 expressed in different cell lines, upstream processes, and downstream purification as well as for samples described previously in the repeatability and ruggedness experiments. Pairwise comparisons that have darker shades of purple have larger HCP overlap (as seen in the Jaccard distance heat map) and are more significantly correlated with respect to individual protein abundances (as seen in the log10Pr(≥ρ) heat map); those that are more peach-colored have less overlap and are less correlated. Samples originating from the same expression system and processes are labeled per the nomenclature described in detail earlier, and exhibit a very high degree of overlap and correlation similar to what was observed in the precision and ruggedness experiments previously described. It is worth noting that while samples 135.1, 137.1, and 138.1 are labeled denoting that a different process was used for each sample, the only actual difference between them are minor upstream media alterations, and therefore it is not surprising that their HCP profiles are highly correlated. Conversely, when samples from significantly different processes are compared, less overlap and correlation is observed. The degrees of difference in the HCP profiles are a result of how dissimilar the cell line and processes were for each pairwise comparison. For example, 111.5 and 112.5 were generated from the same cell line and upstream process, but with a slightly different downstream process, and resulted in a Jaccard distance and Spearman p-value of 0.59 and 1.3*10−64. The pairwise comparison of samples 111.5 and 134.1 (same mAb1 antibody produced in different cell lines and upstream/downstream processes) yielded values of 0.92 and 0.051 for Jaccard distance and Spearman correlation p-value, respectively, indicating greater dissimilarity between their HCP profiles. As stated previously, all values of Jaccard distance and statistical significance of Spearman correlation coefficients are listed in Table S2. These examples show how even small changes in process development can be differentiated readily with our analysis workflow.
Figure 4. Jaccard distances and log base 10 of statistical significances of Spearman correlations between all samples analyzed in this study. Pairwise comparisons that have darker shades of purple have more HCP overlap (as seen in the Jaccard distance heat map) and are more significantly correlated with respect to individual protein abundances (as seen in the log10Pr(≥ρ) heat map); those that are more peach-colored, have less overlap and are less correlated, respectively.
As seen in , one of the samples that had the least overlap and protein abundance correlation compared to all other samples was 223.1, which consisted of a different therapeutic protein (mAb2) as well as a different cell line and process development procedure. Interestingly, 223.1 had total HCP levels below the limit of quantitation for the mAb2 drug product ELISA method (less than 2 ppm). The affinity depletion and mass spectrometry-based workflow described herein, however, was still able to detect over 400 protein impurities, an impressive number with such a low total quantity of HCP. For this sample, 100 mg of mAb2 was depleted by Protein L before LC-MS/MS analysis. Figure S8 shows the comparison of HCP profiles for drug product lot 111.5 to a few selected examples (including lot 223.1) that are expected to be very similar and increasingly dissimilar. This simplified representation of the data further illustrates the sensitivity of the methodology for discriminating HCP profiles from different protein therapeutics, cell lines, and processes used to produce drug product.
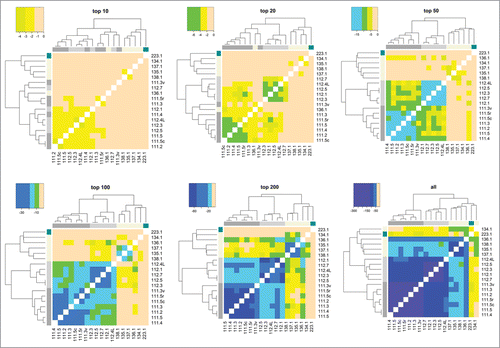
Maximizing resolution between samples with different cell lines or purification processes
To gain better insight into the benefits of detecting more host cell proteins in final drug product samples, illustrates HCP profile comparisons when all samples analyzed in this study were filtered so that only a specified number of the most abundant HCPs were considered for multivariate analysis. That is, only the top 10, top 20, top 50, top 100, and top 200 were used. Results of the comparisons of these filtered samples can be then further contrasted to those that have been obtained using entire sets of HCPs detected in each sample. The same coloring scheme was used in as that in . For the heat maps that had all but the top 10 and top 20 most abundant HCPs filtered out, samples with significantly different cell lines and upstream/downstream processes could not be differentiated. While the top 50, top 100, and top 200 heat maps exhibited increasingly better resolution for differentiating samples, the clustering analysis that utilized all HCPs provided the most striking correlations for samples that were the most similar, and the most differentiation for those that originate from different therapeutic proteins, cell lines, and processes. Furthermore, Figure S9 shows results of multidimensional scaling of dissimilarity between 111 and 112 samples when utilizing the top 20, top 100, and all detected HCPs. By this measure, sample differentiation is also substantially more striking when more HCPs are considered. These results illustrate how detecting more HCPs significantly increases analytical resolution, thus enabling unambiguous distinction of samples generated by a variety of different processes.
Figure 5. Illustration of how method resolution increases with increasing number of HCPs detected (using Spearman correlation).
Comparison of drug product HCPs to null CHO cell lysate
As a final comparison, the drug product HCP profiles described above were compared to the null CHO cell lysate protein identities and NSAF abundances presented in . The overlap between protein identities and correlation between NSAF abundances are shown in Figure S10. Further technical details can be found in Supplemental Materials.
Overlaps between protein identities detected in the null CHO cell lysate and each of the HCP profiles are plotted in Figure S10a. With the exception of 223.1, which had over 80% overlap, all other profiles had between 60% and 70% HCP overlap with proteins identified in the CHO cell lysate.
A quantile plot exhibiting the ranks of NSAF abundances from proteins detected only in HCP profiles was used to assess the abundances of HCPs detected in drug product, but not identified in the null CHO lysate (Figure S10b). As seen in the figure, the proteins not detected in the lysate manifest a downward deviation from the y = x diagonal, which indicates the tendency of proteins detected in HCP profiles, but not in CHO cell lysate, to be on average less abundant than a random sample of proteins detected in a drug product HCP profile. However, this trend is fairly weak. For instance, the top 10% of the most abundant drug product HCPs not detected in the CHO cell lysate correspond to the top 14% of the most abundant drug product HCPs overall, and the top 25% of the most abundant drug product HCPs not identified in the CHO cell lysate correspond to the top 30% of the most abundant drug product HCPs overall. Thus, the proteins detected in the drug product HCP profiles, but not in the CHO cell lysate, represent the entire range of HCP abundances, not just the low abundance ones.
Furthermore, a graphical comparison of the abundance ranks of the proteins detected both in HCP profiles and in CHO cell lysate indicates a statistically significant correlation between NSAF abundances of proteins in drug product HCP profiles and CHO cell lysate (Figure S10c). However, it can also be seen that a substantial fraction of proteins have appreciably different relative abundances in the CHO cell lysate vs. the HCP profiles. For instance, approximately 40% of the points in the plot have abundance ranks that are ≥ 2 times different between the CHO cell lysate and drug product HCP profiles.
Discussion
The importance of fully characterizing HCP content in final drug product was recently highlighted after two clinical trials were suspended when antibodies against CHO HCPs were detected in subjects who were administered recombinant biotherapeutics.Citation32 Furthermore, certain CHO proteins have a potentially higher risk of being immunogenic due to lower homology to human protein forms or higher T cell epitope density.Citation33 Specific CHO proteases contained within the HCP profile can also cause fragmentation of the drug substance, which can affect the storage life of recombinant biologics.Citation34 The sensitive detection and quantification of individual HCPs by LC-MS/MS-based methodologies is therefore a powerful complement to the gold-standard ELISA. For example, HCP characterization by LC-MS/MS was recently utilized to improve downstream process development after an abundant and potentially immunogenic protein was not detected by ELISA or Western blotting.Citation34
One of the main challenges of HCP analysis by LC-MS/MS is that most high resolution mass spectrometers only have a dynamic range between 3 to 4 orders of magnitude,Citation35 yet total HCP amounts in final drug product are often 6 orders of magnitude lower than the drug substance. Furthermore, the dynamic range of the LC column is also limiting as high concentrations of drug substance causes significant peak broadening, which limits the detection of the low level HCPs. By first depleting large amounts of the therapeutic protein before LC-MS/MS analysis, we were able to largely overcome these dynamic range limitations, and detect large numbers of HCPs.
The depletion of large quantities (mg) of final drug product is a key step for maximizing HCP identifications and improving the resolution between different HCP profiles. In general, we used Protein A as a depletion method for therapeutics that have not been purified by Protein A, and Protein L for those that have downstream processes that incorporate Protein A. The reasoning is that those HCPs that do make it to the final drug product may have some affinity to Protein A (if the biologic has been Protein A purified), and thus might be removed along with the therapeutic if Protein A is also used for affinity depletions to collect HCPs. Protein L does not have the same affinity as Protein A, and should effectively deplete HCPs from most Protein A purified biotherapeutics. However, our results showed that the vast majority of HCPs have no affinity to Protein A, and that Protein L and Protein A depleted material yielded highly comparable results; therefore, we don't anticipate large differences in HCP profiles by using one depletion affinity column versus another.
We used spectrum counting for quantitation because the likelihood of collecting MS/MS spectra (PSMs) for a particular peptide increases with protein abundance; therefore, the number of PSMs per protein is proportional to protein abundance. The biggest advantages of spectrum counting for quantitation are ease of implementation and simplicity. However, the accuracy of this quantitation method is best when high numbers of peptide spectrum matches (and thus proteins) are detected, which our depletion and nano-UPLC-MS/MS workflow facilitates. We used the normalized spectral abundance factor (NSAF)Citation23-31 as our spectral counting method since MS/MS data is normalized to the size of the protein (larger proteins will generate more PSMs than smaller proteins) and also to the number of peptide/protein matches, which accounts for run-to-run variation.
The detection of large numbers of proteins by our large-scale affinity depletion and LC-MS/MS strategy also assisted the use of multivariate analysis. Various metrics have been commonly used for assessing multidimensional data obtained in genomicsCitation36 and proteomicsCitation37 experiments. The differences between HCP profiles can be expressed in terms of concordance between sets of protein identities detected in each sample, as well as lower correlations between individual protein abundances found in both HCP profiles. Here, the Jaccard distance (closely related to Tanimoto distance) was applied for quantifying overlaps between sets of proteins detected in each HCP profile. Furthermore, due to its non-parametric nature, insensitivity to the monotonic transformations of the data, and existence of distribution-free estimates of statistical significance, Spearman correlation coefficients were used to compare abundances of the proteins common to any two HCP profiles. Jaccard distancesCitation38-40 and Spearman correlationsCitation41-43 have both been applied successfully to complex proteomic datasets in previous studies. We demonstrated herein that the application of these statistical tools to our host cell protein data enabled sensitive differentiation between samples (i.e., those generated from different cell lines and upstream/downstream processes).
While protein identification and quantitation based on “shotgun” proteomic methods can suffer from considerable run-to-run variability due to potential changes in peptide ionization and MS/MS peak picking, our methodology for HCP quantitation proved to be highly reproducible and a useful complement to traditional methods such as ELISA. In fact, the majority of HCPs were repeatedly detected in multiple replicates of the same material (Jaccard distance ≤ 0.3) as shown in our repeatability experiments (Table S2, Fig. S4, and Fig. S5). As expected, HCPs with the lowest abundance generally contributed the most to inconsistencies in protein identification between samples. These lower abundance HCPs, however, proved useful in differentiating HCP profiles. As shown in , the highest resolution for HCP profile differentiation occurred when all HCPs were considered, as compared to when only the top 10, top 20, top 50, top 100, and top 200 HCPs were used. Since our methodology uses a multivariate approach, the overall profile correlation is the most important factor for assessing similarity between HCP profiles, and is mostly indifferent to small differences in protein identifications at the low end of the profile. This multivariate approach provides a signature of the overall process and can detect elusive process differences, which can be particularly useful for assessing batch-to-batch repeatability and process scale-up.
Several recent studies have used mass spectrometry-based proteomics to characterize null CHO cell lysates or cell culture to assess differences in protein expression across various cell lines and process conditions.Citation13,18,44-47 Therefore, we were interested in evaluating the comprehensive HCP profiles we obtained from final drug product (highly purified mAb samples) vs. those from a null CHO cell lysate (no recombinant product). As shown in Figure S10, this comparison assessed protein overlap, the abundance of HCPs detected solely in final drug product samples, and the abundance of HCPs common to both final drug product and the null CHO cell lysate. Overall, the two profiles had substantial overlap between protein identifications, and the higher abundance proteins in the null CHO cell lysate tended to have higher abundance in the drug product profiles. However, certain drug product HCP profiles had up to 40% unique proteins that were not detected in the null CHO cell lysate, many of which were highly abundant in the drug product HCP profile. Furthermore, for the proteins that were common to both the drug product profile and null CHO lysate, a substantial fraction had appreciably different relative abundances between the two profiles. These results suggest that, while final drug product HCP profiles are influenced by the innate identities and abundances of the host cell, many important differences exist. Given the findings herein plus recent results that showed high similarity between proteomic profiles of different null CHO cell lines and upstream processes,Citation44 variations in downstream processes are likely the primary cause of the significant differences we observed for final drug product HCP profiles as certain proteins will be more effectively purified than others (depending on the downstream process employed).
It has been stated recently that residual HCPs that make it into final drug product would likely consist of a small subgroup of the most highly abundant host cell proteins.Citation6 However, by using the analysis workflow described herein, our data shows that even though commercial grade biologics go through extensive multi-step purification processes, a large number of HCPs (albeit low abundant) can still be present in the final drug product. Furthermore, the most abundant host cell proteins only represent a small portion of the total HCP abundance. These results demonstrate the utility of high resolution analytics for thorough characterization of HCP content in commercial grade biotherapeutics.
In conclusion, we presented methodology that significantly increases HCP detection, simplifies quantitation, and provides comprehensive multivariate analysis that is capable of differentiating HCP profiles from drug product samples with very low total protein impurities (less than 1 ppm to approximately 10 ppm). This approach could further be extended to the absolute quantitation of each individual host cell protein. Several MS/MS-based spectral counting methodologies such as absolute protein expression profiling (APEX)Citation48-50 and protein abundance index (API)Citation51,52 have been used successfully for proteomics-scale absolute quantitation of individual proteins, and should be directly applicable to our HCP methodology.
Materials and Methods
Materials and reagents
Commercial grade therapeutic monoclonal antibodies (mAb1 and mAb2) were produced in CHO cells under a variety of conditions. Trypsin Gold was purchased from Promega (Madison, WI). All other solvents, reagents, and lab supplies were obtained from Fisher Scientific (Pittsburg, Pa).
Protein preparation and nano-UPLC-MS/MS analysis
Therapeutic protein samples were depleted via affinity enrichment (e.g., Protein A, Protein L) using an ÄKTA system coupled with 5 mL HiTrap columns (GE Life Sciences, Pittsburg, PA). The flow rate was 2 ml/min, the loading buffer consisted of 50 mM sodium phosphate, 500 mM sodium chloride, pH 7.5, and the elution buffer was 100 mM Glycine, 150 mM sodium chloride, pH 2.5. The HCP-containing flow-through was then buffer exchanged into 50 mM ammonium acetate using 3K MWCO Amicon filters (EMD Millipore, Billerica, MA), and dried using a speed vac. Dried samples were reconstituted in 6 M guanidine HCL in 1x phosphate-buffered saline (PBS), reduced with 10 mM dithiothreitol for 30 minutes at 50°C, and alkylated with 19 mM iodoacetamide for one hour in the dark. Samples were then buffer exchanged into 100 mM ammonium bicarbonate, and digested with 2 µg of trypsin for one hour in a Barocycler (Pressure Biosciences, South Easton, MA) operated at 20,000 psi. The trypsin reaction was quenched by the addition of 2% formic acid.
The prepared tryptic peptides were analyzed using nano-UPLC-MS/MS. Samples were directly injected onto an EASY-Spray C18 column (Thermo Scientific, Waltham, MA) (75 μm ID × 25 cm, 2 µm particle size) at a volume of 1 µL. The column was heated to 50°C during analysis. Separation was performed on a Dionex Ultimate 3000 RSLCnano (Santa Clara, CA) system with eluent A consisting of 0.1% formic acid in water and eluent B consisting of 0.1% formic acid in acetonitrile with a 200 min linear gradient from 2% to 35% eluent B at a flow rate of 300 nL/min.
Mass spectrometric analysis was performed on a Thermo Scientific Q Exactive mass spectrometer (Bremen, Germany). Data-dependent MS/MS was performed as follows: the first event was the survey positive mass scan (m/z range of 400 – 2000) followed by 12 HCD events (25% NCE) on the 12 most abundant ions from the first event. Ions were generated using a spray voltage of 1.7 kV, a capillary temperature of 250°C, and a S-Lens RF level of 70. Resolution was set at 35,000 (AGC target of 1E6) and 17,500 (AGC target of 2E5) for survey scans and MS/MS events, respectively. The maximum ion injection time was 250 ms for all scans. A dynamic exclusion duration of 30 s was used with a single repeat count. All spectra were the average of one microscan. Two technical replicates were run per sample.
To assess robustness, a Thermo Scientific Orbitrap Velos Pro mass spectrometer (Bremen, Germany) was used as a comparison to the Q Exactive. Data-dependent MS/MS was performed as follows for the Orbitrap Velos Pro: the first event was a 30,000 resolution positive mass scan (m/z range of 300 – 1400) followed by 24 low resolution CID events (35% NCE) on the 24 most abundant ions from the first event. Ions were generated using a spray voltage of 1.8 kV and a capillary temperature of 275 °C. AGC was set at 1E6 and 5E4 for orbitrap survey scans and MS/MS events, respectively, and 3E4 and 1E4 for ion trap survey scans and MS/MS events, respectively. The maximum ion injection time was 50 and 100 ms for the full mass scans and MS/MS scans, respectively. A dynamic exclusion duration of 20 s was used with a single repeat count.
Protein identification and quantification
A customized protein database composed of sequences from the CHO-K1 protein database (downloaded 09/24/2012 from http://www.chogenome.org),Citation53,54 protein biotherapeutics, affinity proteins (e.g., Protein A, Protein L), digestion enzyme(s), and human keratin was used to search against the experimental MS/MS data using the Proteome Discoverer software package, version 1.4 (Thermo Scientific, Bremen, Germany). Both SEQUEST Citation55 and Mascot Citation56 were used in tandem for database searching. A mass tolerance of 10 ppm and 0.1 Da were used for precursor and fragment masses, respectively. Carbamidomethyl of cysteine was set as a fixed modification, and up to two missed cleavages were allowed. After searching, Percolator Citation57 was used to filter peptide hits with a strict false discovery rate (FDR) ≤ 1%. Further peptide/protein filtering was performed by eliminating peptides that had less than six amino acids, and all single spectrum protein hits.
The protein and peptide identifications from two technical replicates were combined for each sample, and spectral counting was then used for the relative quantitation of individual proteins. Peptide spectral matches (PSMs) were normalized to protein molecular weight (spectral abundance factor) as larger proteins are more likely to produce an increased number of PSMs. The spectral abundance factors were further normalized (normalized spectral abundance factor) so that individual proteins were comparable in multiple data sets with varying numbers of total proteins. The normalized spectral abundance factor (NSAF) values were used to calculate relative abundance of individual proteins. Citation23-31 The NSAF values for the antibody, trypsin, and Protein A/L were not used for multivariate analysis as described in subsequent sections and in the Supplementary Materials.
Total HCP concentration (in ppm) was measured by the CHO HCP ELISA kit, 3G (Cygnus Technologies, Southport, NC).
Multivariate analysis
Differences between HCP profiles for multiple samples were evaluated by a) quantifying the number of protein identities common among profiles using Jaccard distances (1 - Jaccard index) and by b) comparing HCP abundances, as estimated by NSAF, for the proteins common between profiles (using Spearman correlation coefficient ρ and its statistical significance ps = Pr(≥ρ)). All comparisons of HCP profiles were performed in the R programming language.Citation58 Details of the calculations used herein can be found in the multivariate analysis sections in Supplementary Material.
Null CHO cell line analysis
A null CHO cell line was grown to 5 million cells, pelleted, and washed. The cell pellet was then resuspended with 6 M guanidine HCL in 1x PBS and lysed by probe sonication. The cell lysate was buffer exchanged into 50 mM sodium phosphate, 500 mM sodium chloride, pH 7.5. The sample (90 µL) was then passed over a Protein A HP Spin column (GE Life Sciences, Pittsburg, PA) at 100 x g for 30 seconds, and was subsequently washed and collected. Another lysate portion was treated the same but without being passed over the Protein A column. Both samples were then reduced, alkylated, digested, and analyzed as described above. Two technical replicates were analyzed per condition.
Disclosure of Potential Conflict of Interest
All authors are employees of Momenta Pharmaceuticals with stock compensation.
Supplemental Material
Supplemental data for this article can be accessed on the publisher's website.
Supplemental_Material.pdf
Download PDF (661.8 KB)Acknowledgments
We thank Elizabeth Heilig and Megha Kapur (Momenta Pharmaceuticals) for discussions concerning HCP quantitation by ELISA, and for producing the null CHO cells, respectively.
References
- Wang X, Hunter AK, Mozier NM. Host cell proteins in biologics development: identification, quantitation and risk assessment. Biotechnol Bioeng 2009; 103:446-58; PMID:19388135; http://dx.doi.org/10.1002/bit.22304
- Tscheliessnig AL, Konrath J, Bates R, Jungbauer A. Host cell protein analysis in therapeutic protein bioprocessing - methods and applications. Biotechnol J 2013; 8:655-70; PMID:23436780; http://dx.doi.org/10.1002/biot.201200018
- Champion K, Madden H, Dougherty J, Shacter E. Defining your product profile and maintaining control over it, part 2: challenges of monitoring host cell protein impurities. BioProcess Int 2005; 3:52-4 , 6, 8
- Schenauer MR, Flynn GC, Goetze AM. Profiling the effects of process changes on residual host cell proteins in biotherapeutics by mass spectrometry. Biotechnol Prog 2013; 29:951-7; PMID:23696295; http://dx.doi.org/10.1002/btpr.1748
- Schenauer MR, Flynn GC, Goetze AM. Identification and quantification of host cell protein impurities in biotherapeutics using mass spectrometry. Anal Biochem 2012; 428:150-7; PMID:22640604; http://dx.doi.org/10.1016/j.ab.2012.05.018
- Zhang Q, Goetze AM, Flynn GC, Cui H, Wylie J, Hewig A, Flynn GC. Comprehensive tracking of host cell proteins during monoclonal antibody purifications using mass spectrometry. MAbs 2014; 6:659-70; PMID:24518299; http://dx.doi.org/10.4161/mabs.28120
- Reisinger V, Toll H, Mayer RE, Visser J, Wolschin F. A mass spectrometry-based approach to host cell protein identification and its application in a comparability exercise. Anal Biochem 2014; 463:1-6; PMID:24949901; http://dx.doi.org/10.1016/j.ab.2014.06.005
- Zhu G, Sun L, Linkous T, Kernaghan D, McGivney JBIV, Dovichi NJ. Absolute quantitation of host cell proteins in recombinant human monoclonal antibodies with an automated CZE-ESI-MS/MS system. Electrophoresis 2014; 35:1448-52; PMID:24615994; http://dx.doi.org/10.1002/elps.201300545
- Zhu G, Sun L, Wojcik R, Kernaghan D, McGivney JBIV, Dovichi NJ. A rapid cIEF-ESI-MS/MS method for host cell protein analysis of a recombinant human monoclonal antibody. Talanta 2012; 98:253-6; PMID:22939156; http://dx.doi.org/10.1016/j.talanta.2012.07.017
- Bomans K, Lang A, Roedl V, Adolf L, Kyriosoglou K, Diepold K, Eberl G, Mølhøj M, Strauss U, Schmalz C, et al. Identification and monitoring of host cell proteins by mass spectrometry combined with high performance immunochemistry testing. PLoS One 2013; 8:e81639/1-e/11; PMID:24312330; http://dx.doi.org/10.1371/journal.pone.0081639
- Doneanu CE, Xenopoulos A, Fadgen K, Murphy J, Skilton SJ, Prentice H, Stapels M, Chen W. Analysis of host-cell proteins in biotherapeutic proteins by comprehensive online two-dimensional liquid chromatography/mass spectrometry. MAbs 2012; 4:24-44; PMID:22327428; http://dx.doi.org/10.4161/mabs.4.1.18748
- Joucla G, Le Senechal C, Begorre M, Garbay B, Santarelli X, Cabanne C. Cation exchange versus multimodal cation exchange resins for antibody capture from CHO supernatants: Identification of contaminating Host Cell Proteins by mass spectrometry. J Chromatogr B: Anal Technol Biomed Life Sci 2013; 942-943:126-33; http://dx.doi.org/10.1016/j.jchromb.2013.10.033
- Levy NE, Valente KN, Choe LH, Lee KH, Lenhoff AM. Identification and characterization of host cell protein product-associated impurities in monoclonal antibody bioprocessing. Biotechnol Bioeng 2014; 111:904-12; PMID:24254318; http://dx.doi.org/10.1002/bit.25158
- Thompson JH, Chung WK, Zhu M, Tie L, Lu Y, Aboulaich N, Strouse R, Mo WD. Improved detection of host cell proteins (HCPs) in a mammalian cell-derived antibody drug using liquid chromatography/mass spectrometry in conjunction with an HCP-enrichment strategy. Rapid Commun Mass Spectrom 2014; 28:855-60; PMID:24623688; http://dx.doi.org/10.1002/rcm.6854
- Valente KN, Schaefer AK, Kempton HR, Lenhoff AM, Lee KH. Recovery of Chinese hamster ovary host cell proteins for proteomic analysis. Biotechnol J 2014; 9:87-99; PMID:24039059; http://dx.doi.org/10.1002/biot.201300190
- Hunter AK, Wang X, Suda EJ, Herberg JT, Shell RE, Thomas KE, Dufield RL, Gustafson ME, Mozier NM, Ho SV. Separation of product associating E. coli host cell proteins OppA and DppA from recombinant apolipoprotein A-Imilano in an industrial HIC unit operation. Biotechnol Prog 2009; 25:446-53; PMID:19291803; http://dx.doi.org/10.1002/btpr.106
- Wierling PS, Bogumil R, Knieps-Gruenhagen E, Hubbuch J. High-throughput screening of packed-bed chromatography coupled with SELDI-TOF MS analysis: monoclonal antibodies versus host cell protein. Biotechnol Bioeng 2007; 98:440-50; PMID:17335062; http://dx.doi.org/10.1002/bit.21399
- Tait AS, Hogwood CEM, Smales CM, Bracewell DG. Host cell protein dynamics in the supernatant of a mAb producing CHO cell line. Biotechnol Bioeng 2012; 109:971-82; PMID:22124969; http://dx.doi.org/10.1002/bit.24383
- Aboulaich N, Chung WK, Thompson JH, Larkin C, Robbins D, Zhu M. A novel approach to monitor clearance of host cell proteins associated with monoclonal antibodies. Biotechnol Prog 2014; 30:1114-24; PMID:25044920; http://dx.doi.org/10.1002/btpr.1948
- Silva JC, Gorenstein MV, Li G-z, Vissers JPC, Geromanos SJ. Absolute quantification of proteins by LCMS. A virtue of parallel MS acquisition. Mol Cell Proteomics 2006; 5:144-56; PMID:16219938; http://dx.doi.org/10.1074/mcp.M500230-MCP200
- Fortis F, Guerrier L, Areces LB, Antonioli P, Hayes T, Carrick K, Hammond D, Boschetti E, Righetti PG. A new approach for the detection and identification of protein impurities using combinatorial solid phase ligand libraries. J Proteome Res 2006; 5:2577-85; PMID:17022629; http://dx.doi.org/10.1021/pr060090s
- Villen J, Gygi SP. The SCX/IMAC enrichment approach for global phosphorylation analysis by mass spectrometry. Nat Protoc 2008; 3:1630-8; PMID:18833199; http://dx.doi.org/10.1038/nprot.2008.150
- Old WM, Meyer-Arendt K, Aveline-Wolf L, Pierce KG, Mendoza A, Sevinsky JR, Resing KA, Ahn NG. Comparison of label-free methods for quantifying human proteins by shotgun proteomics. Mol Cell Proteomics 2005; 4:1487-502; PMID:15979981; http://dx.doi.org/10.1074/mcp.M500084-MCP200
- Blondeau F, Ritter B, Allaire PD, Wasiak S, Girard M, Hussain NK, Angers A, Legendre-Guillemin V, Roy L, Boismenu D, et al. Tandem MS analysis of brain clathrin-coated vesicles reveals their critical involvement in synaptic vesicle recycling. Proc Natl Acad Sci U S A 2004; 101:3833-8; PMID:15007177; http://dx.doi.org/10.1073/pnas.0308186101
- Girard M, Allaire PD, McPherson PS, Blondeau F. Non-stoichiometric relationship between clathrin heavy and light chains revealed by quantitative comparative proteomics of clathrin-coated vesicles from brain and liver. Mol Cell Proteomics 2005; 4:1145-54; PMID:15933375; http://dx.doi.org/10.1074/mcp.M500043-MCP200
- Powell DW, Weaver CM, Jennings JL, McAfee KJ, He Y, Weil PA, Link AJ. Cluster analysis of mass spectrometry data reveals a novel component of SAGA. Mol Cell Biol 2004; 24:7249-59; PMID:15282323; http://dx.doi.org/10.1128/MCB.24.16.7249-7259.2004
- Liu H, Sadygov RG, Yates JR, III. A model for random sampling and estimation of relative protein abundance in shotgun proteomics. Anal Chem 2004; 76:4193-201; PMID:15253663; http://dx.doi.org/10.1021/ac0498563
- Zybailov B, Coleman MK, Florens L, Washburn MP. Correlation of relative abundance ratios derived from peptide ion chromatograms and spectrum counting for quantitative proteomic analysis using stable isotope labeling. Anal Chem 2005; 77:6218-24; PMID:16194081; http://dx.doi.org/10.1021/ac050846r
- Paoletti AC, Parmely TJ, Tomomori-Sato C, Sato S, Zhu D, Conaway RC, Conaway JW, Florens L, Washburn MP. Quantitative proteomic analysis of distinct mammalian Mediator complexes using normalized spectral abundance factors. Proc Natl Acad Sci U S A 2006; 103:18928-33; PMID:17138671; http://dx.doi.org/10.1073/pnas.0606379103
- Zybailov B, Mosley AL, Sardiu ME, Coleman MK, Florens L, Washburn MP. Statistical Analysis of Membrane Proteome Expression Changes in Saccharomyces cerevisiae. J Proteome Res 2006; 5:2339-47; PMID:16944946; http://dx.doi.org/10.1021/pr060161n
- Zhu W, Smith JW, Huang C-M. Mass spectrometry-based label-free quantitative proteomics. J Biomed Biotechnol 2010; 2010:840518; PMID:19911078; http://dx.doi.org/10.1155/2010/840518
- Gutierrez AH, Moise L, De Groot AS. Of ; Hamsters and men: a new perspective on host cell proteins. Hum Vaccin Immunother 2012; 8:1172-4; PMID:23124469; http://dx.doi.org/10.4161/hv.22378
- Bailey-Kellogg C, Gutierrez AH, Moise L, Terry F, Martin WD, De Groot AS. CHOPPI: a web tool for the analysis of immunogenicity risk from host cell proteins in CHO-based protein production. Biotechnol Bioeng 2014; 111:2170-82; PMID:24888712; http://dx.doi.org/10.1002/bit.25286
- Zhu-Shimoni J, Yu C, Nishihara J, Wong RM, Gunawan F, Lin M, Krawitz D, Liu P, Sandoval W, Vanderlaan M. Host cell protein testing by ELISAs and the use of orthogonal methods. Biotechnol Bioeng 2014; 111:2367-79; PMID:24995961; http://dx.doi.org/10.1002/bit.25327
- Makarov A, Denisov E, Lange O, Horning S. Dynamic range of mass accuracy in LTQ Orbitrap hybrid mass spectrometer. J Am Soc Mass Spectrom 2006; 17:977-82; PMID:16750636; http://dx.doi.org/10.1016/j.jasms.2006.03.006
- Gentleman R, Carey V, Huber W, Irizarry R, Dudoit S. Bioinformatics and computational biology solutions using R and bioconductor. In: Gentleman R, Carey V, Huber W, Irizarry R, Dudoit S, editors. Statistics for Biology and Health. New York: Springer; 2005.
- Eidhammer I, Barsnes H, Egil Eide G, Martens L. Computational and statistical methods for protein quantification by mass spectrometry, 1st edition. New York: Wiley; 2013.
- Grobei MA, Qeli E, Brunner E, Rehrauer H, Zhang R, Roschitzki B, Basler K, Ahrens CH, Grossniklaus U. Deterministic protein inference for shotgun proteomics data provides new insights into Arabidopsis pollen development and function. Genome Res 2009; 19:1786-800; PMID:19546170; http://dx.doi.org/10.1101/gr.089060.108
- Akella LM, Rejtar T, Orazine C, Hincapie M, Hancock WS. CLUE-TIPS, Clustering methods for pattern analysis of LC-MS data. J Proteome Res 2009; 8:4732-42; PMID:19725534; http://dx.doi.org/10.1021/pr900427q
- Bruand J, Alexandrov T, Sistla S, Wisztorski M, Meriaux C, Becker M, Salzet M, Fournier I, Macagno E, Bafna V. AMASS: algorithm for MSI analysis by semi-supervised segmentation. J Proteome Res 2011; 10:4734-43; PMID:21800894; http://dx.doi.org/10.1021/pr2005378
- Baerenfaller K, Grossmann J, Grobei MA, Hull R, Hirsch-Hoffmann M, Yalovsky S, Zimmermann P, Grossniklaus U, Gruissem W, Baginsky S. Genome-scale proteomics reveals Arabidopsis thaliana gene models and proteome dynamics. Science (Washington, DC, U S) 2008; 320:938-41; http://dx.doi.org/10.1126/science.1157956
- Kislinger T, Gramolini AO, MacLennan DH, Emili A. Multidimensional protein identification technology (MudPIT): technical overview of a profiling method optimized for the comprehensive proteomic investigation of normal and diseased heart tissue. J Am Soc Mass Spectrom 2005; 16:1207-20; PMID:15979338; http://dx.doi.org/10.1016/j.jasms.2005.02.015
- Griffin NM, Yu J, Long F, Oh P, Shore S, Li Y, Koziol JA, Schnitzer JE. Label-free, normalized quantification of complex mass spectrometry data for proteomic analysis. Nat Biotechnol 2010; 28:83-9; PMID:20010810; http://dx.doi.org/10.1038/nbt.1592
- Yuk IH, Nishihara J, Walker D Jr, Huang E, Gunawan F, Subramanian J, Pynn AF, Yu XC, Zhu-Shimoni J, Vanderlaan M, et al. More similar than different: Host cell protein production using three null CHO cell lines. Biotechnol Bioeng 2015:doi: 10.1002/bit.25615; PMID:25894672
- Carlage T, Hincapie M, Zang L, Lyubarskaya Y, Madden H, Mhatre R, Hancock WS. Proteomic profiling of a high-producing Chinese hamster ovary cell culture. Anal Chem 2009; 81:7357-62; PMID:19663468; http://dx.doi.org/10.1021/ac900792z
- Carlage T, Kshirsagar R, Zang L, Janakiraman V, Hincapie M, Lyubarskaya Y, Weiskopf A, Hancock WS. Analysis of dynamic changes in the proteome of a Bcl-XL overexpressing Chinese hamster ovary cell culture during exponential and stationary phases. Biotechnol Prog 2012; 28:814-23; PMID:22556165; http://dx.doi.org/10.1002/btpr.1534
- Valente KN, Lenhoff AM, Lee KH. Expression of difficult-to-remove host cell protein impurities during extended Chinese hamster ovary cell culture and their impact on continuous bioprocessing. Biotechnol Bioeng 2015; 112:1232-42; PMID:25502542; http://dx.doi.org/10.1002/bit.25515
- Lu P, Vogel C, Wang R, Yao X, Marcotte EM. Absolute protein expression profiling estimates the relative contributions of transcriptional and translational regulation. Nat Biotechnol 2007; 25:117-24; PMID:17187058; http://dx.doi.org/10.1038/nbt1270
- Vogel C, Marcotte EM. Calculating absolute and relative protein abundance from mass spectrometry-based protein expression data. Nat Protoc 2008; 3:1444-51, S/1-S/11; PMID:18772871; http://dx.doi.org/10.1038/nprot.2008.132
- Kuntumalla S, Braisted JC, Huang S-T, Parmar PP, Clark DJ, Alami H, Zhang Q, Donohue-Rolfe A, Tzipori S, Fleischmann RD, et al. Comparison of two label-free global quantitation methods, APEX and 2D gel electrophoresis, applied to the Shigella dysenteriae proteome. Proteome Sci 2009; 7:22; http://dx.doi.org/10.1186/1477-5956-7-22
- Rappsilber J, Ryder U, Lamond AI, Mann M. Large-scale proteomic analysis of the human spliceosome. Genome Res 2002; 12:1231-45; PMID:12176931; http://dx.doi.org/10.1101/gr.473902
- Ishihama Y, Oda Y, Tabata T, Sato T, Nagasu T, Rappsilber J, Mann M. Exponentially modified protein abundance index (emPAI) for estimation of absolute protein amount in proteomics by the number of sequenced peptides per protein. Mol Cell Proteomics 2005; 4:1265-72; PMID:15958392; http://dx.doi.org/10.1074/mcp.M500061-MCP200
- Xu X, Nagarajan H, Lewis NE, Pan S, Cai Z, Liu X, Chen W, Xie M, Wang W, Hammond S, et al. The genomic sequence of the Chinese hamster ovary (CHO)-K1 cell line. Nat Biotechnol 2011; 29:735-41; PMID:21804562; http://dx.doi.org/10.1038/nbt.1932
- Baycin-Hizal D, Tabb DL, Chaerkady R, Chen L, Lewis NE, Nagarajan H, Sarkaria V, Kumar A, Wolozny D, Colao J, et al. Proteomic Analysis of Chinese Hamster Ovary Cells. J Proteome Res 2012; 11:5265-76; PMID:22971049; http://dx.doi.org/10.1021/pr300476w
- Eng JK, McCormack AL, Yates JR, III. An approach to correlate tandem mass spectral data of peptides with amino acid sequences in a protein database. J Am Soc Mass Spectrom 1994; 5:976-89; PMID:24226387; http://dx.doi.org/10.1016/1044-0305(94)80016-2
- Perkins DN, Pappin DJC, Creasy DM, Cottrell JS. Probability-based protein identification by searching sequence databases using mass spectrometry data. Electrophoresis 1999; 20:3551-67; PMID:10612281; http://dx.doi.org/10.1002/(SICI)1522-2683(19991201)20:18%3c3551::AID-ELPS3551%3e3.0.CO;2-2
- Kaell L, Canterbury JD, Weston J, Noble WS, MacCoss MJ. Semi-supervised learning for peptide identification from shotgun proteomics datasets. Nat Methods 2007; 4:923-5; PMID:17952086; http://dx.doi.org/10.1038/nmeth1113
- R Core Team. R: A Language and Environment for Statistical Computing. 2014. Available at http://www.R-project.org.