
 ?Mathematical formulae have been encoded as MathML and are displayed in this HTML version using MathJax in order to improve their display. Uncheck the box to turn MathJax off. This feature requires Javascript. Click on a formula to zoom.
ABSTRACT
The monoclonal antibody VRC01 targets the CD4 binding site of the human immunodeficiency virus (HIV)-1 envelope. In the clinical study HVTN 104 (NCT02165267), 84 HIV-uninfected adults received multiple-dose intravenous (IV) VRC01 (10, 20, 30 or 40 mg/kg) every 4 or 8 weeks or subcutaneous (SC) VRC01 (5 mg/kg) every 2 weeks, and were followed for 32 weeks. We conducted a population pharmacokinetics (popPK) analysis based on 1117 VRC01 serum concentrations using a 2-compartment PK model with first-order elimination; for SC VRC01 a depot compartment with a first-order absorption rate constant was also included. All PK parameters were estimated with acceptable precision. Estimated bioavailability of SC VRC01 was 74%, with peak concentrations occurring 2–3 d after administration. For both IV and SC VRC01, population mean estimates for clearance (CL), central volume of distribution (Vc), inter-compartmental distribution clearance (Q) and peripheral volume of distribution (Vp) were 0.40 L/day, 1.94 L, 0.84 L/day and 4.90 L, respectively; the estimated terminal half-life was 15 d and these were independent of VRC01 dose. Body weight significantly influenced CL (1.2% fold/kg), Vc (1.0% fold/kg), Q (0.69 log(L/day)/kg) and Vp (0.82 log(L)/kg). The developed popPK model, supporting weight-dependent dosing regimens, projected positive trough levels, 5.54 (95% prediction interval: 1.69, 14.5) mcg/mL and 15.9 (5.29, 46.63) mcg/mL, respectively, for the 10 mg/kg and 30 mg/kg 8-weekly regimens being evaluated in ongoing HIV prevention efficacy studies of IV VRC01. These results are critical for future dose-regimen selection and modeling research to identify VRC01 serum concentration levels sufficient for protection against HIV infection.
Introduction
Human immunodeficiency virus (HIV) continues to be a major global public health crisis, already having claimed more than 35 million lives. The World Health Organization estimates that 2.1 million new HIV infections were acquired in 2015.Citation1 Antiretroviral (ART) drugs have been shown to be effective in reducing HIV transmission and acquisition;Citation2-4 however, the requirement for frequent use as currently licensed, drug and monitoring costs, and long-term side effects may render them insufficient to halt the HIV pandemic on their own.Citation5 A recently developed biomedical HIV prevention approach, parenteral (or passive) administration of monoclonal antibodies (mAbs), has been received with optimism given that HIV-1 broadly neutralizing antibodies (bnAbs) isolated from chronically infected individuals have shown impressive breadth, inhibiting 80–90% or more of HIV-1 isolates in in-vitro neutralization assays at bnAb concentrations as low as 1.0 mcg/mL.Citation6-8
VRC01 is an IgG1 HIV-1 broadly neutralizing mAb targeting the CD4 binding site of the HIV-1 envelope,Citation9,10 whose potential to prevent HIV-1 infection has been demonstrated in non-human primate challenge studies.Citation11-13 Notably, the first efficacy study of a bnAb (VRC01) for HIV-1 prevention was launched in 2016 as the Antibody Mediated Prevention (AMP) study. AMP consists of 2 harmonized Phase 2b randomized trials in sub-Saharan African women (HVTN 703/HPTN 081 ClinicalTrials.gov #NCT02568215) and in North and South American/Swiss men who have sex with men and transgender persons (HVTN 704/HPTN 085 ClinicalTrials.gov #NCT02716675), which randomize HIV-1 negative at-risk volunteers in 1:1:1 allocation to receive a total of 10 intravenous (IV) infusions (8-weekly) of VRC01 at a dose of 10 mg/kg, 30 mg/kg, or placebo, and have the primary objective to assess whether IV-administered VRC01 prevents HIV-1 infection.Citation14 A key secondary objective of AMP is to identify whether and how VRC01 serum concentration (or other VRC01 functional biomarkers) over time is associated with the rate of HIV infection via correlates of risk analyses.Citation15,16
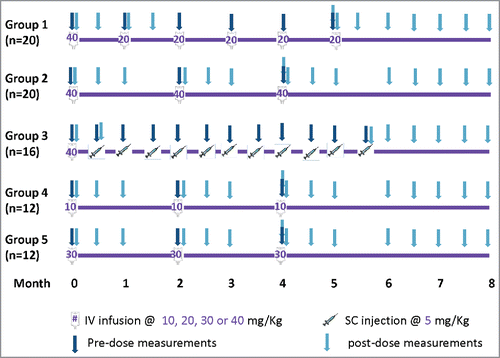
Prior to the launch of AMP, first-in-human dose-escalation Phase 1 studies of VRC01 in HIV-infected (VRC601)Citation17 and HIV-uninfected adults (VRC602)Citation18 were completed. In addition, HVTN 104 (NCT02165267) was conducted in a larger number of HIV-uninfected adults to evaluate the safety and pharmacokinetics (PK) of multiple-dose IV and subcutaneous (SC) VRC01 of different dosages and schedules ().
Figure 1. Study schema and VRC01 serum concentration sampling schedule in HVTN104.
Our analysis was motivated by the need to select dose-regimens based on predicted concentration profiles for future efficacy trials of similar bnAbs, and to aid the correlates of risk analyses in the AMP trials by providing a technique for inferring VRC01 concentrations throughout the course of mAb administration. The objectives of this analysis were to construct and evaluate, based on IV and SC VRC01 data from HVTN104 and VRC602, a population pharmacokinetics (popPK) model that accurately characterizes the concentration-time curves of VRC01 in healthy adults, including inter-individual variabilities of various PK parameters and the effects of covariates on systemic drug exposure.
Results
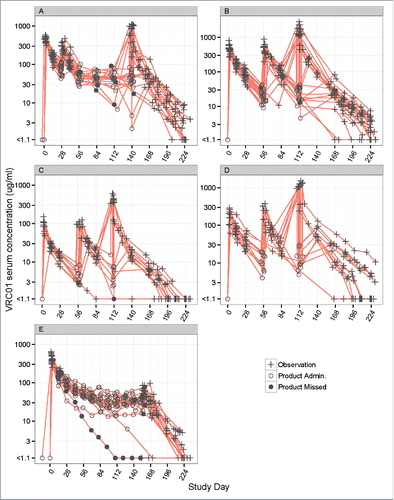
A total of 1117 VRC01 serum concentrations available from 84 participants (42 males and 42 females) who received IV or SC VRC01 in HVTN 104 were analyzed to build the popPK model (). The participants' median age was 27 y (range 18 to 50) and the median body weight was 72 kg (range 53 to 114 kg). Among the safety laboratory measurements considered in the popPK model, the median estimated creatinine clearance was 126 mL/min (range 69 to 254) (). The majority of participants received the planned administrations of VRC01, with 38 of 44 (86%) participants receiving all 3 8-weekly doses of IV VRC01, 17 of 20 (85%) participants receiving all 6 4-weekly doses of IV VRC01, and 12 of 20 (60%) participants receiving all 11 2-weekly doses of SC VRC01. The observed concentrations included in the modeling are shown in (natural log-scale) and Fig. S1 (raw-scale).
Table 1. Summary characteristics of baseline demographic and chemistry biomarker covariates among participants who received IV or SC VRC01 in HVTN104 (n = 84).
Figure 2. Individual-level concentration (log-scale)-time panel plots for VRC01 recipients in Groups 1–5 (Panels A-E) of HVTN104. Panel A – E display data from Groups 1, 2, 4, 5, and 3, respectively. “+” indicates no product administrations, an open circle indicates product administration, and a filled circle indicates a missed product administration.
Because multiple doses of IV VRC01 were studied, we first validated the linear PK assumption based on PK data collected in both HVTN 104 and VRC602 by confirming that dose-adjusted VRC01 exposures (i.e., received amount) after administration of a single dose (i.e., areas under the time-concentration curves from time 0 to infinity) from different doses generally did not vary more than +/− 25% from each otherCitation19 (Table S1). This assumption was later also validated parametrically in the popPK models. In the base 2-compartment model (Fig. S2), the exponential error model resulted in a relatively high residual error (% Coefficient of Variation, %CV > 30%), and the proportional error model tended to under-weigh low concentrations (data not shown). Therefore, the combination proportional + constant error model was chosen for its improved objective function value with a Bayesian Information Criterion (BIC) value of 4858 (vs. BIC = 6483 and 5083 for the additive error model and the proportional error model, respectively) and to accommodate the proportional error above the limit of detection and the additive effect around the limit of detection of the assay. In addition, half of the lower limit of quantification (LLoQ) (i.e., 0.55 mg/mL) was chosen to replace concentrations below the LLoQ in subsequent analyses; sensitivity analysis showed a minimal impact of the LLoQ value to the model fitting (Fig. S3).
In the base popPK model of IV and SC VRC01 data simultaneously without accounting for any covariates, inter-individual variability of the majority of the 5 PK parameters [clearance (CL), central volume of distribution (Vc), peripheral volume of distribution (Vp), distribution clearance (Q), and absorption rate constant (ka)] was observed to be moderate (22–39% CV) (). Clinical and demographic variables were then assessed for their potential role in explaining the observed inter-individual variability according to the model selection process described in Fig. S4. Based on the pre-specified covariate screening criteria, body weight and gender were considered as potential predictors for all 4 PK parameters. Additionally, age was considered for CL, Vp and Q, and hemoglobin and creatinine clearance were considered for Vc (Fig. S5).
Table 2. popPK parameter estimates of VRC01 based on the modeling of all IV infusion and SC injection groups in HVTN104. %RSE: relative standard error of the fixed effects estimate, calculated as (SE/Estimate) * 100. %CV: coefficient of variation for random effect estimates, calculated as * 100. R: correlation coefficient between random effect estimates.
In the final popPK model, estimated bioavailability after SC administration was 74% (95% confidence interval (CI): 65.4%, 82.0%) relative to IV administration. Among all considered covariates, only body weight was significantly predictive of CL and Vc in an exponential form, with an estimated 1.2% (95% CI: 0.8%, 1.6%) fold increase of CL and a 1.0% (95% CI: 0.6%, 1.4%) fold increase of Vc per kg of body weight, respectively. Body weight was also significantly predictive of Q and Vp in a power form, with an estimated 0.69 (95% CI: 0.27, 1.10) log increase of Q and 0.82 (95% CI: 0.46, 1.18) log increase of Vp per kg of body weight. After accounting for body weight, the inter-individual-variability (IIV) of the PK parameters decreased in a range of 3.6 to 5.3%CV. The population-mean estimates for CL, Vc and Vp were 0.40 (95% CI: 0.38, 0.42) L/day, 1.94 (95% CI: 1.72, 2.16) and 4.90 (95% CI: 4.48, 5.32) L, respectively, resulting in an estimated terminal half-life of 15 days, and an estimated volume of distribution at steady-state of 6.84 L for individuals with a body weight of 74.5 kg (median weight of IV groups). The correlations between the estimated PK parameters ranged from 0.12 (Vc and Q) to 0.95 (Vp and Q). Similar results were obtained when only IV groups were included in the modeling (Table S2). In addition, inter-occasion variability (IOV) of the PK parameters was < = 20% CV for all PK parameters and the IIVs of the PK parameters were not influenced by the inclusion of IOV based on the modeling of the 8-weekly dose regimens, suggesting that the PK patterns did not change over multiple doses. The final model of fitting SC and IV data simultaneously hence did not include IOV.
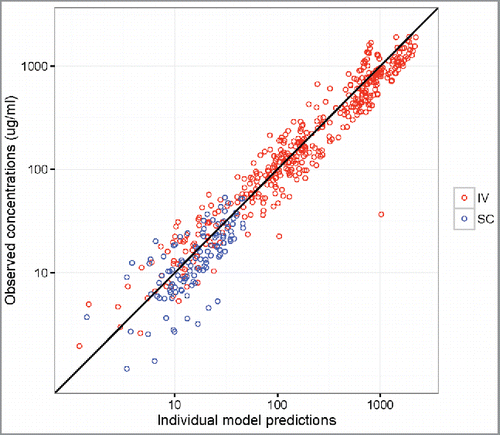
Overall, the popPK model diagnostic results suggested that the final model provides a reliable description of the data and the modeling assumptions were reasonable (). Reasonably accurate predictions of concentrations for each individual were also achieved and the observed dose-normalized concentration-time data fall largely within the 95% prediction interval after repeated IV or SC administration of VRC01 (, Fig. S6 and 7). In addition to internal data validation, the final popPK model was also validated using external data collected in the VRC602 study and the predicted concentrations largely resembled the observed values (, Fig. S8).
Figure 3. Goodness-of-fit plots obtained from the final model of IV infusion (red) and SC injection (blue) groups in HVTN104. Panels A-C are model diagnostic plots: (A) observed vs. individual-predicted concentration with an identity line, (B) conditional weighted residual vs. population predicted concentration, and (C) conditional weighted residual vs. time since first IV or SC dose (days). Data from multiple time-points of a participant are individually displayed, not aggregated. Panels D-F are visual prediction check (VPC) plots: (D) dose-normalized observed data from both the q4 and q8 weekly groups and simulated data after a single infusion of 10, 20, 30, or 40 mg/kg IV VRC01, (E) dose-normalized observed data from the SC injection Group 3 with an IV loading dose, and (F) dose-normalized observed data from the q8 weekly groups and simulated data after multiple infusions of 10, 30, or 40 mg/kg IV VRC01. In the VPC plots, lines show medians, and shaded areas show bands covered by the 2.5th and 97.5th percentiles for simulated concentrations. Simulated concentrations were computed from 1000 trials simulated using dosing, sampling, and covariate values from the observed data set.
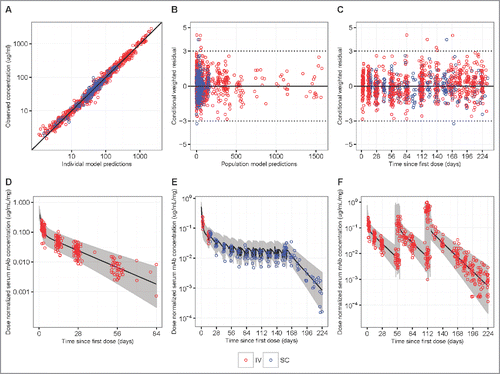
Figure 4. Observed vs. individual-predicted concentrations with an identify line in VRC602 based on the final HVTN 104 model for participants in the IV infusion (red) and SC injection (blue) groups.
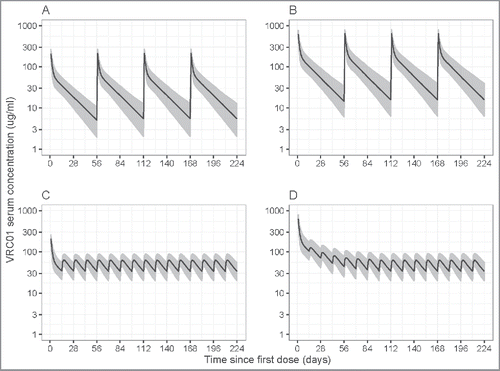
Lastly, the final model was used to predict concentration profiles of different dose-regimens of IV and SC VRC01 based on simulations. Particularly, for the 10 mg/kg and 30 mg/kg 8-weekly IV VRC01 regimens being evaluated in the AMP study, the final model projected steady-state trough levels of 5.54 (95% prediction interval (PI): 1.69, 14.5) mcg/mL and 15.9 (95% PI: 5.29, 46.63) mcg/mL, respectively, for a participant with a median body weight of 74.5 kg (). These results support the potential of 8-weekly IV VRC01 in providing protection against HIV infection, given that protection was seen at concentration levels as low as 1 mg/mL in pre-clinical studies,Citation11 if the non-human primate (NHP) model is predictive of the human experience. For the 5 mg/kg 2-weekly SC regimen with a loading dose of 10 or 30 mg/kg IV VRC01 that may be considered in the mother-to-infant transmission setting, the final model projected a steady-state trough level of 34.10 (95% PI: 18.27, 65.34) mcg/mL for a participant with a median body weight of 74.5 kg.
Figure 5. Simulated VRC01 serum concentrations after steady-state is reached under different regimens of multiple-dose IV or SC VRC01. Panels A and B are for the 8-weekly 10 mg/kg and 30 mg/kg IV VRC01 regimens, respectively; Panels C and D are for the 2-weekly 5 mg/kg SC VRC01 regimens, with an IV loading dose of 10 mg/kg and 30 mg/kg, respectively. Lines show medians, and shaded areas show bands covered by the 2.5th and 97.5th percentiles for simulated concentrations. Simulated concentrations were computed from 1000 trials simulated using weight = 74.5 kg.
Discussion
We conducted the first population PK analysis of VRC01, the first mAb entering efficacy trials to evaluate its ability to prevent HIV-1 infection when parenterally administered through repeated infusions in healthy adult volunteers. The primary purpose of this analysis was to demonstrate that a robust PK model of IV VRC01 could be developed to reliably characterize the observed PK data and to estimate VRC01 concentration values and associated variabilities at any post-dose time-point. Such knowledge is critical for addressing the correlates objectives of the AMP study and for the design of future studies of related bnAbs. For the former objective of associating VRC01 concentrations (or other VRC01 functional biomarkers) with trial outcomes, if efficacy of VRC01 is established in the AMP trials, then the described modeling process and the resulting PK model can be applied to estimate concentration values on a continuous time-scale, and association with infection status over time to identify an efficacious concentration level. Gaining such knowledge is critical for the development of HIV vaccines by defining bNab levels that effectively prevent HIV infection, as demonstrated in the precedent case of palivizumab,Citation20,21 which set the standard by which candidate RSV vaccines are being evaluated. Moreover, the PK model can be used for simulating hypothetical AMP trials for the purpose of vetting candidate statistical methods for identifying correlates of HIV risk and prevention efficacy. For the latter objective, based on the estimated variability and the identified predictors of the PK parameters, the developed PK model will be a useful tool for simulating concentrations under different dosing regimens for individuals of different body weights. For example, the tool can be used to inform dose regimen selection and identify optimal study populations for future studies of VRC01 or its derivatives.
We found that a 2-compartment model with first order elimination provided a robust fit to the repeated-dose PK data, with typical CL and Vc estimates of 0.40 L/day and 1.94 L, respectively, after IV or SC administration of VRC01. Absorption after SC administration was characterized by a first-order constant showing an estimated 74% bioavailability and approximately 2–3 d to reach the maximal concentration. Body weight was found to have an influence on all 4 PK parameters, supporting the weight-dependent dosing regimen of VRC01.Citation22 These results are consistent with commonly cited values for mAbs with linear PK,Citation23 and suggest that a robust PK model of VRC01 is feasible to be established for studies with even relatively sparse sampling time-points. The resulting model also showed excellent goodness-of-fit characteristics based on the modeled HVTN104 data and demonstrated reasonable prediction accuracy based on an external PK data set of IV VRC01. Importantly, the prediction performance of the final model was consistent across different concentrations throughout the dose interval. These PK model characteristics are especially relevant in the evaluation of the correlates objective in AMP where concentrations either near infusion or trough could be potential correlates of risk of HIV infection.
The resulting popPK model enables critical evaluation of various dose-regimens of VRC01 or its derivatives for future efficacy trials. Although it is unknown whether and at what concentration level of VRC01 healthy human individuals will be protected from HIV-1 infection (at least until the AMP study results become available), findings from several NHP studies suggest that VRC01 concentration levels at around 1 mg/mL confer promising protection.Citation11-13 For example, Pegu et al. showed that 4 of the 10 animals were protected against a single high-dose HIV virus inoculation with a VRC01 concentration of 1.3+/− 0.1 mg/mL (mean +/− standard error) at the day of challenge,Citation11 and Gautam et al. showed that 3 of the 6 tested animals had a concentration below 1 mg/mL at the time of virus breakthrough in repeated low-dose challenge studies.Citation13 We based our analysis on the premise that the NHP model is sufficiently predictive of the human experience. Moreover, our final model predicted that IV and SC VRC01 regimens that are under evaluation or planned to be in human efficacy trials maintain VRC01 serum concentration considerably above this hypothetical threshold of 1 mg/mL, an important finding because it permits some variability of this lower threshold in human populations. Specifically, the VRC01 serum concentrations were maintained throughout a follow-up period of 32 weeks for over 95% of individuals with a median steady-state trough of 5.54 and 15.9 mg/mL for the 10 mg/kg and 30 mg/kg 8-weekly IV VRC01 regimens, respectively, and of 34.10 mg/mL for the 5 mg/kg 2-weekly SC VRC01 regimen.
Passive immunoprophylaxis holds great promise for the prevention of HIV infection. Our analyses provide important understanding of the IIV of the VRC01 PK process and the effect of covariates on systemic drug exposure for the first of such mAb candidates. We found limited IIV for various PK parameters, confirming that variation in VRC01 concentrations over time is expected to provide more statistical information for assessing correlates of HIV risk and prevention efficacy than inter-individual variation in VRC01 concentrations at given time points. The low IIVs observed in this study are consistent with estimates for other mAbsCitation24-26 as compared with small molecules in general. This suggests that after accounting for body weight in VRC01 dosing and adherences, most participants will achieve similar concentrations without much variation due to other characteristics. In future analyses of PK data in healthy volunteers from other mAb studies, the same model building process may be followed; however, a different set of predictive covariates, including gender or various clinical/laboratory biomarkers, may emerge in explaining the observed IIV in the PK parameters. For example, the level of immunoglobulins, CD8+ T-cell immunity and anti-drug activities, if any, may potentially affect the PK of anti-HIV mAbs.Citation27,28
In summary, we described in detail the construction of a robust PK model based on clinical study data and validated the final model using both internal and external PK data. The modeling results increase understanding of VRC01 and constitute a benchmark for other HIV-1 bnAbs that may have different biologic targets and characteristics. The final PK model was used in simulation studies to study the operating characteristics of different PK study designs. The modeling exercise itself can be a starting point for future popPK modeling of VRC01 and its derivatives. The final PK model can also be used in simulation studies to assess the operating characteristics of alternative IV or SC VRC01 dose regimens, and in statistical methods development and implementation for future correlates research.
Materials and methods
Study procedures
In HVTN 104, 84 low HIV-1 risk, healthy men (n = 42) and women (n = 42) aged between 18 – 50 y were enrolled in one of 5 groups receiving either a loading dose of 40 mg/kg of VRC01 administered IV, followed by 20 mg/kg IV every 4 weeks (Group 1, n = 20); or 10, 30 or 40 mg/kg IV of VRC01 every 8 weeks (Groups 2, 4, or 5); or a 40 mg/kg IV loading dose of VRC01, followed by 5 mg/kg of VRC01 subcutaneously, every 2 weeks for 5.5 months (). The 4 participants who were randomized to receive placebo infusions in the SC group were not included in this analysis. All volunteers provided informed written consent before study participation, and the institutional review boards at the Fred Hutchinson Research Center approved the described study.
VRC01 serum concentrations were predominantly measured at ∼3 days, 2, 4 (except Group 3) and 8 (Groups 2, 4, 5 only) weeks after each infusion (injection), as well as at one hour post last infusion. Specifically, trough measurements were taken at 4 weeks (for Group 1) or 8 weeks (for Groups 2, 4, 5) before the next infusion; peak measurements were taken at 1 hour post-infusion for IV groups (Groups 1, 2, 4 and 5), and 3-days after injection for the SC group (Group 3). However, some study visits and infusions were missed, and the exact collection dates varied around the study-specified target days according to pre-specified allowable visit windows. The actual serum concentration collection days were used in the modeling.
Serum concentration measurements
Enzyme-linked immunosorbent assay (ELISA) methods were developed to quantify the mAb concentration in human serum.Citation17,18 The capture mAb used for this assay was 5C9 (Lot XJ-5/15/15) which is an anti-idiotype antibody for VRC01, developed and purified by the Vaccine Research Center (VRC), National Institute of Allergy and Infectious Diseases (NIAID) at the National Institutes of Health (NIH). Inter-assay accuracy and precision requirements were less than 20% CV. The lower limit of quantification was 1.1 mg/mL for VRC01. Values below the LLoQ were replaced by 0.55 mg/mL. Sensitivity analyses were performed to evaluate the effect of this censoring value on the modeling results. No samples tested positive for anti-VRC01 antibodies.
popPK Modeling
Structure Model Dose-normalized area under the curve (AUC) by trapezoidal integration was calculated to examine linearity of PK following IV VRC01 administration based on data from both HVTN104 and VRC602.
Individual concentration-time data from all 84participants were analyzed using nonlinear mixed effects modeling with the NONMEM software system (Version 7.3, ICON Development Solutions). VRC01 PK following IV and SC administration was described by an open 2-compartment disposition model with first-order elimination from the central compartment (Fig. S2). For VRC01 administered SC, a depot compartment with a first-order absorption rate constant was also included. The model of fitting SC and IV data simultaneously was parameterized in terms of CL, Vc, Vp, Q, and ka. The absolute bioavailability, F1 was estimated for SC administration relative to IV administration.
Variability popPK model The statistical model considered 2 primary sources of variability around the structure population mean model: IIV of a PK parameter and residual variability (RV) remaining after controlling for other sources of variability in the data. In addition, IOV of a PK parameter was also investigated in the q-8 weekly IV infusion groups. Regarding IIV, an exponential between-individual random effects model was considered such that the distribution of PK parameters may be log-normally distributed but the distribution of the random effect is normal. The distribution can be expressed as , where
denotes the individual-specific PK parameter value for individual i, TV_
is the population value of the parameter for individual i, and
is the deviation from the population value for individual i, i.e., the individual-specific inter-individual random effect. The log-transformed
is assumed to be distributed as N(0, ω2).
Regarding RV, the exponential, proportional, and combination proportional + additive residual error models were all considered. Specifically, let and
denote the jth measured and model-predicted concentrations, respectively, for individual i, and
the associated intra-individual residual random error distributed as N(0, σ2). We considered an exponential error model:
, a proportional error model:
, and a proportional + additive error model:
. The %CV of the error terms and the resulting fit of the different error models in terms of BIC values (the smaller the better fit) were used in determining the final error model. Regarding IOV, individual PK parameters can change between study occasions due to, for example, changing number of doses or participant characteristics that may affect the underlying PK process. Such IOV was also considered based on data from the 8-weekly regimens as follows:
Lastly, due to the sparseness of data at the absorption phase of the SC VRC01 group (i.e., data were only available at 3-days after the first and last injections, besides the 2-week trough time-points), we considered bioavailability and the absorption rate as fixed effects.
Estimation methods The first-order conditional method with interaction was used in all models.
Covariate model Identification of covariates that are predictive of PK variability is important in understanding the sources of observed inter-individual variability. The primary covariates of interest for this analysis were predefined based on prior knowledge, and included age (years), gender (M/F), body weight (kg), body mass index (kg/m2), Cockcroft-Gault Creatinine clearance (CrCL, L/day), alkaline phosphatase (ALP, units/L), alkaline aminotransferase (ALT, units/L), aspartate aminotransferase (AST, units/L), hemoglobin (g/dl), platelets (103/mm3), lymphocyte count (cells/mm3), neutrophil count (cells/mm3), and white blood cell count (cells 103/mm3).
Each of these covariates was screened using graphical evaluations of: 1) the estimated inter-individual variance of each PK parameter (from the base model without inclusion of any covariates) vs. the potential covariate, and 2) the estimated individual-specific PK parameters (from the base model) vs. the potential covariate, as well as the pairwise correlations of the covariates. For continuous covariates, the normalized value (scaled by median) was used and a loess smooth line was used to help visualize trends and functional forms of the covariates in predicting PK variability. For discrete variables, boxplots were used for each category. We included continuous covariates that were correlated with both 1) and 2) (Spearman correlation coefficient ≥ 0.3 with p-value < 0.05) and discrete covariates that were correlated with both 1) and 2) (Wilcoxon rank-sum test p-value < 0.05). In addition, the effect of dose (10, 20, 30 or 40 mg/kg) was also assessed in the final model of IV groups by comparing the objective function values. The stepwise covariate modeling building tool of PsNCitation29 was used to reach the final covariate model, including choices of the specific covariates and their proper functional forms (linear, exponential, or power), based on likelihood ratio tests of the objective function value using maximum likelihood estimation. In each forward selection step, a covariate would be compared and included if the larger model was significantly better with P < 0.05 (χ2 distribution). In each backward selection step, a covariate would be excluded if the reduced model was significantly better with P < 0.01.
The effect of each potential covariate on relevant PK parameters (CL, Q, Vc, and Vp) was evaluated and compared using the 3 models, and the model resulting in the best objective function value was chosen. For example, the effects of body weight were described using a linear model: , exponential model:
, and a power model:
, where TV_
is the typical (population) value of the PK parameter θ, BWi is the body weight of individual i, 74.5 is the median body weight of the population, and
represents the body weight effect on the PK parameter. Similarly, the effects of age (and other covariates) on various PK parameters were evaluated.
Model building and evaluation Model selection was guided by various goodness-of-fit criteria, including diagnostic scatter plots, plausibility and precision of parameter estimates, and the likelihood ratio test (LRT). Details of the model building process are depicted in Fig. S4. The predictive performance of the final PK model(s) was evaluated using a visual predictive check. Specifically, the final popPK model was used to simulate 1000 hypothetical individuals who received a single or multiple infusion(s) of 10, 20, 30, or 40 mg/kg IV VRC01, or multiple injections of 5 mg/kg SC VRC01 with a loading dose of 40 mg/kg IV VRC01. The distribution (median and 95% prediction interval) of the simulated concentration vs. time curves was compared with the dose-normalized mAb concentrations observed from participants who received all 3 infusions. In addition to the usual model diagnostics, the resulting popPK model was also validated based on concentration-time data from VRC60218 where individual-level predicted and observed concentrations were compared.
Disclosure of potential conflicts of interest
No potential conflicts of interest were disclosed.
Author Contributions
Constructed ideas and wrote the manuscript: YH, LZ, EC, PG
Designed the research: YH, NG, KM, KS, JL, LC
Performed the laboratory assays: RB
Analyzed the data: YH, LZ, AI
Contributed new reagents/analytical tools: RB
All authors commented on the manuscript.
Supplemntal_Material.zip
Download Zip (1.5 MB)Acknowledgment
The authors thank the HVTN104 study participants and study team for their dedication and contributions to the original study, Doug Grove for preparing the data set, and Lindsay Carpp for editorial assistance.
Funding
This work was supported by the National Institute of Allergy and Infectious Diseases (NIAID) US. Public Health Service Grants UM1 AI068614 [LOC: HIV Vaccine Trials Network], UM1 AI068635 [HVTN SDMC FHCRC], UM1 AI068618 [HVTN Laboratory Center FHCRC]. The content of this manuscript is solely the responsibility of the authors and does not necessarily represent the official views of the National Institutes of Health. The funders had no role in study design, data collection and analysis, decision to publish, or preparation of the manuscript.
References
- World Health Organization. HIV/AIDS Fact Sheet. 2016 Jul. [accessed 2016 Jul 22]. http://www.who.int/mediacentre/factsheets/fs360/en/
- Cohen MS, Chen YQ, McCauley M, Gamble T, Hosseinipour MC, Kumarasamy N, Hakim JG, Kumwenda J, Grinsztejn B, Pilotto JH, et al. Prevention of HIV-1 infection with early antiretroviral therapy. N Engl J Med 2011; 365:493-505; PMID:21767103; https://doi.org/10.1056/NEJMoa1105243
- Grant RM, Lama JR, Anderson PL, McMahan V, Liu AY, Vargas L, Goicochea P, Casapia M, Guanira-Carranza JV, Ramirez-Cardich ME, et al. Preexposure chemoprophylaxis for HIV prevention in men who have sex with men. N Engl J Med 2010; 363:2587-99; PMID:21091279; https://doi.org/10.1056/NEJMoa1011205
- National Institutes of Health. Guidelines for the use of antiretroviral agents in HIV-1-Infected adults and adolescents: Limitations to treatment safety and efficacy: Adverse effects of antiretroviral agents. 2014 May 1. [accessed 2015 Feb 17]. http://aidsinfo.nih.gov/guidelines
- van der Straten A, Van Damme L, Haberer JE, Bangsberg DR. Unraveling the divergent results of pre-exposure prophylaxis trials for HIV prevention. AIDS 2012; 26:F13-9; PMID:22333749; https://doi.org/10.1097/QAD.0b013e3283522272
- Voronin Y, Mofenson LM, Cunningham CK, Fowler MG, Kaleebu P, McFarland EJ, Safrit JT, Graham BS, Snow W. HIV monoclonal antibodies: A new opportunity to further reduce mother-to-child HIV transmission. PLoS Med 2014; 11:e1001616; PMID:24714363; https://doi.org/10.1371/journal.pmed.1001616
- Nakamura KJ, Cerini C, Sobrera ER, Heath L, Sinkala M, Kankasa C, Thea DM, Mullins JI, Kuhn L, Aldrovandi GM. Coverage of primary mother-to-child HIV transmission isolates by second-generation broadly neutralizing antibodies. AIDS 2013; 27:337-46; PMID:23296195; https://doi.org/10.1097/QAD.0b013e32835cadd6
- Russell ES, Ojeda S, Fouda GG, Meshnick SR, Montefiori D, Permar SR, Swanstrom R. Short communication: HIV type 1 subtype C variants transmitted through the bottleneck of breastfeeding are sensitive to new generation broadly neutralizing antibodies directed against quaternary and CD4-binding site epitopes. AIDS Res Hum Retroviruses 2013; 29:511-5; PMID:23075434; https://doi.org/10.1089/aid.2012.0197
- Zhou T, Georgiev I, Wu X, Yang ZY, Dai K, Finzi A, Kwon YD, Scheid JF, Shi W, Xu L, et al. Structural basis for broad and potent neutralization of HIV-1 by antibody VRC01. Science 2010; 329:811-7; PMID:20616231; https://doi.org/10.1126/science.1192819
- Wu X, Yang ZY, Li Y, Hogerkorp CM, Schief WR, Seaman MS, Zhou T, Schmidt SD, Wu L, Xu L, et al. Rational design of envelope identifies broadly neutralizing human monoclonal antibodies to HIV-1. Science 2010; 329:856-61; PMID:20616233; https://doi.org/10.1126/science.1187659
- Pegu A, Yang ZY, Boyington JC, Wu L, Ko SY, Schmidt SD, McKee K, Kong WP, Shi W, Chen X, et al. Neutralizing antibodies to HIV-1 envelope protect more effectively in vivo than those to the CD4 receptor. Sci Transl Med 2014; 6:243ra88; PMID:24990883; https://doi.org/10.1126/scitranslmed.3008992
- Saunders KO, Pegu A, Georgiev IS, Zeng M, Joyce MG, Yang ZY, Ko SY, Chen X, Schmidt SD, Haase AT, et al. Sustained delivery of a broadly neutralizing antibody in nonhuman primates confers long-term protection against simian/human immunodeficiency virus infection. J Virol 2015; 89:5895-903; PMID:25787288; https://doi.org/10.1128/JVI.00210-15
- Gautam R, Nishimura Y, Pegu A, Nason MC, Klein F, Gazumyan A, Golijanin J, Buckler-White A, Sadjadpour R, Wang K, et al. A single injection of anti-HIV-1 antibodies protects against repeated SHIV challenges. Nature 2016; 533:105-9; PMID:27120156; https://doi.org/10.1038/nature17677
- Gilbert PB, Juraska M, deCamp AC, Karuna S, Edupuganti S, Mgodi N, Donnell DJ, Bentley C, Sista N, Andrew P. Basis and statistical design of the passive HIV-1 Antibody Mediated Prevention (AMP) test-of-concept efficacy trials. Stat Commun Infect Dis In press.
- Qin L, Gilbert PB, Corey L, McElrath MJ, Self SG. A framework for assessing immunological correlates of protection in vaccine trials. J Infect Dis 2007; 196:1304-12; PMID:17922394; https://doi.org/10.1086/522428
- Plotkin SA, Gilbert PB. Nomenclature for immune correlates of protection after vaccination. Clin Infect Dis 2012; 54:1615-7; PMID:22437237; https://doi.org/10.1093/cid/cis238
- Lynch RM, Boritz E, Coates EE, DeZure A, Madden P, Costner P, Enama ME, Plummer S, Holman L, Hendel CS, et al. Virologic effects of broadly neutralizing antibody VRC01 administration during chronic HIV-1 infection. Sci Transl Med 2015; 7:319ra206; PMID:26702094; https://doi.org/10.1126/scitranslmed.aad5752
- Ledgerwood JE, Coates EE, Yamshchikov G, Saunders JG, Holman L, Enama ME, DeZure A, Lynch RM, Gordon I, Plummer S, et al. Safety, pharmacokinetics and neutralization of the broadly neutralizing HIV-1 human monoclonal antibody VRC01 in healthy adults. Clin Exp Immunol 2015; 182:289-301; PMID:26332605; https://doi.org/10.1111/cei.12692
- European Medicines Agency. Guideline on the pharmacokinetic and clinical evaluation of modified-release dosage forms. 2013 Feb 21. [accessed 2016 Feb 28]. http://www.ema.europa.eu/docs/en_GB/document_library/Scientific_guideline/2013/03/WC500140482.pdf
- IMpact Study Group-RSV. Palivizumab, a humanized respiratory syncytial virus monoclonal antibody, reduces hospitalization from respiratory syncytial virus infection in high-risk infants. Pediatrics 1998; 102:531-7; PMID:9738173; https://doi.org/10.1542/peds.102.3.531
- Homaira N, Rawlinson W, Snelling TL, Jaffe A. Effectiveness of palivizumab in preventing RSV hospitalization in high risk children: A Real-World perspective. Int J Pediatr 2014; 2014:571609; PMID:25548575; https://doi.org/10.1155/2014/571609
- Wang DD, Zhang S, Zhao H, Men AY, Parivar K. Fixed dosing versus body size-based dosing of monoclonal antibodies in adult clinical trials. J Clin Pharmacol 2009; 49:1012-24; PMID:19620385; https://doi.org/10.1177/0091270009337512
- Davda JP, Dodds MG, Gibbs MA, Wisdom W, Gibbs J. A model-based meta-analysis of monoclonal antibody pharmacokinetics to guide optimal first-in-human study design. MAbs 2014; 6:1094-102; PMID:24837591; https://doi.org/10.4161/mabs.29095
- Bai S, Jorga K, Xin Y, Jin D, Zheng Y, Damico-Beyer LA, Gupta M, Tang M, Allison DE, Lu D, et al. A guide to rational dosing of monoclonal antibodies. Clin Pharmacokinet 2012; 51:119-35; PMID:22257150; https://doi.org/10.2165/11596370-000000000-00000
- Lowy I, Molrine DC, Leav BA, Blair BM, Baxter R, Gerding DN, Nichol G, Thomas WD, Jr., Leney M, Sloan S, et al. Treatment with monoclonal antibodies against Clostridium difficile toxins. N Engl J Med 2010; 362:197-205; PMID:20089970; https://doi.org/10.1056/NEJMoa0907635
- Chung RT, Gordon FD, Curry MP, Schiano TD, Emre S, Corey K, Markmann JF, Hertl M, Pomposelli JJ, Pomfret EA, et al. Human monoclonal antibody MBL-HCV1 delays HCV viral rebound following liver transplantation: a randomized controlled study. Am J Transplant 2013; 13:1047-54; PMID:23356386; https://doi.org/10.1111/ajt.12083
- Moir S, Fauci AS. B cells in HIV infection and disease. Nat Rev Immunol 2009; 9:235-45; PMID:19319142; https://doi.org/10.1038/nri2524
- Schoofs T, Klein F, Braunschweig M, Kreider EF, Feldmann A, Nogueira L, Oliveira T, Lorenzi JC, Parrish EH, Learn GH, et al. HIV-1 therapy with monoclonal antibody 3BNC117 elicits host immune responses against HIV-1. Science 2016; 352:997-1001; PMID:27199429; https://doi.org/10.1126/science.aaf0972
- Lindbom L, Ribbing J, Jonsson EN. Perl-speaks-NONMEM (PsN)–a Perl module for NONMEM related programming. Comput Methods Programs Biomed 2004; 75:85-94; PMID:15212851; https://doi.org/10.1016/j.cmpb.2003.11.003