
ABSTRACT
High protein titers are gaining importance in biopharmaceutical industry. A major challenge in the development of highly concentrated mAb solutions is their long-term stability and often incalculable viscosity. The complexity of the molecule itself, as well as the various molecular interactions, make it difficult to describe their solution behavior. To study the formulation stability, long- and short-range interactions and the formation of complex network structures have to be taken into account. For a better understanding of highly concentrated solutions, we combined established and novel analytical tools to characterize the effect of solution properties on the stability of highly concentrated mAb formulations. In this study, monoclonal antibody solutions in a concentration range of 50–200 mg/ml at pH 5–9 with and without glycine, PEG4000, and Na2SO4 were analyzed. To determine the monomer content, analytical size-exclusion chromatography runs were performed. ζ-potential measurements were conducted to analyze the electrophoretic properties in different solutions. The melting and aggregation temperatures were determined with the help of fluorescence and static light scattering measurements. Additionally, rheological measurements were conducted to study the solution viscosity and viscoelastic behavior of the mAb solutions. The so-determined analytical parameters were scored and merged in an analytical toolbox. The resulting scoring was then successfully correlated with long-term storage (40 d of incubation) experiments. Our results indicate that the sensitivity of complex rheological measurements, in combination with the applied techniques, allows reliable statements to be made with respect to the effect of solution properties, such as protein concentration, ionic strength, and pH shift, on the strength of protein-protein interaction and solution colloidal stability.
Introduction
Antibodies are used for a wide range of pharmaceutical treatments. For cancer or autoimmune diseases in particular, they are indispensable as specifically effective drugs.Citation1,2 New therapeutic forms and modes of administrations require an ever increasing molecule titer of the monoclonal antibodies (mAbs) in the final formulation.Citation3 The molecular density in solution results in new challenges for biopharmaceutical process development, formulation, and application. Especially the colloidal and conformational long-term stability of the molecules is considered a bottleneck.Citation4
The stability of highly concentrated mAb solutions is influenced by both long- and short-range interactions. Long-range interactions have an effect on proteins in ideal dilute solutions, whereas the effect of short-range interactions increases with increasing protein titer. Under conditions of high concentrations, an interplay of short- and long-range interactions occurs. Following the DLVO theory, electrostatic forces have the longest reach and are classified as repulsive long-range interactions.Citation5 The stronger the net charge of the molecular surface is, the more likely will the molecules of the same kind repel each other and the weaker is the aggregation tendency of the proteins in the respective solution.Citation6 However, it was found that when exceeding a certain charge value, the protein starts to unfold. In this case, the intramolecular repulsive interactions are so strong that the chemical bonds stabilizing the protein's 3-dimensional (3D) structure are destroyed.Citation7-9 Due to the progress of molecular dynamics simulations and the advancements of analytical techniques, charge distribution on the protein surface and its influence on the solution stability are well understood.Citation10,11 Determination of the ζ-potential is an established method to experimentally characterize the net surface charge of a protein. The ζ-potential describes the electric ion potential of the interfacial double layer and can be determined with the help of laser-doppler- micro electrophoresis, for example.Citation12
Determination of the ζ potential provides insights into the kind and strength of electrostatic forces that may lead to protein agglomeration and unfolding.
According to the DLVO theory, van der Waals forces are classified as short-range interactions. They can be described as universal weak attractive interactions of electromagnetic origin that are induced by dipole moments.Citation13 The forces between 2 polarized molecules have a short range only, so that their effect can be measured within the molecule and in highly concentrated protein solutions exclusively.
In the past decades, the DLVO theory was extended by taking into account hydrophobic forces, specific ion effects, and the effects of the hydration layer when discussing protein-protein interactions. Comparable to van der Waals forces, they can be classified as attractive short-range interactions. They are known to have a significant effect on the native structure of a protein and on protein-protein interactions in the highly concentrated regime.Citation11 Experimental detection of the type and strength of short-range interactions is comparably difficult due to their weak individual effects.
The character and strength of short- and long-range interactions are influenced by the amino acid sequence and molecular structure of the protein as well as by the pH, ionic strength, and co-solutes of the surrounding solution.Citation14,15 The complex interplay of the listed forces and their individual dependencies on varying solution conditions make it difficult to describe and predict protein long-term stability in the highly concentrated regime.
Due to the complexity of the interactions involved, the forces themselves are not analyzed in industry, but rather their effects on molecular stability and the protein phase behavior. For this purpose, the target molecule is dissolved in relevant solutions and, after the equilibrium has been established, its phase state or 3D structure is determined.
To be able to compare the behaviors of the molecules in solution without having to wait for the equilibrium condition, the process can be accelerated by energy input in the form of increased temperature. It induces agglomeration and chemical degradation of the protein within a short-term and can therefore accelerate long-term stability tests.
Weiss et al.Citation16 and He et al.Citation17 showed that an increase of determined melting temperature values Tm correlates with an increased long-term stability of the proteins studied. As this method is high throughput compatible and has a working volume in the µl range, the temperature-induced phase transition is widely used, especially for the pre-selection of buffer components and molecule main candidates.
Although these methods provide information on the behavior of the proteins in solution, they merely give a glimpse of the full picture of protein solution stability. To widen the view and predict the long-term stability of antibodies in solution, it is necessary to clarify the underlying causes, which is why a substantial amount of research has been done in this area in recent years.Citation18-20
A lump parameter is needed, which accounts for all the different influencing parameters. The B22 value was thought to be such a key parameter in the past,Citation21-24 but this approach did not work for concentrated protein solutions.Citation25,26 An approach taking into account multidimensional interactions occurring at high protein concentrations only, is the measurement of protein solution viscosity. Solution viscosity, hereinafter called viscosity, is the resistance of a fluid to gradual deformation. The rheological parameter was shown to correlate with the aggregation tendency of biopharmaceutical molecules, especially in the highly concentrated regime.Citation27,28 In addition to the good comparability with protein stability, the viscosity itself is of high importance to processing and formulation. When the viscosity exceeds the processability or syringability of the solution to be handled, the latter cannot be manufactured as a liquid, which is the favored formulation for antibodies that are very difficult to crystallize. It is for this reason that the study of long-term stability of a protein solution and the resulting selection of main candidates and buffer conditions should always take viscosity investigations into account.
Another promising application of rheology with regard to protein solution stability is the study of the viscoelastic behavior of protein solutions. Protein solutions behave viscoelastically. This implies that the protein solutions exhibit both viscous and elastic characteristics when undergoing deformation.Citation29 The viscous behavior can be described by the loss modulus, G,” and the elastic behavior by the storage modulus, G'. The characteristic viscoelastic response of the samples provides insights into the strength of protein-protein interaction and the development of protein networks. The behavior of proteins considering their interactions with other proteins or co-solutes as well as their molecular flexibility can be determined without the manipulation of the sample, also in the highly concentrated regime.Citation29
Saluja et al.Citation25 introduced a viscoelastic parameter which may be correlated directly with the protein long-term stability. In their published work, highly concentrated antibody solutions were characterized using ultrasonic shear rheology. Saluja et al. determined G' of given solutions at a set frequency value. The determined G' values were used to correlate the viscoelastic characteristics of protein solutions with the aggregation tendency of different antibodies. The work of Schermeyer et al.Citation30 is based on these findings. Here, frequency sweep measurements were applied to calculate G' as well as G” over a wide frequency range. When measuring viscoelastic substances, the values of G' and G” plotted over the radial frequency show a characteristic curve shape with a crossover point. It was shown that the crossover point shifts along the frequency axis as a function of the molecule interactions and molecular flexibility.Citation30,31 The frequency value of this crossover point, ωCO, was correlated successfully to the long-term phase behavior of the model protein lysozyme at concentrations ranging from 100–225 mg/ml. The study of the viscoelastic characteristic was also applied to describe the stability-enhancing effect of the Cherry-Tag™ which was fused to glutathione-S-transferase. Here, the rheological study, in combination with molecular dynamics simulation, was not only used for the description of the colloidal solution stability, but also for describing conformational stability of the fusion protein.Citation15
To date, none of the novel or established methods presented has been validated by regulatory authorities for the prediction of the long-term stability of antibody solutions.Citation18,32 The parameters that have an effect on the molecular conformational and colloidal stability are so complex that regulators hesitate to recommend a single analytical method for prediction. Thus, every formulation must be stored at least 12–24 months to prove long-term stability of the target molecule, which is time- and cost-intensive.
To address this challenge, an analytical toolbox is presented in this work. The toolbox intelligently combines established and novel analytical techniques for the description and prediction of protein long-term protein solution stability. As strong orthogonal analytical techniques, size-exclusion chromatography (SEC) measurements, ζ-potential and viscosity measurements, thermal stability tests as well as complex rheological measurements are performed in a wide screening range. The solution conditions were selected on the basis of pre-stability tests, the objective being to investigate a wide range of positive and negative influencing physico-chemical mechanisms. The effects of 3 types of co-solutes, namely, of polyethylene glycol (PEG), sodium sulfate (Na2SO4) and glycine, on the mAb solution stability were investigated. Large-scale screening allows for the investigation of the antibody stability behavior under various conditions and reveals the limits of the individual analytical methods applied. Furthermore, the results of the measurements are scored and merged in a last step. The scoring values are directly compared with long-term stability tests. Based on the combined scoring values, the mAb long-term solution stability can be described and predicted reliably and safely.
Results
Preliminary selection of additives
The protein solution stability is largely dependent on the solution additives. Attention was paid to the used additives having either positive or negative effects on the mAb solution stability and to the effect being triggered by different physico-chemical mechanisms. Hence, the selection followed the results of pre-tests, where the impact of several additive types and concentrations on the mAb solution stability had been tested qualitatively by dynamic light scattering (DLS) measurements. The methodology of DLS measurement, conditions tested, and results can be found in the supplementary material, section A1.
Analytical characterization of the mAb solution
For description of the colloidal and conformational long-term stability of the mAb solutions, various analytical methods were applied. The analytics focused on pH 5, pH 7, pH 9, and mAb concentrations of 120 and 180 mg/ml. The effect of 50, 100, and 150 mM glycine was tested for all pH values. The effect of 0.4, 1.2, and 2.0 (m/V)% PEG4000 was studied at pH 9. The effect of 100–160 mM Na2SO4 was tested at pH 7. To evaluate the monomer, the high molecular weight (HMW), and the low molecular weight (LMW) contents of the mAb in the stock solution before and after sample preparation (buffer exchange and concentration), SEC runs were conducted. The effect of electrostatic interactions was studied by ζ-potential measurements. To determine the conformational and colloidal thermal stability of selected mAb samples, Tm and Tagg values were determined. Additionally, rheological measurements were performed to study the effect of varying solution conditions on the viscosity and to correlate the viscoelastic behavior of the mAb molecules with the long-term stability. The analytics were to give a detailed picture of the microscopic and macroscopic antibody behavior and, due to the combination of strong orthogonal tools, to enable a precise description of the long-term stability.
Initial solution characteristics: Size-exclusion chromatography
A description of the influence of preparation procedure, pH, and additives on the initial solution characteristics at t0 was performed using SEC measurements upfront of the analytical assays chosen in this study. The chromatograms, namely, the setting of the peak limits and the area calculation of the respective peaks, were always evaluated according to the same methodology and by the same operator, so that a very small mean standard deviation of 0.04% was achieved. The mAb stock solution had a monomer content of 98%, 0.33% HMW, and a LMW content of 0.98%.
In general, the tested mAb is relatively stable against buffer exchange and concentration in relation to the monomer content determined by analytical SEC. The monomer content in all tested samples was higher than 94.8%. In the monomer, LMW, and HMW content of samples are plotted after buffer exchange for original concentrations of 120 mg/ml and 180 mg/ml. The antibody concentration had no visible effect on the monomer content of the antibody with or without an additive in solution.
Figure 1. Monomer, HMW, and LMW contents of the tested antibody determined with the help of size-exclusion chromatography. Plotted are conditions after buffer exchange with original mAb concentrations of 120 and 180 mg/ml, at pH 5, pH 7, and pH 9 without additive (a) and with 150 mM glycine (b), as well as samples at pH 7 with 160 mM Na2SO4 and samples at pH 9 containing 1.2 (m/V)% PEG4000 (c).
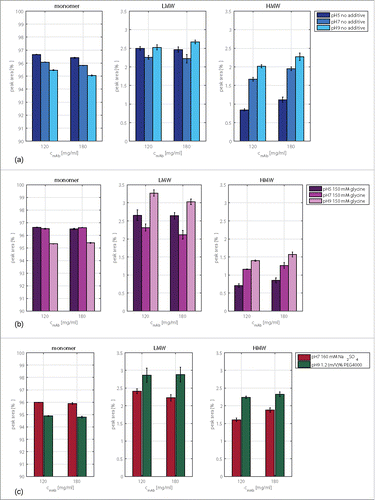
The pH had a more pronounced effect on the monomer content in solution in comparison to the mAb concentration. Comparing the results of samples at pH 5 with those of samples at pH 9, the monomer content decreased by 2–3.6%. Without an additive in solution, the LMW content increased by around 1.5% compared with that of the stock solution. The LMW content did not change with changing pH so that a conformational destabilization due to the pH shift can be excluded. The HMW content increased with increasing pH.
The addition of glycine caused the HMW content to decrease under all tested pH conditions (). The osmolyte further increased the LMW content, especially at pH 9. At pH 7 and a mAb concentration of 180 mg/ml, a slight decrease of the LMW content was observed.
The LMW content increased by 0.34% and 0.21% with PEG4000 in solution and a mAb concentration of 120 mg/ml and 180 mg/ml, respectively. The polymer increased the HMW content at pH 9. This was especially pronounced at 120 mg/ml (). Na2SO4 slightly increased the LMW content solely at pH 7 and 120 mg/ml. The salt had a small decreasing effect on the HMW content of the studied mAb at pH 7 (). The decrease was within the calculated standard deviation and, hence, negligible.
Electrostatic interactions: ζ-potential measurements
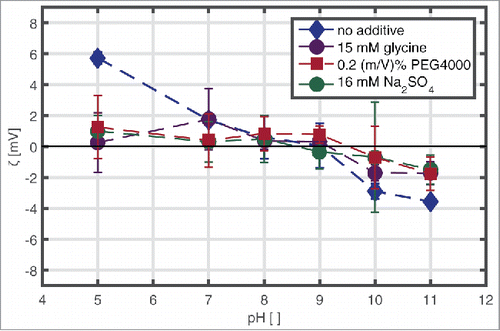
The ζ-potential of mAb solutions with a protein concentration of 10 mg/ml, in a pH range from 5–11, without additive, with 15 mM glycine, 16 mM Na2SO4, and 0.2 (m/V)% PEG4000, respectively is shown in . The mAb has a positive ζ-potential at pH 5 with a value of 5.7 mV and a negative net surface charge at pH 10 and pH 11 with a value of −3.56 mV. Ζ-potential values scattered around zero under other conditions tested.
Figure 2. ζ-potential values of mAb at 10 mg/ml, pH 5–11, with and without 150 mM glycine, 2 (m/V)% PEG4000, and 160 mM Na2SO4, respectively, in solution determined by laser Doppler microelectrophoresis.
Protein mobility: Viscosity measurements
The study of viscosity is crucial for the processability and formulation of mAb solutions and can give insights into the strength and causes of protein-protein interactions.
The reproducibility of the measurements was very high with an average standard deviation of 0.6%, except for the conditions at 180 mg/ml and the addition of PEG4000 with an average standard deviation of 10.2%. The high standard deviations may be due to the local formation of a 2-phase system or the instability of the mAb under these conditions. A change in viscosity by 1 mPas and a change greater than the calculated standard deviation were classified as significant.
In this study the mAb concentration had the main effect on viscosity (). The viscosity values increased with increasing protein concentration, independently of the pH or additive tested. The effect was most pronounced at pH 5. Here, a difference of around 7 mPas was detected between 120 mg/ml and 180 mg/ml.
Figure 3. Comparison of the viscosity values of samples with mAb concentrations of 120 and 180 mg/ml at pH 5, pH 7, and pH 9 with and without additive in solution.
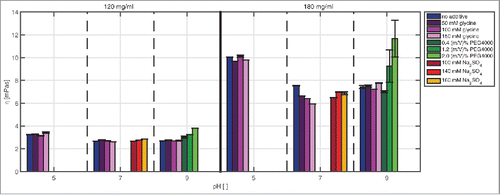
The viscosity values determined at pH 5 were higher compared with those at pH 7 and pH 9.
The additives had a comparatively small effect on viscosity. A viscosity decrease due to glycine at pH 7 and a mAb concentration of 180 mg/ml and a viscosity increase due to PEG4000 at pH 9 were found.
In this screening range, viscosity was highest (11.67 mPa) for samples at pH 9, a mAb concentration of 180 mg/ml, and 2 (m/V)% PEG4000 in solution. With increasing PEG4000 content, reproducibility of the measurement weakened, which resulted in a standard deviation of up to 15%.
Thermal colloidal and conformational protein stability
The accelerated temperature study provides information on the colloidal and conformational stability of the mAb under stressed conditions. Based on published thermal stability studies, a difference of 1°C was considered a significant result and assumed to be caused by a stabilizing or destabilizing effect on the protein structure or protein monodispersity.Citation18,33-35
In the chosen screening area, one Tagg value and, depending on the conditions prevailing, one (Tm1) or 2 Tm (Tm1 and Tm2) values could be detected for each sample. The exact Tm and Tagg values are shown in Table S2a and Table S2b in the supplementary materials. The standard deviations of the measurements did not exceed 1°C. Except at pH 5 and 120 mg/ml with and without glycine in solution and at pH 9 and 120 mg/ml with PEG4000 in solution.
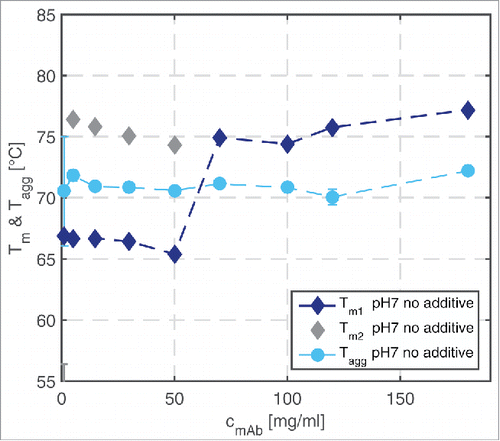
To study the effect of mAb concentration, the calculated Tm1, Tm2, and Tagg values are plotted as a function of the protein concentration in . The detected Tagg values are similar for all tested mAb concentrations and amount to about 70°C. They dominate the Tm1 values up to a protein concentration of 60 mg/ml. At mAb concentrations of up to 60 mg/ml, 2 fluorescence shifts were detected, so that a second Tm value, Tm2, could be calculated.
Figure 4. Tm1, Tm2, and Tagg values of mAb samples in a concentration range from 1–180 mg/ml at pH 7 without additive in solution determined over a temperature ramp ranging from 20–90°C.
In the impact of protein concentration (120 mg/ml and 180 mg/ml), pH, and additive type and concentration on the Tm1 values is depicted. Under these conditions, no second fluorescence shift occurred. The impact of mAb concentration from 120–180 mg/ml on thermal stability was found to be dependent on the pH. At pH 5, the Tm values decreased with increasing antibody concentration by 6°C and were lower than at pH 7 and pH 9. At these pH values, the effect of mAb concentration was small.
Figure 5. Comparison of Tm1 (a) and Tagg (b) values of samples with mAb concentrations of 120 and 180 mg/ml at pH 5, pH 7, and pH 9 with and without selected additives.
The impact of additives on the thermal conformational stability depended on the type of additive (). Glycine and Na2SO4 had a slightly positive impact, whereas PEG4000 had a predominantly negative impact on the determined Tm values. With PEG4000, the antibody solutions became opaque at concentrations higher than 120 mg/ml. Due to the high scattering signal, determination of Tm was not possible at a mAb concentration of 180 mg/ml.
The Tagg values were constant in a concentration range from 1 to 120 mg/ml (). Interestingly, the partly unfolded state of the antibody, which was detected by fluorescence measurements, did not have any impact on the Tagg values. This implies that the amino acids exposed by partial unfolding do not influence the colloidal stability of the antibody. From 120 to 180 mg/ml, the Tagg values increased for all pH values tested (). At pH 5, higher Tagg values were detected than at pH 7 and pH 9. Glycine increased the Tagg values of the samples at pH 5 and pH 7 with a protein concentration of 120 mg/ml. At pH 9 and 120 and 180 mg/ml, Tagg was also found to increase due to the addition of glycine. However, the changes were within the experimental error range and, hence, will not be discussed here. At pH 7 and a mAb concentration of 180 mg/ml, glycine decreased the Tagg by 2°C. PEG4000 had a decreasing impact on the determined Tagg values. With increasing PEG4000 concentration, the Tagg values decreased by 5°C. The effect of Na2SO4 on the measured Tagg values depended on the mAb concentration. A strong decrease was detected for samples at pH 7, a mAb concentration of 120 mg/ml, and a Na2SO4 concentration of 160 mM.
A comprehensive view: Determination of protein solution viscoelasticity
To study the complex rheological behavior of the mAb solutions, the rheological parameters G’ and G” were determined over a set frequency range. The values of these parameters or, to be more precise, their ratio at the different frequency points, provide insights into the relaxation behavior of the proteins in solution.Citation36 The relaxation behavior, in turn, is influenced by spatial limitations and the strength of molecule-molecule interaction. The measurable relaxation behavior of the protein solution, thus, is directly linked to the solution stability of the protein samples tested.Citation30 Stronger protein-protein interactions increase the relaxation time and, hence, result in a higher solution viscoelasticity. This relation can be described precisely by the frequency value of the crossover point of G’ and G,” ωCO. The higher the rigidity of the system due to attractive interactions is, the lower are the ωCO values. Apart from the strength of protein-protein interactions, the ωCO value is dependent on the size and structure of the protein itself. Under conditions where the protein-protein interactions of 2 proteins are equally pronounced, a small, globular protein exhibits higher ωCO values than a larger, structurally more complex protein. The threshold value ωlimit can be used as a reference point. Above ωlimit, protein solutions are expected to be stable. Below this value, samples are expected to be colloidally unstable. The ωlimit value for lysozyme is 20000 rad/sec.Citation30 Since the molecular mass of the antibody studied exceeds that of lysozyme by a factor of 10 and is not spherically shaped, the ωlimit value of the mAb is expected to be lower. Additionally, liquid formulations exhibiting ωCO values below 1000 rad/sec are generally expected to be unstable.
The standard deviations of the viscoelastic measurements were in the range of 0.06–4%, except for conditions with PEG4000 in solution. Here, standard deviations of up to 30% were observed. This decreased reproducibility may be due to the additional viscoelastic response of the PEG molecules.The calculated ωCO values of this screening varied in relation to the studied protein concentration, pH, and the type of additive. The impact of mAb concentration and pH without additives (a) and of mAb concentration and additive in solution at pH 5 (b), pH 7 (c), and pH 9 (d) on the rheological response is shown in . The highest ωCO values of 24043 rad/sec were detected for low mAb concentrations at pH 5. The lowest ωCO values for samples without additive in solution were calculated for pH 7. They were found to range from 21770 rad/sec at 50 mg/ml to 607 rad/sec at 200 mg/ml.
Figure 6. ωCO values of mAb samples without additive in solution as a function of protein concentration and pH (a). Impact of pH with an additive in solution, namely, 150 mM glycine (b), 160 mM Na2SO4 (c), and 2 (m/V)% PEG4000 (d), on the viscoelastic response. The gray area symbolizes the critical ωCO region. Above this region, the viscoelastic response indicates stable mAb solutions. ωCO values below this region indicate samples that might undergo phase transition.
With increasing protein concentration, the ωCO values decreased (). The extent of the decrease depended on the pH value of the samples tested. The drop of ωCO was more pronounced at pH 7 and pH 9 in comparison to samples at pH 5. For samples at pH 5, the ωCO decreased by 33% for samples with protein concentrations of 50 mg/ml and 200 mg/ml. At pH 7 and pH 9, a decrease of 97% and 98%, respectively, occurred, resulting in ωCO values below 1000 rad/sec for samples with a mAb concentration of 200 mg/ml.
To emphasize the impact of the pH on the viscoelastic response, the differences of the ωCO values at pH 5, pH 7, and pH 9 with 150 mM glycine, 2 (m/V)% PEG4000 as well as with 160 mM Na2SO4 and the ωCO values without additive in solution are plotted against the protein concentration in . At a mAb concentration of 50 mg/ml, the impact of the additives on rheological response was comparatively small and within the experimental error range ( and ). For samples at pH 7, this applies to all mAb concentrations ().
We found that the impact of glycine on the viscoelastic behavior of mAb samples depended on the pH. At pH 5 (), glycine decreased the ωCO values at all mAb concentrations tested and, hence, enhanced the viscoelasticity of the protein solution. The negative impact of glycine on the ωCO values decreased when comparing samples at pH 5 and pH 7 (). At pH 9 (), glycine significantly increased the ωCO values of the mAb solution in a concentration range from 100–200 mg/ml by 20 to > 100%.
At pH 5 and pH 9, PEG4000 ( and ) decreased the ωCO values. This effect increased with increasing protein concentration. The effect was most pronounced at 180 mg/ml with a ωCO difference of −5600 rad/sec compared with samples without PEG in solution.
At pH 7 (), the PEG4000 molecules appeared to have a positive effect on the flow behavior in a concentration range from 150 to 200 mg/ml. The strong viscoelasticity (low ωCO values) detected for samples at pH 7 without additive in solution was further reduced by adding PEG4000.
Na2SO4 as an additive had a decreasing impact on the ωCO values of mAb samples in a concentration range from 50 to 150 mg/ml at pH 9 (). Here, the addition of the kosmotropic salt leveled the ωCO values down to 8000 rad/sec with an ωCO difference of −8500 rad/sec in comparison to samples without Na2SO4 in solution. At pH 9 and higher protein concentrations, the salt appeared to have an opposite effect on the viscoelasticity of mAb samples (). At 200 mg/ml, the ωCO values with salt in solution were higher compared with samples without salt in solution. Here, an ωCO increase of +8100 rad/sec was observed.
In summary, the pH value had the dominating impact on the viscoelastic response of the mAb samples tested. The viscoelastic behavior at pH 7, pH 9, and pH 5 could be differentiated clearly. The impact of the additives depended on the type of additive, pH value, and the protein concentration.
Based on the correlation of the ωCO values with the long-term stability tests (section ‘Long-term phase behavior of mAb solutions’), a critical range could be defined, where the mAb solution is assumed to undergo phase transition. This area is marked in gray in . Above an ωCO value of 10000 rad/sec, the mAb molecules are assumed to be colloidally stable. Below this limit, aggregation of the mAb molecules can be expected. This knowledge allows for the description of mAb phase behavior based on one single rheological measurement.
Long-term phase behavior of mAb solutions
To correlate the analytical investigations with mAb solution stability, mAb phase diagrams were studied. The prepared protein phase diagrams were visually scored after 40 d of incubation according to the method of Baumgartner et al.Citation37 Consequently, long-term stability equals 40 d of incubation in this study.
In the mAb phase diagrams after 40 d of incubation (t40) are plotted. The first area in all 3 subplots symbolizes conditions without additive in solution. The mAb colloidal long-term stability was mainly dependent on the pH and additive type. At pH 5, the mAb molecules were soluble under all tested conditions. At pH 7, the mAb was least stable. Precipitation occurred over the whole mAb concentration range tested. Interestingly, the region where the mAb is colloidally stable increases at pH 9 in comparison to pH 7.
Figure 7. Scoring of the phase behavior of mAb in a pH range from 5 to 9, a protein concentration range from 120 to 225 mg/ml, and (a) 0–250 mM glycine, (b) 0–2 (m/V)% PEG4000, and (c) 0–160 mM Na2SO4 visualized as 3D plots. The plates were stored at a constant temperature of 20°C. The scoring was done after 40 d of incubation based on the visual evaluation of the pictures taken by the Rock Imager. The blue round symbols stand for samples containing soluble mAb molecules, the small light red squares symbolize light precipitation in the middle of the well, and the dark red squares symbolize heavy precipitation.
In the phase diagrams with glycine as an additive are shown. At pH 9 and higher mAb concentrations, glycine seemed to stabilize the protein. In comparison, PEG4000 destabilized the molecule at pH 9 (see ). Here, precipitation occurred from mAb concentrations of 150 mg/ml. PEG4000 seemed to have a stabilizing impact at pH 7 starting at protein concentrations of 195 mg/ml and PEG4000 concentrations of 0.8 (m/V)%. Under these conditions, only low precipitation in the middle of the well or soluble samples were detected. Na2SO4 had a stabilizing effect on the tested mAb at pH 9 in a mAb concentration range from 180 to 225 mg/ml with 75–200 mM Na2SO4. It was found to destabilize the mAb at lower protein concentrations (see ).
Comparison of analytical methods and protein long-term stability
We combined the analytical methods in this study to describe the long-term solution stability of the mAb samples screened. Therefore, a scoring system was introduced to classify the analytical results with respect to protein stability. The correlation presented here focuses on the descriptiveness of colloidal antibody stability under tested conditions.
To keep it simple, all analytical results were normalized and a scoring from 0 to 10 was defined. 10 indicates a high colloidal stability and 0 a weak solution stability of the screened mAb. For SEC analytics, a score of 10 was set for the maximal monomer content (96.7%) and a score of 0 was set for the lowest monomer content (94.8%) observed. A ζ-potential of 0 (scoring value 0) indicates weak electrostatic repulsion and an increased aggregation propensity. The maximum ζ-potential of this study of 5.7 mV was normalized to 10. A high viscosity is unfavorable for liquid formulations and may be correlated with strong protein-protein interactions. For this reason, the maximum viscosity value of this screening (11.7 mPa/s) was normalized to 0, while the minimum value (2.6 mPa/sec) was set to 10. Temperature ramps are commonly used to accelerate the degradation and aggregation process of protein solutions. They were successfully correlated with long-term stability.Citation18,38,39 It was shown that the melting temperature is only predictive in cases where degradation is linked to the unfolded protein structure.Citation40-42 In this study the aggregation kinetics was not dependent on the unfolding kinetics. Hence, the Tagg values and not the Tm values of this study were used to describe the solution stability of the antibody. The maximal Tagg value (74°C) was normalized to 10 and the minimal Tagg value (61°C) was normalized to 0.
Furthermore, it was shown that the viscoelastic characteristic of a molecule in solution directly correlates with the long-term solution stability.Citation30 The characteristic ωCO value determined by frequency sweep measurements is maximal (24043 rad/sec) at minimal aggregation propensity (score = 10) and minimal (256 rad/sec) at maximal aggregation propensity (score = 0). The determined scoring values were weighted equally, summed, and divided by the amount of scores used for the specific sample. The scoring values can be found in the (Table S3).
The scoring results are visualized with the help of a surface (see ). To facilitate comparison, the long-term stability scoring of similar samples is plotted next to the analytical scoring (see ). The red areas in mark conditions where the mAb is predicted to be unstable. Blue areas symbolize conditions where the mAb is predicted to be stable. The surface plot enables easy detection of conditions that are predicted to be stable and robust (in blue), as well as screening points that may be sensitive to slight changes of the molecular surroundings (e.g., pH 9, 180 mg/ml, 160 mM Na2SO4).
Figure 8. Scoring of analytical results is shown in relation to the long-term colloidal stability (a). The subplots from top to bottom show the predicted impact at pH 5, pH 7, and pH 9 with mAb concentrations of 120 and 180 mg/ml without additive in solution, with the addition of 150 mM glycine, 1.2 (m/V)% PEG4000, and 160 mM Na2SO4, respectively. The scoring of the phase behavior at t40 of similar samples is depicted on the right hand side for easier comparison (b).
The colloidal stability of the mAb is predicted to be dependent on protein concentration, pH, and additive type. The most stable region was predicted to be at pH 5 without additive in solution at 120 mg/ml. For mAb samples at pH 9, a mAb concentration of 180 mg/ml, and the addition of PEG4000, the smallest scoring value was calculated.
Discussion
Three types of additives, namely, salts, polymers, and osmolytes were used in this study. Possible physico-chemical effects of these co-solutes on antibody solution stability and, thus, the reasons for their selection are briefly discussed below.
The effect of salts on the protein solution stability is mainly dependent on their concentration and type. At low ionic strengths, salts primarily have a stabilizing effect due to nonspecific electrostatic interactions. This stabilizing effect was found to be independent of the salt type and is most pronounced close to the pI of proteins.Citation43 With increasing salt content, the impact of salt type becomes more pronounced. Salts of strong salting-out character are classified as kosmotropes and salts of predominantly salting-in character are classified as chaotropes. In several studies it was shown that antibody solution behavior follows this theory.Citation44 Strongly hydrated ions (kosmotropes) have a negative impact on the hydration shell of proteins, increase the hydrophobic protein-protein interactions, and negatively affect protein colloidal stability (e.g., Na2SO4).Citation43,45-47 Enhanced inner molecular hydrophobic interactions, on the other hand, lead to an increased conformational protein stability. Chaotropic salts, such as potassium iodide, decrease hydrophobic interactions by destroying the water structure around dissolved molecules. They have a denaturing effect on proteins, but may increase the colloidal stability at low to moderate concentrations.
As the interactions of salt ions with the protein are mainly based on electrostatic interactions, the effect of salt is pH-dependent and dependent on the amino acid sequence of the molecule tested. Specific interactions of salt ions with amino acid residues are not totally understood, especially at higher protein concentrations. As a result, modulations of protein-protein interactions by salt ions and their implications for the protein solution behavior cannot be completely rationalized.Citation48
In contrast to salt ions, polymers are uncharged, hydrophilic molecules, whose effect on proteins is mainly dependent on their chain length. Attractive protein-protein interactions can be strengthened when adding long-chain polymers by depletion attraction. The depletion attraction results from an increase in osmotic pressure of the surrounding solution when the proteins in solution get close enough such that the excluded co-solutes cannot fit in between them.Citation49,50 Based on this theory, the comparatively large hydrophilic PEG molecules exclude a certain amount of volume from the solution, which is then inaccessible to other molecules.Citation51 Thereby, the mAb molecules are sterically excluded from the volume of PEG and concentrate in the remaining volume. The so increased mAb concentration may lead to stronger short-range protein interactions that may cause agglomeration or unfolding of the molecules. Additionally, it was found that the OH group of polyethylene glycol can interact with positively charged amino acid residues of proteins.Citation52 This specific binding changes the net charge of the protein and may have a negative effect on the protein colloidal stability below the pI.
Short-chain polymers, on the other hand, can increase protein stability by preventing protein-protein interactions due to steric hindrance. In this study, a comparatively large PEG with a molecular weight of 4000 Da was investigated.
Osmolytes, including polyols, certain amino acids, and methylamines, are mainly used as stabilizing additives. The stabilizing effect of osmolytes is most often explained by the preferential exclusion of these small molecules from the protein surroundings. Preferential exclusion implies that the concentration of the osmolyte in the immediate volume element surrounding the protein is lower than its concentration in the bulk phase. This increases the water volume and its structured orientation around the protein, resulting in a colloidal stabilization.Citation53,54 The theory of protein surface hydration and the accompanying increase of surface tension is also known as the cavity theory. Several studies on protein colloidal and conformational stability support the cavity theory and the stabilizing character of osmolytes.Citation55-58
The effects of these additives as well as the effect of changing pH and protein concentration are discussed below in relation to the results of the analytical methods applied. The order of the discussion follows the structure of the results section.
The buffer pH had the main effect of mAb monodispersity. The decrease in monomer content with increasing pH could be a sign of the destabilization of the antibody solution due to the shift of the buffer pH toward the theoretical pI of the molecule at 8.7. The resulting reduction of repulsive electrostatic interaction may increase the aggregation tendency of the mAb molecules and, hence, the HMW content in solution. Even if this effect is weak at t0, it may be an indication of a decreased long-term colloidal stability of the mAb at pH 7 and pH 9 in comparison to pH 5.
The impact of glycine and PEG4000 followed the generally valid theories. Glycine decreased the HMW content of the mAb, whereas PEG4000 had a predominantly negative impact on mAb monodispersity. The effect of both additives was most pronounced close to the pI of the studied mAb, at pH 7 and pH 9. The increase of the LMW species by the addition of glycine has never been described so far and should be investigated in further experiments.
The reduction of the monomer content by around 2–3% may be caused partly by the mechanical stress during centrifugation. To evaluate this hypothesis, SEC runs were performed with samples transferred into a buffer similar to the stock solution buffer. Here, a monomer loss of 1.6% was determined. The observed monomer loss was mainly due to the defragmentation of the antibody, which is reflected by a 0.9% increase in LMW species. Thus, the change in LMW content of the tested mAb solutions can be attributed mainly to mechanical stress and a change in the HMW content correlated with varying environmental conditions.
The determined ζ-potential values are discussed with regard to protein-protein interactions which may be induced by the surface net charge of mAb molecules depending on the surrounding solution. As it had been assumed based on the theoretical pI of 8.7, the ζ-potential values followed the expected ζ-potential curve of proteins.Citation59 In a pH range between pH 7 and pH 9, the mAb molecules possessed a relatively low effective charge. Here, repulsive electrostatic protein-protein interactions are weak so that the inter-separation distance of the molecules decreases.Citation60 This induces positive short-range protein-protein interactions, including dipole-mediated and hydrophobic interactions.Citation61 These attractive interactions may increase the aggregation propensity of the antibody. The results underline the findings of SEC analytics, where an increase of HMW species at pH 7 and pH 9 in comparison to pH 5 was determined. With the selected additives in solution, the ζ-potential values scattered around zero. This leads to the assumption that glycine, PEG4000, and Na2SO4 reduce the electrostatic repulsion of the mAb molecules at all tested pH values. The reduction of the mAb surface charge by Na2SO4 and the zwitter ion glycine can be explained by attractive electrostatic interactions between the charged additives and charged amino acid residues on the mAb surface. PEG, on the other hand, is an uncharged molecule. A possible explanation for the reduced ζ-potential due to PEG4000 is the interaction of the OH group of the PEG molecule with charged amino acid side chains. Another explanation could be the steric hindrance of protein movement in the electric field by the long-chain polymer.
In contrast to the ζ-potential results, SEC measurements revealed mAb solution stability differences depending on the additive type. The additives either have an additional effect on the protein-protein interactions that cannot be described solely by ζ-potential measurements or the electrophoretic measurements are not sensitive enough to depict the differing effects of glycine, PEG4000, and Na2SO4 on the protein-protein interactions.
The concentration-dependent increase of viscosity is a function of the ability of the mAb to self-associate and, hence, is supposed to result from protein-protein interactions induced by charge, hydrophobicity, or dipole moments.Citation28 Based on the viscosity investigations, it is assumed that up to a concentration of 120 mg/ml, where relatively low viscosity values were observed, repulsive long-range protein-protein interactions dominate over weak attractive short-range interactions. At higher concentrations, the attractive short-range interactions increase viscosity due to the reduced distance between the mAb molecules.Citation6
With the change of mainly long-range mAb-mAb interactions to short-range interactions, the effect of pH on the viscosity increases as well. The pH dependence of protein solution viscosity cannot be described without invoking protein surface hydration. Water molecules that are structured around the protein surface are less mobile than bulk water molecules.Citation62 Hence, viscosity depends on the strength of the hydration layer, which, in turn, is directly related to the pH and the surface properties of the protein.
At pH 5, the highest viscosity values were determined. pH 5 is farthest away from the pI of the studied mAb. Based on ζ-potential measurements, it is assumed that the surface charge of the molecule is stronger at pH 5 than at pH 7 and pH 9. Having this knowledge, the viscosity increase at pH 5 might be explained by the electroviscous effect.Citation63,64
Due to the electroviscous effect, viscosity increases with increasing molecular charge and is smallest at the pI. This theory can explain the results of this study and has already been applied successfully to several other moleculesCitation63,65;Citation66 and to highly concentrated IgG1 solutions.Citation67 This theory, however, contradicts the general understanding of viscosity being highest near the pI.Citation25,68
Following the generally accepted hypothesis of an increased viscosity also implying a decreased mAb solution stability, pH 5 might be considered the least favorable solution pH at first glance. At high concentrations, viscosity measurements might yield an opposite result regarding optimal buffer pH selection than SEC analytics and ζ-potential determinations.
Glycine decreased the viscosity at pH 7 and 180 mg/ml. A decreasing effect of glycine on viscosity had previously been described by Wang et al.Citation69 Glycine is a hydrophilic amino acid and preferably hydrates molecules in solution, which may reduce mAb-mAb interactions and, hence, viscosity. The increase in viscosity by the addition of PEG4000 can be attributed to 2 effects. Firstly, PEG with a molecular weight of 4000 Da is a relatively large long-chain molecule which increases viscosity per se due to steric hindrance. Secondly, it is known that high-molecular-weight PEGs induce attractive protein-protein interactions by excluding volume from the environment of the proteins, which may also increase the mAb solution viscosity. The increase of viscosity due to Na2SO4 can be explained by its kosmotropic character. This kosmotropic effect strengthens the mAb-mAb interactions, which reduces the protein mobility, thus resulting in an increased viscosity.
The Tm values that have been calculated can be correlated directly with the thermal conformational stability of the antibody. The higher the Tm value is, the higher is the energy input required to unfold the protein. The high standard deviations at pH 5 and 120 mg/ml with and without glycine in solution could be due to the comparatively low intrinsic fluorescence of the antibody. With increasing mAb concentration, the standard deviations decrease due to the stronger fluorescence signal. The pH dependence of signal strength may be due to a changing flexibility of the molecule, which exposes more or less detectable fluorescence amino acids on the mAb surface. The high standard deviations observed for samples with PEG in solution may be due to the UV scattering of PEG itself, as it is a comparably big molecule and its UV signal may superpose the scattering of the protein of interest.
At low mAb concentrations, a second fluorescence shift (Tm2) is observed. This second shift reflects 2-step unfolding of the protein.Citation33 Assuming that the studied antibody has a thermal stability comparable to that of other mAbs, the Fab fragment of the mAb is most sensitive to heat treatment and denatures first. This assumption is underlined by the fact that the measured Tm1 values of 66°C are close to the Tm values of single-domain Fab reported by Menzen et al.Citation42 Partial unfolding of the variable region of the mAb does not take place at mAb concentrations higher than 60 mg/ml. The increased mAb concentration appears to enhance conformational stability of this region.
The Tm values decrease with increasing pH. The increased net charge of the amino acids at pH 5 results in a reduced density of a protein due to intramolecular repulsive electrostatic interactions.Citation70 The less-compact protein leads to a decrease of the Tm values. It is conceivable that the conformational change at pH 5 is accelerated with increasing mAb concentration due to additional attractive short-range interactions at 180 mg/ml.
At pH 7, slightly higher Tm values are detected in comparison to samples at pH 9. This underlines the findings of Razvi et al.,Citation71 who stated that the highest protein thermodynamic stability can be found under physiologic conditions. This implies that antibodies have the highest conformational stability under conditions similar to the extracellular matrix (pH 7.3), where they show the highest activity.
The increase of Tm of around 4% indicates that glycine and Na2SO4 stabilize the 3D structure of the mAb under high temperature conditions. Glycine as an osmolyte has the ability to preferably hydrate molecules. The kosmotropic sulfate ions of Na2SO4 suppress protein denaturation up to a protein-specific salt concentration by strengthening the intramolecular hydrophobic interactions.Citation60,37 The decreased thermostability of the protein due to the PEG molecules can be explained by the depletion attraction theory and an accompanied increased osmotic pressure.
The next section discusses thermal colloidal stability of the mAb solution by comparing the Tagg values under the conditions tested. The Tagg values indicate an increase in light scattering and, thus, can be correlated directly with the agglomeration of the molecules in solution at higher temperatures. A high Tagg value stands for a high thermal colloidal stability. It was observed that Tagg values increase with increasing mAb concentration. This phenomenon may be explained by a reduced movement of the molecules due to steric hindrance at 180 mg/ml. The reduced number of molecule collisions implies a deceleration of aggregation kinetics.
The higher Tagg values at pH 5 compared with pH 7 and pH 9 support the assumption that the colloidal stability of the mAb is highest at pH 5 due to stronger electrostatic repulsion. A major drop of Tagg values with PEG4000 in solution indicates an increase of mAb-mAb interactions due to the polymer. It is assumed that the reduced colloidal thermal stability is caused by similar mechanisms, such as the reduced conformational stability.
Na2SO4 is a kosmotropic salt and, hence, stabilizes the 3D structure, but it is also known to destabilize the colloidal stability of proteins.Citation37 Thus, temperature-induced unfolding is supposed to be reduced and aggregation of mAb molecules is deemed to be intensified by the addition of Na2SO4. Tagg values decreased by 12°C were observed in one specific case only. It is assumed that the changing salt-protein ratio causes the different effect. At higher protein or lower salt concentrations, the salt-protein ratio is lower, resulting in a lower impact of the kosmotropic salt, with the measured Tagg values remaining unchanged. This assumption was validated by increasing the salt concentration to 260 mM at a mAb concentration of 180 mg/ml (data not shown). Here, a certain drop of the Tagg values was observed similar to the Tagg decrease observed for a mAb concentration of 120 mg/ml.
Important information also is obtained from the location of Tagg and Tm in relation to each other. If Tagg is higher than Tm, it can be assumed that even under isothermal conditions, the molecule unfolds first and then aggregates and vice versa. Only at pH 7 and low mAb concentrations () and at pH 5 and mAb concentrations up to 180 mg/ml () do the Tagg values dominate over the Tm values. The discussed partial unfolding of the antibody at low concentrations, however, did not have any impact on thermal colloidal stability.
At pH 7 and pH 9 and mAb concentrations of 120 and 180 mg/ml, the Tm values dominate over the Tagg values. Under these conditions, aggregation kinetics is faster than unfolding kinetics. Summarizing these observations, it is found that the colloidal stability is lower at pH 7 and pH 9 in comparison to pH 5. However, conformational destabilization at pH 5 due to repulsive intramolecular interactions should be considered for optimal buffer selection.
As orthogonal predictive analytical parameters, ωCO values were calculated based on complex rheological measurements. The ωCO values decrease with increasing mAb concentration, which can be explained by the concomitant shortened distance between the individual molecules. At low concentrations, electrostatic forces dominate, which are repulsive for similarly charged molecules. In the case of a concentration increase, the influence of the short-range interactions, which have attractive properties and, thus, limit the mobility of the molecules in solution, is increased. This mobility constraint is associated with an increase in solution elasticity and, hence, with a reduction of the ωCO values.
At pH 5, the molecules in solution followed the applied movement up to high frequency values, also at higher mAb concentrations. This implies that even at high mAb concentrations the molecules moved along each other without strong resistance due to the strong repulsive interactions triggered by similar net surface charges of the molecules.
At pH 7 and pH 9, ωCO strongly decreased with increasing protein concentration. This implies that the type and strength of protein-protein or protein-solvent interactions changed when increasing the protein concentration at pH values close to the pI. It is assumed that short-range interactions in the high-concentration regime have a bigger impact on samples at pH 7 and pH 9 in comparison to samples at pH 5. As the impact of pH on the viscoelastic behavior is comparable to the impact on orthogonal analytical parameters, it is referred to in detail in the section ‘Initial Solution Characteristics: Size Exclusion Chromatography’ and in the section ‘Thermal Colloidal and Conformational Protein Stability’.
Glycine was found to reduce the ωCO values at pH 5. Glycine is a zwitter ion and has the ability to interact with the protein surface with both its negatively and positively charged groups.Citation72 The mAb molecule has a positive net charge at pH 5. The electrostatic repulsive interactions of the molecules were reduced by the specific interaction of glycine ions with positively charged surface groups of the mAb molecules. It has also been shown that glycine can interact with the peptide backbone of proteins, which plays an important role in protein stabilization.Citation73-75 This effect weakened at higher pH values. It is assumed that close to the pI of the molecule, the specific electrostatic interactions of negatively charged glycine ions and positively charged patches on the mAb surface are determined by the competition for water between the protein and the co-solute. This leads to the preferential exclusion of glycine from the protein surroundings and, hence, to an increased protein solubility. This observation agrees with the thermal stability enhancement we discussed in the section ‘Thermal Colloidal and Conformational Protein Stability’. It must be emphasized that glycine decreased the ωCO values at pH 5, but only down to 10000 rad/sec. This value is still above ωCO values calculated for samples at pH 7 and pH 9 without an additive in solution.
At pH 5 and pH 9, PEG4000 decreased the ωCO values considerably. As already described in the section ‘Protein Mobility: Viscosity Measurements’, the polymer may hinder molecular movement due to steric hindrance or due to the destruction of the protecting hydration shell of the mAb molecules.Citation76 It is assumed that the ωCO values at pH 9 and 200 mg/ml with PEG4000do not decrease any further, because the ωCO values without PEG4000 and similar conditions already were below 200 rad/sec, which is close to the lower detection limit of the instrument used (100 rad/sec).Citation77 The decreasing elastic behavior of mAb solutions at pH 7 may be explained by a decrease of short-range interactions caused by a specific binding of the non-polar PEG molecules on the molecular surface.Citation50,78
At pH 9 and low mAb concentrations, the sulfate ions of Na2SO4 strengthened hydrophobic interactions of the proteins of low charge. In this way, movement of the individual molecules was hindered, which led to a significant decrease of ωCO. It is assumed that at pH 7, the salt has a similar effect on the interactions of the mAb molecules than at pH 9. However, the adjusted pH value had such a strong influence on the rheological response of the samples that the effect of the salt on the solution's viscoelasticity was superposed by the pH effect. At pH 5, where the mAb molecules have a higher net surface charge, the concentration of sulfate ions was too low to induce strong hydrophobic interaction and, thus, a drop of the ωCO values.
The increase of ωCO values at pH 9 and higher mAb concentrations implies that the strength of protein-protein interaction decreases due to the addition of Na2SO4 as from an mAb concentration of 200 mg/ml. Du et al.Citation79 assumed that in highly concentrated protein solutions kosmotropic salts do not induce hydrophobic protein-protein interactions, but may compete with hydrophobic protein-protein interactions which are assumed to be the dominant stability-decreasing factor at pH 9. Additionally, concentration of the salt was kept constant in this study, while the mAb concentration increased. Consequently, the protein-salt ratio varied with increasing protein concentration.
It is assumed that at low mAb concentrations up to 150 mg/ml, the salting-out effect was dominant and caused an increased elasticity and lower ωCO values. At high protein-salt ratios, the salting-in effect might be dominant. Here, the salt interacts with charged residues and stabilizes the protein in solution. The mAb concentration-depending impact of Na2SO4 supports the assumption that the type of protein-protein interaction changes with increasing protein concentration.
To evaluate the predictive strength of the analytical methods applied, the results were merged, scored, and compared directly with the results of mAb long-term stability tests. The colloidal solution stability could be described very well with the help of the analytical toolbox and the defined scoring. The prediction of samples being most stable at pH 5, glycine having a stabilizing effect on mAb samples, and of Na2SO4 and PEG4000 having a destabilizing effect depending on pH and mAb concentration was confirmed by long-term stability tests. In particular, it has to be emphasized that the stabilizing character of Na2SO4 at pH 9 and 180 mg/ml and the strong destabilizing effect due to the addition of PEG4000 under similar conditions were described correctly.
However, the precipitation of the antibody at pH 7 with and without an additive in solution is not sufficiently visible. The scoring was pushed to values around 4 due to the impact of low viscosity values measured under these conditions. The viscosity differences between pH 5, pH 7, and pH 9 were explained by the electroviscous effect. This effect may be helpful to explain solution fluidity, but does not have any effect on the long-term colloidal stability, especially at mAb concentrations equal to or below 120 mg/ml. Here, the repulsive interactions at pH 5 expand the molecular size and, hence, increase viscosity. On the other hand, colloidal stability is increased due to strong electrostatic repulsion. SEC measurements, thermal stability tests, ζ-potential measurements, and the study of mAb viscoelasticity described the instability of mAb solutions at pH 7 correctly, thus compensating partly the wrong description based on viscosity measurements.
The protein concentration-dependent effect of the additives Na2SO4 and PEG4000 was described correctly, but the effect was damped due to the insensitivity of ζ-potential and thermal stability tests. In this study, the ζ-potential results contained important information for conditions where electrostatic interactions dominated the repulsive or attractive forces of dissolved proteins in solution. At higher protein concentrations and with the addition of additives, the factors influencing protein solution stability become more complex and cannot be depicted by protein surface charge characterization alone.
The results of thermal stability tests were more or less unaffected by the changing impact of the additives. Here, it becomes clear that processes in isothermal long-term stability tests may differ from those in accelerated temperature tests. The discrepancies between thermal and isothermal long-term stability tests have already been described,Citation15,18 but so far there is no explanation as to why and when the discrepancy occurs. Especially in the highly concentrated regime, it is therefore important to combine thermal stability tests and ζ-potential measurements with other biophysical characterization techniques to overcome these insensitivities.
The viscoelastic characterization of the mAb solutions was found to be a reliable tool to describe the behavior of the mAb molecules in the solution. However, the effect of protein concentration on the colloidal stability of the antibody was slightly overestimated. This overestimation may be due to the formation of structured mAb networks, which may increase the elastic portion of the probe and result in lower ωCO values, but have a positive impact on long-term colloidal stability.Citation80,81
The evaluation of protein mobility and rheology and the thermal stability studies of mAb solutions revealed a sensitivity of the colloidal solution stability of the studied antibody to mAb concentration, pH, additive type and concentration.
It was possible to describe the protein behavior and to characterize in detail the extent and type of protein-protein interaction. Furthermore, the study reveals the strengths and weaknesses of the different techniques applied. Description of the mAb phase behavior was possible only by a combination of these techniques.
Further studies are required (e.g., study of surface hydrophobicity) to refine the scoring of the applied analytical techniques for an even more precise description. Additionally, development of a high throughput-compatible setup of the used analytical tools should be part of future work for an easy and fast description of protein solution stability. Still, the presented and evaluated analytical toolbox represents a very important step toward easier buffer selection and optimization, with product stability being ensured.
Materials and methods
The humanized mAb used in this study has a molecular weight of 145.5 kDa and a theoretical pI of 8.7. It was kindly provided by Synthon Biopharmaceuticals B.V. The mAb was delivered with a monomer content of above 98% at pH 5.5 and a protein concentration of ∼30 mg/ml (hereinafter: Stock solution).
For this study, multi-component buffer systems containing CABS (Santa Cruz Biotechnology), CHES (AppliChem), MES, and TAPS (AppliChem), sodium acetate trihydrate (Fluka), sodium dihydrogen phosphate monohydrate (Merck), and TAPSO (Sigma-Aldrich) were used. The ionic strength of the buffer solutions was 10 mM.
Glycine (Sigma), PEG4000, and Na2SO4 (Merck) were used as additives. Ultrapure water (ISO3696) was used to prepare all solutions.
For buffer exchange and concentration of the samples, 20 ml and 40 ml Vivaspin ultrafiltration spin columns (Sartorius) with a molecular weight cut-off of 60000 Da were used. To prepare protein phase diagrams, 96-well micro-batch crystallization plates from Greiner Bio-One were used.
Experimental setup
Buffer and mAb preparation
For the experiments, multi-component buffers were prepared following the description of Kröner et al.Citation82 Buffers used in this study were adjusted with sodium chloride to an ionic strength of 6.7 mS/cm using the conductivity electrode CDM 230 (Radiometer Analytical). The mAb stock solution was buffer-exchanged and concentrated up to 250 mg/ml with Vivaspin columns and a rotational speed of 12300 g (fixed angle rotor, Eppendorf centrifuge 5810R). Subsequently, a protein dilution series with the corresponding buffer was prepared, so that after the addition of the second component, either a high-salt or low-salt buffer in a ratio of 1:5 (buffer:protein solution) to the required final protein concentration was obtained. The second component was added manually. After the components were mixed, an equilibration time of 15 min was kept before the analytical measurements were started.
All analytical runs were performed at 20°C and in duplicate at least.
Size exclusion chromatography
To study the mAb monomer content, the amount of HMW and LMW SEC runs were performed directly after sample preparation. The SEC measurements were done with an UHPLC system (Agilent) using an Acquity PLC BEH200 SEC column. The UV detector of the UHPLC system has an accuracy of 0.1 mAU. The samples were diluted with 100 mM phosphate buffer (pH 7.5) to a mAb concentration of 1 mg/ml. This buffer was also used as running buffer for all chromatography runs. The measurements were done with a flow rate of 0.3 ml/min and an injection volume of 2.5 µl. The UV signal at 280 nm was detected and processed by the Chromeleon 7.1 chromatography data system. The mass ratio of monomer, HMW, and LMW was calculated based on the areas of the detected peaks.
ζ-potential measurements
To study the surface potential of the target molecule, the ζ-potential was determined by laser Doppler micro-electrophoresis using the Zetasizer Nano ZSP (Malvern Instruments). According to the manufacturer, the sensitivity of this measurement tool is ± 2 mV. A voltage of 60 mV was applied to calculate the ζ-potential over the velocity of the molecules. The voltage was set to limit the current to a maximum of ± 5 mA and the number of runs were limited to 10. To determine the ζ-potential, disposable folded capillary cells and the diffusion barrier technique were used to reduce the sample volume to 20 µl. In this study, the ζ-potential of mAb solutions with a concentration of 10 mg/ml in a pH range from pH 5 to 11 without additives, with 15 mM glycine, 0.2 (m/V)% PEG4000 or 16 mM Na2SO4 was determined. The mAb and additive concentration was reduced by a factor of 10 to prevent electro-osmosis, which may occur in samples with an ionic strength greater than 150 mM.Citation83
Viscosity measurements
The viscosity was measured with the Viscosizer (Malvern Instruments) using Poiseuille flow. Here, the sample is automatically pumped through a microcapillary under constant drive pressure. The time (Δts) the sample needs to pass a set path length is measured and referenced against the time (Δtr) taken for a fluid of known viscosity. The relative viscosity values of mAb samples with 120 and 180 mg/ml protein content at pH 5, with and without 50–150 mM glycine, pH 7 with and without 50–150 mM glycine, 100–160 mM Na2SO4 and pH 9 with and without 50–150 mM glycine or 0.4–4 (m/V)% PEG4000 in solution were determined.
Thermal colloidal and conformational stability
To study the conformational and colloidal thermal stability of the mAb under varying conditions, a temperature ramp was run to force the protein to aggregate or/and to unfold. The measurements were performed with the UNit (Unchained Labs), where Tm and Tagg of 48 samples can be measured simultaneously. The Tm values were calculated at the inflection point of the curve developed when plotting the shift of the fluorescence signal over the applied temperature. For some samples, 2 inflection points could be calculated. For this reason, the parameter was additionally indexed with 1 for the first inflection point (Tm1) and 2 for the second inflection point (Tm2). The Tagg values were calculated based on the steepest slope that evolved when plotting the static light scattering signal over the applied temperature. The temperature ramp started at 20°C, ended at 90°C, and had a step width of 1°C/min. In this study samples with an mAb concentration of 5–180 mg/ml at pH 7 without additives and samples with mAb concentrations of 120 mg/ml and 180 mg/ml at pH 5, 7, and 9 with 50, 100, and 150 mM glycine, mAb concentrations of 120 mg/ml and 180 mg/ml at pH 7 and 100, 140, and 160 mM Na2SO4, and mAb concentrations of 120 mg/ml and 180 mg/ml at pH 9 with 0.4, 1.2, and 2 (m/V)% PEG4000 were screened.
Determination of protein solution viscoelasticity
To determine the storage modulus (G') and the loss modulus (G”), frequency sweep measurements were performed in a frequency range of 100–60000 rad/sec with the Piezo Axial Vibrator (PAV). The applied frequency range also defines the detection limit of the measurement tool. Following the publication of Schermeyer et al.,Citation30 the frequency value of the crossover point of G' and G,” ωCO, was used to compare the viscoelastic responses of the samples studied. The calculated ωCO values also served as predictive parameters. A description of the measurement tool and of the derivation of G' and G” can be found elsewhere.Citation30,77,84 The height of the measuring chamber was 15 µm. For the measurement, 35 µl of the sample were pipetted onto the measurement head. The measurement head was closed with a force of 2 Nm. In this study mAb solution with concentrations of 50, 120, 180, and 200 mg/ml at pH 5, 7, and 9 without additives, with concentrations of 50, 120, 180, and 200 mg/ml at pH 5, 7, and 9 with 150 mM glycine, 2 (m/V)% PEG4000, and 160 mM Na2SO4, respectively, were conducted.
Preparation of protein phase diagrams
To study the long-term solution stability of mAb, protein phase diagrams were prepared. For this purpose, a robotic liquid handling station (Tecan) was used following the method described by Baumgartner et al.Citation37 To achieve 96 conditions on one plate, 4 buffer troughs were prepared, including 2 low-salt and 2 buffers with one of the selected additives in a high concentration. A buffer plate was prepared with these solutions to obtain 6 additive concentrations ranging from 0–2.5 M glycine, 0–1.6 M Na2SO4, and 0–20 (m/V)% PEG4000. These conditions were then mixed with manually prepared mAb samples ranging from 0–250 mg/ml at a ratio of 1:5, resulting in a sample volume of 24 µl. One crystallization plate consisted of 2 pH values ranging from pH 5–9, mAb concentrations ranging from 120–225 mg/ml, and additive concentrations ranging from 0–200 mM glycine, 0–160 mM Na2SO4, and 0–2 (m/V)% PEG4000, respectively. After preparation, the plates were centrifuged for 1 min at 1540 g to reduce the air bubble content and covered using optically clear and UV compatible sealing tape (Duck Brands). The plates were then placed in an automated high-resolution imaging system (Rock Imager, Formulatrix). Every single well was photographed in specific time intervals. After 40 days, the samples were visually scored as colloidally stable, low precipitated, or precipitated. The preparation and incubation of the protein phase diagrams were done at 20°C.
Additionally, Fourier transform infrared spectroscopy (FTIR) measurements of the supernatant were performed to study the long-term conformational stability of the antibody under varying conditions. The results revealed that the 2D structure of the antibody did not change under the studied conditions after 40 d of incubation. The corresponding results are not shown here.
Disclosure of potential conflicts of interest
No potential conflicts of interest were disclosed.
Supplementary_Materials.pdf
Download PDF (494.5 KB)Acknowledgments
We would like to thank Synthon Biopharmaceuticals B.V. for the delivery of the mAb stock solution and the opportunity to carry out part of the experiments at the company site in Nijmegen. We gratefully acknowledge instrumental support by Norbert Willenbacher, Head of the Department of Applied Mechanics, Institute of Mechanical Process Engineering and Mechanics, KIT.
Funding
The authors would like to acknowledge the financial support by the Federal Ministry of Education and Research (BMBF) - funding code 0316071B.
Related Research Data
References
- Rosman Z, Shoenfeld Y, Zandmann-Goddard G. Biologic therapy for autoimmune diseases: An update. BMC Med 2013; 11:88; PMID:23557513; https://doi.org/10.1186/1741-7015-11-88
- Scott A, Wolchok J, Old L. Antibody therapy of cancer. Nat Rev Cancer 2012; 12:14; PMID:22437872; https://doi.org/10.1038/nrc3236
- Shire SJ, Shahrokh Z, Liu JUN. Challenges in the development of high protein concentration formulations. J Pharm Sci 2004; 93:1390-402; PMID:15124199; https://doi.org/10.1002/jps.20079
- Pindrus M, Shire S, Kelley R, Demeule B, Wong R. Solubility challenges in high concentration monoclonal antibody formulations: Relationship with amino acid sequence and intermolecular interactions. Mol Pharm 2015; 12:3896-907; PMID:26407030; https://doi.org/10.1021/acs.molpharmaceut.5b00336
- Leckband D, Sivasankar S. Forces controlling protein interactions: Theory and experiment. Cool Surfaces B Biointerfaces 1999; 14:83-97; https://doi.org/10.1016/S0927-7765(99)00027-2
- Chari R, Jerath K, Badkar A V, Kalonia DS. Long- and short-range electrostatic interactions affect the rheology of highly concentrated antibody solutions. Pharm Res 2009; 26:2607-18; PMID:19795191; https://doi.org/10.1007/s11095-009-9975-2
- Dill KA. Dominant forces in protein folding. Biochemistry 1990; 29:7133-55; PMID:2207096; https://doi.org/10.1021/bi00483a001
- Haezebrouck P, Joniau M, Van Dael H, Hooke SD, Woodruff ND, Dobson CM. An equilibrium partially folded state of human lysozyme at low pH. J Mol Biol 1995; 246:382-7; PMID:7877162; https://doi.org/10.1006/jmbi.1994.0093
- Monahan FJ, German JB, Kinsella JE. Effect of pH and temperature on protein unfolding and thiol/disulfide interchange reactions during heat-induced gelation of whey proteins. J Agric Food Chem 1995; 43:46-52; https://doi.org/10.1021/jf00049a010
- Kramer RM, Shende VR, Motl N, Pace CN, Scholtz JM. Toward a molecular understanding of protein solubility: Increased negative surface charge correlates with increased solubility. Biophys J 2012; 102:1907-15; PMID:22768947; https://doi.org/10.1016/j.bpj.2012.01.060
- Kumar V, Dixit N, Zhou LL, Fraunhofer W. Impact of short range hydrophobic interactions and long range electrostatic forces on the aggregation kinetics of a monoclonal antibody and a dual-variable domain immunoglobulin at low and high concentrations. Int J Pharm 2011; 421:82-93; PMID:21959107; https://doi.org/10.1016/j.ijpharm.2011.09.017
- Lehermayr C, Mahler HC, Mäder K, Fischer S. Assessment of net charge and protein-protein interactions of different monoclonal antibodies. J Pharm Sci 2011; 100:2551-62; PMID:21294130; https://doi.org/10.1002/jps.22506
- Parsegian AV. Van der Waals forces: A handbook for biologists, chemists, engineers, and physicists. Cambridge: Cambridge University Press; 2006
- Muramatsu N, Minton AP. Tracer diffusion of globular proteins in concentrated protein solutions. Proc Natl Acad Sci U S A 1988; 85:2984-8; PMID:3129721; https://doi.org/10.1073/pnas.85.9.2984
- Baumann P, Schermeyer M-T, Burghardt H, Dürr C, Hubbuch J. Prediction and characterization of the stability enhancing effect of the Cherry-Tag in highly concentrated protein solutions by complex rheological measurements and MD simulations. Int J Pharm 2017; SUBMITTED
- Weiss WF, Young TM, Roberts CJ. Principles, approaches, and challenges for predicting protein aggregation rates and shelf life. J Pharm Sci 2009; 98:1246-77; PMID:18683878; https://doi.org/10.1002/jps.21521
- He F, Woods CE, Trilisky E, Bower KM, Litowski JR, Kerwin BA, Becker GW, Narhi LO, Razinkov VI. Screening of monoclonal antibody formulations based on high-throughput thermostability and viscosity measurements: Design of experiment and statistical analysis. J Pharm Sci 2011; 100:1330-40; PMID:24081468; https://doi.org/10.1002/jps.22384
- Thiagarajan G, Semple A, James JK, Cheung JK, Shameem M. A comparison of biophysical characterization techniques in predicting monoclonal antibody stability. MAbs 2016; 8:1088-97; PMID:27210456; https://doi.org/10.1080/19420862.2016.1189048
- Thakkar S V, Allegre KM, Joshi SB, Volkin DB, Middaugh CR. An application of ultraviolet spectroscopy to study interactions in proteins solutions at high concentrations. J Pharm Sci 2012; 101:3051-61; PMID:22581726; https://doi.org/10.1002/jps.23188
- Scherer TM, Liu J, Shire SJ, Minton AP. Intermolecular interactions of IgG1 monoclonal antibodies at high concentrations characterized by light scattering. J Phys Chem B 2010; 114:12948-57; PMID:20849134; https://doi.org/10.1021/jp1028646
- George A, Wilson WW. Predicting protein crystallization from a dilute solution property. Acta Crystallogr D Biol Crystallogr 1994; 50:361-5; PMID:15299385; https://doi.org/10.1107/S0907444994001216
- Rosenbaum DF, Zukoski CF. Protein interactions and crystallization. J Cryst Growth 1996; 169:752-8; https://doi.org/10.1016/S0022-0248(96)00455-1
- Wilson WW. Light scattering as a diagnostic for protein crystal growth: A practical approach. J Struct Biol 2003; 142:56-65; PMID:12718919; https://doi.org/10.1016/S1047-8477(03)00038-8
- Ahamed T, Esteban B, Ottens M, van Dedem G, van der Wielen L, Bisschops M, Lee A, Pham C, Thömmes J. Phase behavior of an intact monoclonal antibody. Biophys J 2007; 93:610-9; PMID:17449660; https://doi.org/10.1529/biophysj.106.098293
- Saluja A, Badkar A V, Zeng DL, Nema S, Kalonia DS. Application of high-frequency rheology measurements for analyzing protein-protein interactions in high protein concentration solutions using a model monoclonal antibody (IgG2). J Pharm Sci 2006; 95:1967-83; PMID:16847932; https://doi.org/10.1002/jps.20663
- Rakel N, Baum M, Hubbuch J. Moving through three-dimensional phase diagrams of monoclonal antibodies. Biotechnol Prog 2014; 30:1103-13; PMID:25044865; https://doi.org/10.1002/btpr.1947
- Bauer KC, Göbel M, Schwab M-L, Schermeyer M-T, Hubbuch J. Concentration-dependent changes in apparent diffusion coefficients as indicator for colloidal stability of protein solutions. Int J Pharm 2016; 511:276-87; PMID:27421911; https://doi.org/10.1016/j.ijpharm.2016.07.007
- Liu J, Nguyen MDH, Andya JD, Shire SJ. Reversible self-association increases the viscosity of a concentrated monoclonal antibody in aqueous solution. J Pharm Sci 2005; 94:1928-40; PMID:16052543; https://doi.org/10.1002/jps.20347
- Macosko CW. Rheology : Principles, measurements, and applications. VCH; 1994; ISBN:978-0-471-18575-8
- Schermeyer M-T, Sigloch H, Bauer KC, Hubbuch J. Squeeze flow rheometry as a novel tool for the characterization of highly concentrated protein solutions. J Biotechnol Bioeng 2015; 113:576-587; PMID:26375304; https://doi.org/10.1002/bit.25834
- Metzger T. The rheology handbook: For users of rotational and oscillatory rheometers. 2nd ed. Vincentz Network GmbH & Co KG; 2006
- Webster S. Predicting long-term storage stability of therapeutic proteins. Pharm Tech 2013; 30(11).
- Vermeer AW, Norde W. The thermal stability of immunoglobulin: Unfolding and aggregation of a multi-domain protein. Biophys J 2000; 78:394-404; PMID:10620303; https://doi.org/10.1016/S0006-3495(00)76602-1
- Nicoud L, Sozo M, Arosio P, Yates A, Norrant E, Morbidelli M. Role of cosolutes in the aggregation kinetics of monoclonal antibodies. J Phys Chem B 2014; 118:11921-30; PMID:25243487; https://doi.org/10.1021/jp508000w
- Ladbrooke BD, Chapman D. Thermal analysis of lipids, proteins and biological membranes - A review and summary of some recent studies. Chem Phys Lipids 1969; 3:304-56; PMID:4905514; https://doi.org/10.1016/0009-3084(69)90040-1
- Yadav S, Shire SJ, Kalonia DS. Viscosity analysis of high concentration bovine serum albumin aqueous solutions. Pharm Res 2011; 28:1973-83; PMID:21491149; https://doi.org/10.1007/s11095-011-0424-7
- Baumgartner K, Galm L, Nötzold J, Sigloch H, Morgenstern J, Schleining K, Suhm S, Oelmeier S a., Hubbuch J. Determination of protein phase diagrams by microbatch experiments: Exploring the influence of precipitants and pH. Int J Pharm 2015; 479:28-40; PMID:25541147; https://doi.org/10.1016/j.ijpharm.2014.12.027
- Wang W, Singh S, Zeng DL, King K, Nema S. Antibody structure, instability, and formulation. J Pharm Sci 2007; 96:1-26; PMID:16998873; https://doi.org/10.1002/jps.20727
- Hussack G, Hirama T, Ding W, MacKenzie R, Tanha J. Engineered single-domain antibodies with high protease resistance and thermal stability. PLoS One 2011; 6:e28218; PMID:22140551; https://doi.org/10.1371/journal.pone.0028218
- Youssef AMK, Winter G. A critical evaluation of microcalorimetry as a predictive tool for long term stability of liquid protein formulations: Granulocyte Colony Stimulating Factor (GCSF). Eur J Pharm Biopharm 2013; 84:145-55; PMID:23333898; https://doi.org/10.1016/j.ejpb.2012.12.017
- Arakawa T, Tsumoto K. The effects of arginine on refolding of aggregated proteins: Not facilitate refolding, but suppress aggregation. Biochem Biophys Res Commun 2003; 304:148-52; PMID:12705899; https://doi.org/10.1016/S0006-291X(03)00578-3
- Menzen TA. Temperature-induced unfolding, aggregation, and interaction of therapeutic monoclonal antibodies. 2014
- Arakawa T, Timasheff SN. Theory of protein solubility. Methods Enzymol 1985; 114:49-77. PMID:4079776; https://doi.org/10.1016/0076-6879(85)14005-x
- Mason B, Zhang-van Enk J, Zhang L, Remmele R, Zhang J. Liquid-liquid phase separation of a monoclonal antibody and nonmonotonic influence of Hofmeister anions. Biophys J 2010; 99:3792-800; PMID:21112304; https://doi.org/10.1016/j.bpj.2010.10.040
- Wu SL, Karger BL. Hydrophobic interaction chromatography of proteins. Methods Enzymol 1996; 270:27-47. PMID:8803963; https://doi.org/10.1016/S0076-6879(96)70004-6
- Melander W, Horváth C. Salt effect on hydrophobic interactions in precipitation and chromatography of proteins: An interpretation of the lyotropic series. Arch Biochem Biophys 1977; 183:200-15; PMID:907351; https://doi.org/10.1016/0003-9861(77)90434-9
- Arakawa T, Bhat R, Timasheff SN. Preferential interactions determine protein solubility in three-component solutions: The MgCl2 system. Biochemistry 1990; 29:1914-23; PMID:2331471; https://doi.org/10.1021/bi00459a036
- Curtis RA, Lue L. A molecular approach to bioseparations: Protein-protein and protein-salt interactions. Chem Eng Sci 2006; 61:907-23; https://doi.org/10.1016/j.ces.2005.04.007
- Pusey PN, Poon WCK, Ilett SM, Bartlett P. Phase behaviour and structure of colloidal suspensions. J Phys Condens Matter 1994; 6:A29-A36; https://doi.org/10.1088/0953-8984/6/23A/004
- Tardieu A, Bonneté F, Finet S, Vivarès D. Understanding salt or PEG induced attractive interactions to crystallize biological macromolecules. Acta Crystallogr Sect D Biol Crystallogr 2002; 58:1549-53; PMID:12351859; https://doi.org/10.1107/S0907444902014439
- Hill TL. An introduction to statistical thermodynamics. Dover Publications; Mineola (New York); 1986
- Luangtana-Anan M, Limmatvapirat S, Nunthanid J, Chalongsuk R, Yamamoto K. Polyethylene glycol on stability of chitosan microparticulate carrier for protein. AAPS PharmSciTech 2010; 11:1376-82; PMID:20821174; https://doi.org/10.1208/s12249-010-9512-y
- Arakawa T, Timasheff SN. Mechanism of protein salting in and salting out by divalent cation salts: Balance between hydration and salt binding. Biochemistry 1984; 23:5912-23. PMID:6525340; https://doi.org/10.1021/bi00320a004
- Bruździak P, Panuszko A, Stangret J. Influence of osmolytes on protein and water structure: A step to understanding the mechanism of protein stabilization. J Phys Chem B 2013; 117:11502-8; PMID:23992436; https://doi.org/10.1021/jp404780c
- Arakawa T, Timasheff SN. Abnormal solubility behavior of beta-lactoglobulin: Salting-in by glycine and sodium chloride. Biochemistry 1987; 26:5147-53; PMID:3663650; https://doi.org/10.1021/bi00390a038
- Arakawa T, Tsumoto K, Kita Y, Chang B, Ejima D. Biotechnology applications of amino acids in protein purification and formulations. Amino Acids 2007; 33:587-605; PMID:17357829; https://doi.org/10.1007/s00726-007-0506-3
- Chen B-L, Arakawa T. Stabilization of recombinant human keratinocyte growth factor by osmolytes and salts. J Pharm Sci 1996; 85:419-22; PMID:8901081; https://doi.org/10.1021/js9504393
- Zhang MZ, Wen J, Arakawa T, Prestrelski SJ. A new strategy for enhancing the stability of lyophilized protein: The effect of the reconstitution medium on keratinocyte growth factor. Pharm Res 1995; 12:1447-52; PMID:8584478; https://doi.org/10.1023/A:1016219000963
- Jiskoot W, Crommelin D. Methods for structural analysis of protein pharmaceuticals. Springer Science & Business Media; Arlington (Virginia); 2005
- Laurance JS, Middaugh CR. Aggregation of therapeutic proteins. Wiley; Hoboken (New Jersey); 2010
- Piazza R. Protein interactions and association: An open challenge for colloid science. Curr Opin Colloid Interface Sci 2004; 8:515-22; https://doi.org/10.1016/j.cocis.2004.01.008
- Halle B. Protein hydration dynamics in solution: A critical survey. Philos Trans R Soc Lond B Biol Sci 2004; 359:1207-23; PMID:15306377; https://doi.org/10.1098/rstb.2004.1499
- Booth F. The electroviscous effect for suspensions of solid spherical particles. Proc R Soc London A Math Phys Eng Sci 1950; 203:533-551; https://doi.org/10.1098/rspa.1950.0155
- Harding S. Dilute solution viscometry of food biopolymers. In: Hill S, Ledward D, Mitchel J, editors. Functional properties of food macromolecules. Aspen: Springer; 1998. page 10-5
- Tanford C, Buzzell JG. The viscosity of aqueous solutions of bovine serum albumin between pH 4.3 and 10.5. J Phys Chem 1956; 60:225-31; https://doi.org/10.1021/j150536a020
- Buzzell JG, Tanford C. The Effect of charge and ionic strength on the viscosity of ribonuclease. J Phys Chem 1956; 60:1204-7; https://doi.org/10.1021/j150543a014
- Salinas BA, Sathish HA, Bishop SM, Harn N, Carpenter JF, Randolph TW. Understanding and modulating opalescence and viscosity in a monoclonal antibody formulation. J Pharm Sci 2010; 99:82-93; PMID:19475558; https://doi.org/10.1002/jps.21797
- Connolly BD, Petry C, Yadav S, Demeule B, Ciaccio N, Moore JMR, Shire SJ, Gokarn YR. Weak interactions govern the viscosity of concentrated antibody solutions: high-throughput analysis using the diffusion interaction parameter. Biophys J 2012; 103:69-78; PMID:22828333; https://doi.org/10.1016/j.bpj.2012.04.047
- Wang S, Zhang N, Hu T, Dai W, Feng X, Zhang X, Qian F. Viscosity-lowering effect of amino acids and salts on highly concentrated solutions of two IgG1 monoclonal antibodies. Mol Pharm 2015; 12:4478-87; PMID:26528726; https://doi.org/10.1021/acs.molpharmaceut.5b00643
- Wen J, Jiang Y, Nahri L. Effect of carbohydrate on thermal stability of antibodies. Am Pharm Rev 2008; 11:1-6
- Razvi A, Scholtz JM. Lessons in stability from thermophilic proteins. Protein Sci 2006; 15:1569-78; PMID:16815912; https://doi.org/10.1110/ps.062130306
- Bye JW, Falconer RJ. Three stages of lysozyme thermal stabilization by high and medium charge density anions. J Phys Chem B 2014; 118:4282-6; PMID:24684707; https://doi.org/10.1021/jp412140v
- Liu Y, Bolen DW. The peptide backbone plays a dominant role in protein stabilization by naturally occurring osmolytes. Biochemistry 1995; 34:12884-91; PMID:7548045; https://doi.org/10.1021/bi00039a051
- Platts L, Falconer RJ. Controlling protein stability: Mechanisms revealed using formulations of arginine, glycine and guanidinium HCl with three globular proteins. Int J Pharm 2015; 486:131-5; PMID:25818064; https://doi.org/10.1016/j.ijpharm.2015.03.051
- Street TO, Bolen DW, Rose GD. A molecular mechanism for osmolyte-induced protein stability. Proc Natl Acad Sci U S A 2006; 103:13997-4002; PMID:16968772; https://doi.org/10.1073/pnas.0606236103
- Arakawa T, Timasheff SN. Mechanism of polyethylene glycol interaction with proteins. Biochemistry 1985; 24:6756-62; PMID:4074726; https://doi.org/10.1021/bi00345a005
- Kirschenmann L. Aufbau zweier piezoelektrischer Sonden (PRV / PAV) zur Messung der viskoelastischen Eigenschaften weicher Substanzen im Frequenzbereich 0.5 Hz-2 kHz bzw. 0.5 Hz– 7 kHz. 2003
- Ingham KC. Polyethylene glycol in aqueous solution: Solvent perturbation and gel filtration studies. Arch Biochem Biophys 1977; 184:59-68; PMID:921299; https://doi.org/10.1016/0003-9861(77)90326-5
- Du W, Klibanov AM. Hydrophobic salts markedly diminish viscosity of concentrated protein solutions. Biotechnol Bioeng 2011; 108:632-6; PMID:21246510; https://doi.org/10.1002/bit.22983
- Charlton LM, Barnes CO, Li C, Orans J, Young GB, Pielak GJ. Residue-level interrogation of macromolecular crowding effects on protein stability. J Am Chem Soc 2008; 130:6826-30; PMID:18459780; https://doi.org/10.1021/ja8005995
- Minton AP. Influence of macromolecular crowding upon the stability and state of association of proteins: Predictions and observations. J Pharm Sci 2005; 94:1668-75; PMID:15986476; https://doi.org/10.1002/jps.20417
- Kröner F, Hubbuch J. Systematic generation of buffer systems for pH gradient ion exchange chromatography and their application. J Chromatogr A 2013; 1285:78-87; PMID:23489486; https://doi.org/10.1016/j.chroma.2013.02.017
- Clogston JD, Patri AK. Zeta potential measurement. Methods Mol Biol 2011; 697:63-70; PMID:21116954; 10.1007/978-1-60327-198-1_6
- Crassous JJ, Régisser R, Ballauff M, Willenbacher N. Characterization of the viscoelastic behavior of complex fluids using the piezoelastic axial vibrator. J Rheol (N Y N Y) 2005; 49:851; https://doi.org/10.1122/1.1917843