
ABSTRACT
Amino acid sequence variation in protein therapeutics requires close monitoring during cell line and cell culture process development. A cross-functional team of Pfizer colleagues from the Analytical and Bioprocess Development departments worked closely together for over 6 years to formulate and communicate a practical, reliable sequence variant (SV) testing strategy with state-of-the-art techniques that did not necessitate more resources or lengthen project timelines. The final Pfizer SV screening strategy relies on next-generation sequencing (NGS) and amino acid analysis (AAA) as frontline techniques to identify mammalian cell clones with genetic mutations and recognize cell culture process media/feed conditions that induce misincorporations, respectively. Mass spectrometry (MS)-based techniques had previously been used to monitor secreted therapeutic products for SVs, but we found NGS and AAA to be equally informative, faster, less cumbersome screening approaches. MS resources could then be used for other purposes, such as the in-depth characterization of product quality in the final stages of commercial-ready cell line and culture process development. Once an industry-wide challenge, sequence variation is now routinely monitored and controlled at Pfizer (and other biopharmaceutical companies) through increased awareness, dedicated cross-line efforts, smart comprehensive strategies, and advances in instrumentation/software, resulting in even higher product quality standards for biopharmaceutical products.
Introduction
Mammalian expression systems, particularly Chinese hamster ovary (CHO) cell lines, have yielded a plethora of safe and efficacious biologics that have substantially contributed to current medical care.Citation1–Citation4 Unlike microbial hosts, mammalian systems synthesize biologically active protein therapeutics by imparting proper protein folding and post-translational modifications.Citation5 In pursuit of ever-increasing titers to meet high worldwide demand and offset costs of medicines, bioprocess technologies and approaches for cell line and cell culture process development continue to evolve and improve at a steady rate. At the same time, analytical techniques and methods continue to reach higher sensitivities and selectivities, while software analysis tools have become more sophisticated, thereby affording increasingly reliable, accurate and rapid identification of low-level product proteoforms.Citation6–Citation8 Over the past decade, sequence variants (SVs), which are subtle, unintended amino acid substitutions found in a particular population (percentage) of secreted protein, have emerged as a pervasive problem in mammalian expression systems at several biopharmaceutical companies,Citation9 including Pfizer. The rapid onset of reports about SVs prompted researchers to ask several key questions: 1) are we pushing the productivities of our cell lines and bioreactor processes too far; 2) are we diving too deep into the baseline signals of the analytical data; and 3) have SVs been present the whole time?
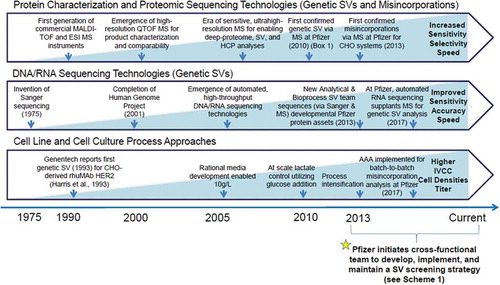
Since the late 2000s, modern proteomic techniques have progressively exposed SVs in the primary sequence of monoclonal antibodies (mAbs) and other recombinant therapeutic proteins at both high (≥ 1%) and low (< 1%) levels.Citation10 As shown in , protein sequencing technologies involved in SV detection, identification, and quantitation with respect to evolving cell line and cell culture process approaches and genetic sequencing technologies have steadily advanced. Whether or not advances in sequencing analytics, evolving cell line and culture process development practices or progressive increases in titers via process intensification have influenced the increased discovery, identification and occurrence of SVs remains unanswered, but healthy debate on potential patient safety and drug efficacy concerns is ongoing and underpins the importance of routine monitoring of these particular species as part of cell line and culture process development and the evolving manufacturing control strategies.Citation11 To the best of our knowledge, no clinical effects due to SVs have been observed or reported to date for recombinant therapeutic proteins.
Figure 1. The evolution of protein characterization and proteomic analyses, DNA/RNA sequencing, and cell line and cell culture process approaches. The advances in mass spectrometric sensitivity and selectivity, depicted above, initially brought forward reliable detection of genetic SVs and low-level misincorporations in mammalian therapeutic protein candidates, but more recently, DNA/RNA sequencing technologies have supplanted MS techniques as the go-forward, routine genetic SV detection method at Pfizer due to ease-of-sample preparation, lower costs, and speed. Likewise, amino acid analysis (AAA) was implemented for routine, batch-to-batch monitoring of potential cell culture process-related misincorporations. With these two changes, valuable MS resources could be redeployed more effectively for the final, detailed check of product quality and potential SVs from the commercial-ready cell line and cell culture process (an activity that occurs after final clone nomination and Phase 1 clinical manufacture; see Scheme 1, SV Screen 3a and 3b).
Cell lines and cell culture processes are evaluated for SVs at the start of process and product development. Genetic SVs are discrete amino acid changes in the secreted protein that commonly arise due to different types of single-base mutations such as error-prone DNA repair mechanisms, frame shifting, deletions and rearrangements.Citation12,Citation13 In-depth studies on genetically-derived SVs are an active area of research,Citation14–Citation18 although the root cause of genetic SVs remains to be fully understood. Amino acid misincorporations are another common SV type that can result from non-optimized codon usage, tRNA mischarging or codon-anticodon mispairing.Citation19,Citation20 However, in practice, assuming codon optimization was performed for the cellular host, misincorporations arise most often due to unbalanced cell culture conditions where depletion of one or more amino acid nutrients occurs, which causes corresponding amino acid substitutions. The extent of misincorporations, in terms of relative abundances and the number of affected, individual sites, usually increases with the degree of nutrient depletion. Supplementation of the depleted amino acid(s) is commonly done to mitigate misincorporations.Citation16,Citation21,Citation22 Identifying and understanding the propensity for both genetic SVs and low-level misincorporations is highly relevant to biopharmaceutical companies and regulatory agencies due to potential adverse effects such as protein misfolding, altered biological function, reduced efficacy, aggregate formation, and unknown immunogenic effects.Citation23 Therefore, active screening of cell lines at the clone selection stage and during development of the commercial-ready cell culture production process can be implemented to prevent both genetic and culture process-related SVs.
Here, we describe the evolution of both genetic and analytical SV screening approaches at Pfizer that occurred over the course of ~ 6 years. During this time, both genetic SVs and non-genetic misincorporations were observed and then successfully rectified. We also highlight the substantial advantages conferred when analytical and bioprocess groups work together, and co-own SV analysis and outcomes, especially when mitigation steps are needed. Herein, we work stepwise through our cross-departmental SV detection, identification and quantification experiences, and provide rationale for in-place cross-functional strategies, workflows and action levels for SV-containing cell lines and processes at each drug development stage. This experience drives home the importance of orthogonal SV screening methods and postulates on the future state of SV analytics.
Initial identification of SVs in CHO-derived biopharmaceuticals
Amino acid sequence heterogeneity has long been seen in microbial systems, but was first observed in mammalian cells at Genentech in the early 1990s via trypsin peptide mapping.Citation24 Since 2009, especially given the advancements of large-scale, quantitative proteomic techniques and their increased use in process and product development labs, reports of both genetic and culture-process derived SVs in products from both microbial and mammalian systems began appearing from multiple peer biotechnology companies.Citation9 At Pfizer, our first experience with SVs involved a recombinant mAb produced in CHO cells, where two high level (~ 30%) SVs were detected by liquid chromatography/mass spectrometry (LC/MS)-subunit analysis (see ). At the time, standard cell line development methods included Sanger sequencing of bulk cDNA from the recombinant cells, which had revealed no SVs. To determine SV sites and levels in the genetic material, cDNA was analyzed by a more sensitive method, extensive clonal sequencing (ECS) (see ). The enhanced cDNA sequencing results yielded two SVs that both qualitatively and quantitatively agreed with the LC/MS results. Subsequent team and management discussions determined that by choosing a new cell line (with no detectable SVs after genetic and MS screening), and thereby incurring a short term delay in the project timelines, Pfizer would avoid future clinical and regulatory hurdles. This initial SV event was counted as a highly unusual anomaly, especially because SVs in Pfizer products had never been detected before and both genetic SVs were detected at high levels in the same mAb. Several months later, individual genetic SVs were detected and orthogonally confirmed in four more developmental therapeutic proteins from four new cell lines by both LC/MS and ECS (cDNA sequencing) in a synergistic manner.
Formation of a cross-functional SV analysis team to drive change
The presence of these new genetic SVs caused elevated concern in late 2011 and a subsequent call for prioritized, thorough sequencing of additional Pfizer developmental therapeutic protein assets. During this expanded sequencing effort, initial SV detection by either the Analytical MS group or Cell Line Development group resulted in back-and-forth communication to ensure that the orthogonal genetic and proteomic confirmation of site localization and relative abundance were in agreement. At the same time, the highly similar results from both groups continued to provide “validation” of the emerging orthogonal SV screening approach and respective methods. Additionally, there was an industry-wide increase in published SV literature and conference reports in the early 2010s that resulted in further pressure to understand SVs and develop control strategies. All of these developments prompted a distinct shift towards heightened SV awareness in the Pfizer Analytical and Bioprocess development organizations and elicited questions such as: 1) What is an acceptable level of SV for internal process development and what are the external regulatory requirements? 2) What factors contribute to or impact SVs? and 3) How and at what point in process and product development can SVs be eliminated or controlled?
Preliminary findings and continued detection of genetic SVs have repeatedly shown excellent correlation between genetic and analytical methods, especially in terms of SV transcript and protein level. The concerted, on-going effort between the Analytical MS and Cell Line Development groups prompted the Pfizer Biotherapeutics leadership team to recommend the formation of a cross-functional, multi-disciplinary group in 2012 from the aforementioned groups, as well as the Culture Process Development group. This new “SV Analysis Team” was to be responsible for implementing industry-leading methodologies and establishing a consolidated roadmap across the bioprocess and analytical groups to afford reliable detection, identification and quantitation of genetic SVs and misincorporations, in addition to confirmatory product quality attribute testing of the protein product. One of the first tasks was to rapidly prioritize the genetic and protein sequencing of remaining developmental Pfizer assets (i.e., the master cell bank and representative final drug substance) within a 6-month period. The team would also be responsible for evaluating new technologies, establishing SV action levels for clone selection and culture process development, and driving the strategic position on SVs in the Biotherapeutics Pharmaceutical Sciences organization, including trending SV data, providing guidance to project teams, educating colleagues, and communicating team activities and progress via periodic internal and external seminars. This “SV Analysis Team” epitomized open and successful communication between departments and illustrated the virtues of hand-in-hand collaborative partnerships across distinct lines. Biopharmaceutical companies typically are set up organizationally such that their bioprocess and analytical groups are separate. A lesson learned here is that the open, effective collaboration between these two groups is necessary to uphold product quality standards and minimize any extensions to project timelines.
Initial SV analysis roadmap
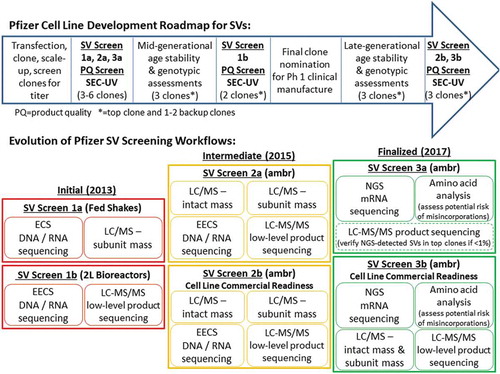
The SV Analysis Team established an initial SV testing paradigm in 2013 that included two SV screening stages along the Pfizer Cell Line Development roadmap for programs heading to Phase 1 clinical manufacture (; SV Screen 1a and 1b). Briefly, in the Cell Line Development roadmap, a large number of single-cell derived clones are first screened for titer after transfection. Following multiple stages of scale up, a final subset of top clones (3–6) is selected based on titer, growth, gene copy number, metabolic profiles, and a screen of product quality endpoints: primarily high molecular mass species levels (HMMS; aggregation) and genetic SVs. Research cell banks (RCBs) are generated for these top clones and all generational time points described herein are from the respective cell bank (RCB = generation 0). The SV Analysis Team introduced the first SV testing point in the Cell Line Development roadmap immediately after identification of the top 3–6 clones (; SV Screen 1a). Here, the top 3–6 clones were subjected to ECS (cDNA sequencing), and the secreted protein from the respective shake flasks was analyzed by LC/MS-subunit analysis. If a genetic SV was detected by both methods at this stage, then the specific cell clone was promptly eliminated from consideration and the other clones were progressed forward.
Stability assessments are performed next in the Cell Line Development roadmap. Here, both genotypic and phenotypic characteristics are examined for the top 3 clones at mid-generational age (50 cumulative generations) to identify lead and backup clones for final clone nomination. The second SV screening point was placed between the mid-generational age stability assessments and final clone nomination to evaluate the 2 L (1 L working volume) bioreactor cultures for possible, newly-formed SVs (; SV Screen 1b). This second SV testing point included more sensitive techniques (e.g., expanded ECS (EECS; see ; cDNA sequencing), trypsin LC-MS/MS-peptide mapping (see ; peptide sequencing)) as the final check prior to clone nomination.
The two stages of SV screening and the combined genetic and proteomic methods provided redundant, orthogonal confirmation of potential genetic SVs, as well as any non-genetic misincorporations (if present). Regarding SV action levels, cell clones were progressed to the final clone nomination stage in the Cell Line Development roadmap if there were no detectable single-base mutations ≥ 2% following EECS (i.e., relative abundance equals number of wells with genetic mutations/288 total wells x 100%) and no detectable genetic or non-genetic SVs in the secreted product > 0.1% (per site) following LC-MS/MS (i.e., relative abundance equals SV-modified peptide/[unmodified peptide + SV-modified peptide] x 100%). With this new level of detection and use of complementary genetic and proteomic methods, both the lead and backup clones were more confidently chosen. SV screening at two points in the Cell Line Development roadmap with orthogonal genetic and proteomic methods was carried out successfully for two years on more than 20 new projects, building valuable institutional experience. Again, any cell clones producing protein products with genetic SVs were eliminated from consideration and not progressed to ensure no future impacts to clinical programs in terms of quality, safety and efficacy. In particular, SV abundance can go higher or lower with additional manufacturing experience (i.e., scale-up activities, process improvements, and manufacturing site changes), introducing possible risk to clinical programs, especially for Phase 3 clinical trials. SVs also can impact regulatory opinion: high-level SVs ultimately may not be acceptable, and low-level SVs likely will require extra batch-release testing/monitoring in quality control labs. The initial success of the routine SV testing roadmap assembled by the cross-functional SV Analysis Team restored confidence in Pfizer’s Cell Line Development roadmap and procedures, and in the quality of expressed products with respect to potential SVs.
Addition of product quality assessments at clone selection in cell line development
During 2014, there was a sharp decline in the detection of genetic mutations, in part due to the new rigorous SV screening methods along the “initial” Cell Line Development roadmap for clone selection and nomination (; SV Screen 1a and 1b). However, there was an increase in the observation of low-level misincorporations (see ) at both screening points during clone selection via LC/MS – subunit analysis and LC-MS/MS based on improving software analysis tools and our newly acquired SV analysis experience. Fed shake-flask cell cultures commonly showed detectable levels of one or more residual misincorporations globally throughout the protein sequence at < 0.1% per site. The fed shake-flask format, however, was not considered to be representative of the larger scale (2–250 L) bioreactor runs, where the latter is considered the “gold standard”. In particular, for fed shake flasks, the cell culture conditions (e.g., pH, dissolved oxygen) cannot be tightly controlled and the production media and feed are different from that used in the intended clinical manufacturing cell culture process. Essentially, it was unclear if the misincorporations were a valid cell line/culture process effect or induced by the less controlled-nature of fed shake flask cell cultures.
As an example, in 2014 a unique situation occurred where LC/MS-subunit analysis detected higher level misincorporations of a particular type at the 1% level (cumulative, all sites) in both the mAb light and heavy chains for the two top clones (114 and 163) at the fed shake-flask stage. Two additional “top clones” (40 and 70), expressed mAb with the same misincorporations at the 0.1% level (cumulative, all sites), but these clones and clone 114 were deemed medium priority due to lower titers. All clones, however, showed strong growth and viability. The various misincorporation sites determined by LC-MS/MS were not codon specific, indicating that the media likely needed to be supplemented with additional amounts of the depleted amino acid. For the final nominated top clone, 163, an increasing total supplement of the depleted amino acid (production media plus feed) was consistently required at each stage of process scale up from fed shake flask to pilot manufacturing to keep all misincorporations < 0.1% per site, indicating this particular phenomenon was perhaps more of a phenotypic property of the cell clone. Better detection, minimization and control of misincorporations at the earliest stages of clone selection will ensure that the best clones are selected for process development, especially given that misincorporations can be remedied during cell culture process optimization.
Around the same time (i.e., in 2014), advanced microscale bioreactors (ambr®) were in the process of being implemented in place of the long-standing fed-shake flask analysis for overall more efficient and controlled cell cultures. At that time, implementation of ambr held great promise for enhanced clone screening, product quality assessments, and misincorporation analysis. As an added benefit for process development, ambr vessels used the same production media and feed as larger scale bioreactors. This was important because cell culture process intensification efforts had just started in 2013, where higher cell densities and new, richer production media feeds were introduced to reach higher titers and productivity in future commercial processes, all of which theoretically could increase the risk for misincorporations. Initial protein materials produced from ambr had been demonstrated by the Cell Line Development group to be more representative of protein materials from 2 L and large/commercial-scale bioreactors, in comparison to those from fed shake flasks, based on product quality endpoints from multiple programs.
Along the same lines, the SV Analysis Team also sponsored an ambr study to better understand if misincorporation levels and product quality attributes were comparable between the 15 mL ambr vessels and 2 L (1 L working volume) glass bioreactors (gold standard in this study). Here, three different mAbs, encoded by three specific cell clones, were expressed and cultured in ambr and 2 L bioreactors with the same production media and feed rate; samples were taken on days 6 and 12 (harvest). For all three clones, similar cell growth, viability, and titers were observed. As an example, the low-level Val to Ile misincorporation levels (cumulative, all sites) showed consistent trending via LC-MS/MS, where in the first two clones, the levels remained steady at 0.04% and 0.1%, respectively, for both ambr and the 2 L bioreactor at both time points. In the third clone, there was a consistent increase in Val to Ile misincorporation levels from 0.1% at day 6 to 1%, at day 12 for both ambr and the 2 L bioreactor. In terms of product quality assessments, the experimental N- and C-terminal proteoform levels and individual N-linked glycan levels determined by LC-MS/MS were very similar in the secreted materials from the ambr and 2 L bioreactors at both day 6 and 12. In general, the misincorporation and product quality attribute levels in the ambr samples were highly comparable to the 2 L bioreactor samples. Therefore, both the fed shake flask and 2 L glass bioreactor formats for cell line development clone screening were quickly replaced by the more compact, efficient, effectively controlled ambr system at the clone selection stage.
Thus, because multiple studies demonstrated that ambr produced mAb with product quality profiles representative of larger manufacturing scales, the team decided that the LC/MS-subunit analysis and LC-MS/MS data acquired at the initial clone evaluation stage (; SV Screen 1a and 1b) should be interrogated for different product quality attributes to better ensure that the intended secreted protein product contained the expected post-translational modifications in the typical proportions. LC/MS-intact mAb analysis, which allows for elucidation of the major and minor product proteoforms of the intact 4-chain mAb, was also added to the initial clone testing stage (; see new “Intermediate” SV Screen 2a). This third MS-based method allows the evaluation of trisulfideCitation25 and glycation levels (after de-N-glycosylation), as well as any other reducible and/or labile protein modifications. As such, any aberrant “molecular profiles” pertaining to, for example, N-glycosylation, N-/C-terminal heterogeneity or trisulfides, could be eliminated prior to clone nomination. Early-on, a few clones were eliminated due to high aglycosylation levels and atypically elevated C-terminal lysine, but in these cases, the respective titers were correspondingly low and elimination was imminent. However, while it is important to take note of unexpected molecular profiles, there is also concern that a top clone with high titer could be potentially eliminated, especially considering that the “molecular profile” could be corrected during cell culture process development. As a pertinent example, particular high-titer cell clones cultured in ambr vessels sometimes secrete mAb with elevated trisulfides, creating a situation where these clones could be mistakenly eliminated from consideration, but, in reality, the culture process parameters in larger bioreactors can be adjusted to appropriately attenuate trisulfides to baseline levels for final drug substance. While top clones are primarily nominated based on high titer, it is current practice at Pfizer (as described above) to also consider the cellular genotypic and phenotypic characteristics of each clone, the SV analysis results, and the quality attribute profile of the secreted product with respect to the projected future success of a particular clone in becoming a commercially viable cell line and cell culture process based on past institutional experiences and remediation efforts.
To conclude, in terms of SV analysis, evaluation of the top 3–6 clones in ambr vessels with a “small-scale” version of the intended clinical manufacturing process substantially reduced the chance of artificial misincorporations observed with fed shake flasks, allowing for potential misincorporations due to phenotypic differences to be clearly detected. Ambr vessels also allow valid product quality assessments via all three MS-based methods and conventional biochemical batch-release assays (i.e., SEC-UV and others).
Enhanced analytical results are essential for development of more robust, commercially ready cell lines and culture processes. At present, the LC/MS-based, bioinformatics-driven, trypsin peptide mapping, multi-attribute method (MAM),Citation26 which promotes quality-by-design principles, is poised to transform analytical product quality assessments in the near future. Currently, for routine product quality monitoring, biopharma companies are considering a substantial transition: moving away from the execution of several, conventional profile-based, batch-release assays, where chromatographic peaks often represent mixtures of product proteoforms/attributes, to MAM, a single assay that is capable of simultaneous detection, identification, quantitation, and quality control (monitoring) of individual molecular attributes, including N-linked glycan structures, aglycosylated species, N-/C-terminal proteoform heterogeneity, charge-based proteoforms, polypeptide fragments/oxidation, and SVs (if needed). MAM has the potential to further streamline and advance cell line and culture process development efforts via superior information.
Towards a more streamlined SV screening paradigm in cell line development
Because large process and product development organizations progress many projects concurrently, timelines are tight and resources are continuously constrained. As such, over a two-year period, the two-week turnaround timeline for the two labor-intensive SV screening methods, EECS and LC-MS/MS, became more and more difficult to meet prior to clone nomination in the initial SV workflow (; SV Screen 1b) due to competing priorities, even with optimization of all logistics. In addition to the two-week turnaround, both methods demanded a right-first-time approach to ensure robust results and confidence for the final clone nomination meeting. In response, a new “intermediate” SV screening workflow was conceived in 2015 (; SV Screen 2a and b). The new screening approach was solely based on ambr bioreactors to afford more reliable SV and product quality assessments. Here, the SV Analysis Team decided that EECS would be performed upfront on the top 3–6 clones (; SV Screen 2a), and run in parallel to mid-generational age stability assessments, providing more time for laboratory work and data analysis. This approach also eliminated duplicate ECS/EECS sequencing efforts, and provided higher sensitivity genetic sequencing at the initial clone screen stage. Likewise, LC-MS/MS also was shifted forward similar to EECS (; SV Screen 2a), which provided over 4 weeks for a less rushed, more thorough analysis of the top 3–6 clones. Lastly, LC/MS-subunit analysis was maintained to ensure 100% sequence coverage for SV analysis, and to deliver the heightened characterization product quality assessments. And as discussed above, LC/MS-intact mAb analysis was added to orthogonally monitor the overall product proteoform quality profile, including N-glycosylation patterns, aglycosylation, terminal heterogeneity, trisulfides, and glycation. Thus, in , the two SV analysis checkpoints, SV Screen 1a and 1b, along the Cell Line Development roadmap, were consolidated into one screening event, SV Screen 2a. However, this time-saving consolidation required a risk assessment to ensure that SVs would not be missed. This assessment resulted in the determination that all 3–6 clones would have to be analyzed upfront at SV Screen 2a () with both genetic and protein sequencing assays, as opposed to only the lead and back-up clones previously evaluated (; SV Screen 1b). Over the next two-year period (2015–2017), the “intermediate” SV screen workflow again was shown to effectively ensure that the final nominated cell line was suitable for future clinical manufacturing campaigns and commercial-ready processes, but in a more streamlined manner.
Cell line and culture process commercial readiness
When clinical performance for investigational medicines meets and exceeds expectations, project timelines start rapidly accelerating. Having a robust and stable cell line at late-generational age is then critical for development of a manufacturing process for Phase 3 and commercial launch. At Pfizer, a commercial cell line readiness strategy was developed in 2015 to confirm lead cell lines for working cell bank production. This strategy primarily extended the cell line phenotypic and genotypic stability screen for 20 weeks after clone nomination (which occurs at 50 generations) to approximately 100–130 generations. At this late-generational node (; SV Screen 2b), cell lines are checked again for consistent phenotypic and genotypic properties, as well as genetic SVs using EECS. Orthogonal LC/MS-subunit analysis and LC-MS/MS are used to cross-check the EECS results, and to screen for potential process-related misincorporations. Additionally, the expressed product from these appropriately aged cell lines undergoes detailed product quality assessment with routine biochemical batch-release assays and all three MS-based heightened characterization methods, including LC/MS-intact mAb analysis (; SV Screen 2b). This establishes a commercial-ready cell line, which, in the end, produces drug substance of the highest quality, efficacy and safety while being SV-free above 0.1%.
Once the commercial-ready cell line is established, then development of the commercial-ready cell culture process commences. Briefly, throughout the cell culture production bioreactor optimization activities, amino acid analysis (AAA) is performed in a time course format (i.e., days-in-culture) on conditioned medium samples from every experimental batch to ensure adequate nutrient levels over the ~ 12-day bioreactor runs. The top two “culture process options” are identified from the optimization studies, and these two batches are tested by a battery of biochemical batch-release assays for product quality (e.g., released N-glycan profile, charge proteoform profile, fragment levels, aggregate levels, biological activity), as well as LC-MS/MS for detection, site-localization, and quantification of potential misincorporations. This extensive product quality dataset allows active investigations to determine the relationships between clones, media, feeding strategies and culture management strategies, as well as nomination of the final commercial-ready cell culture production process (which is a separate bioreactor run with finalized media, feed and parameters that is also checked by AAA and LC-MS/MS for misincorporations, and by the batch-release assays and LC-MS/MS for product quality). Cell culture process development action levels for potential misincorporations in final drug substance have been set at > 0.1% for individual substituted sites and > 0.5% for all cumulative sites to better ensure superior product quality. If misincorporations are detected above these action levels, then the overall feeding strategy (feed rate and/or nutrient concentration) is revised to ensure that the concentration of the depleted amino acid is increased to lower misincorporation levels to significantly below the above action levels/developmental targets (see for more information).
Finalized SV screening platform
While the “intermediate” SV screening paradigm provided valuable information toward nomination of high quality, commercial-ready cell lines, the application of next-generation sequencing (NGS) for both high- and low-level genetic SV detection became much more accessible, time-saving and cost-effective in 2016 (see ). The Cell Line Development group developed a Pfizer-specific bioinformatics pipeline for NGS that provided automated data processing and analysis for more sensitive detection of potential genetic SVs as compared to EECS. NGS affords confidence that cell clones do not have genetic-level, single-base point mutations ≥ 0.5%. NGS and LC-MS/MS were run side-by-side successfully for one year using matched clone and protein product sets to ensure that the same genetic SVs and corresponding levels were detected by both techniques. The outcome was both NGS and LC-MS/MS detected the same sites and levels ≥ 0.4% for all tested clones. As a result, a new “finalized” SV screening platform was introduced in 2017 that now included NGS in place of EECS for lower level SV detection in mRNA (; SV Screen 3a). Additionally, AAA was added to monitor the amino acid nutrients in ambr conditioned medium at specific time points (days-in-culture) for the assessment of misincorporations (; SV Screen 3a). By positioning NGS and AAA as the primary screening methods for genetic SVs and misincorporation analysis, respectively, LC-MS/MS is only executed to augment NGS for low-level genetic SV confirmation between 0.4% and 1% for high-titer “top clones” of interest (; SV Screen 3a). Furthermore, LC-MS/MS is used to more comprehensively characterize misincorporations prior to clone nomination if AAA indicates significant depletion of one or more particular amino acid nutrients in ambr (see ). Lastly, the high level SV screen (≥ 1%) involving the LC/MS-subunit analysis method was no longer needed for initial clone screens (see ; SV Screen 2a) because of the expanded capabilities of NGS in terms of sensitivity and sequence coverage.
Previous experience with the “intermediate” SV screening paradigm (; SV Screen 2a and 2b) showed that LC/MS-intact mAb analysis, LC-MS-subunit analysis, and LC-MS/MS were capable of detecting atypical or elevated product quality attributes prior to final clone nomination and establishment of the commercial-ready cell line and culture process. While product quality assessments remain very important for achieving a commercial-ready process, performing all three MS-based techniques prior to clone nomination was viewed as less essential after several years of experience because most product quality attributes could be optimized during the commercial-ready cell culture process development stage. Additionally, the extra time and resources that were required for completing two full product quality assessments (; SV Screen 2a and 2b) was not sustainable long term. As NGS and AAA became formidable frontline techniques for early SV screening with minimal resource requirements (; SV Screen 3a), all MS-based product quality assessments were shifted to the later cell-line commercial readiness stage (; SV Screen 3b). At this later stage, essentially, all SV and product quality screening techniques are performed: NGS, AAA, LC-MS/MS, and LC/MS-intact and subunit analyses. These moves further simplified and streamlined the evaluation and detection of SVs at the early clone selection stage, and facilitated a more comprehensive assessment of product quality and potential SVs at the late-generational age stability time point.
Similar SV analysis strategies involving NGS and LC-MS/MS have been shown to work effectively in other companies for cell line and cell culture process screening.Citation16,Citation27 In general, LC-MS/MS appears to be the principal technique for detecting SVs in many companies, and it is common for researchers to experimentally cross-check particular MS-derived SVs with genetic sequencing methods, as needed, to confirm genetic point mutations. The purposeful incorporation of NGS as a frontline technique in the Pfizer SV screening roadmap (; SV Screen 3a), instead of MS, similar to Zhang et al.,Citation27 has resulted in more efficient and confident detection of genetic SVs by eliminating the cross-checking experiments between MS and genetic methods (which was the mainstay in previous Pfizer SV screening workflows in ). The upfront addition of routine AAA represents a unique feature of the Pfizer SV screening roadmap, where further efficiencies were achieved by shifting the resource intensive MS-based SV and product quality analyses to the final check of the commercial ready process. The “finalized” SV workflow in (SV Screen 3a and 3b) uses highly-sensitive, state-of-the-art genetic and protein analytics tools to ensure detection, identification and quantification of potential SVs, while at the same time, affording product quality data and keeping within tight timelines/limited resources to achieve commercial cell line readiness.
Conclusions
As companies race to meet the need for safe and effective protein therapeutics for a plethora of human diseases, paradigms for the development and manufacturing of these biotherapeutics are ever-evolving and must be constantly evaluated and updated to ensure efficient delivery of high quality drugs. In mammalian biologic-producing cell lines and cell culture processes, being able to ensure therapeutic protein sequence integrity, including the sensitive identification of potential SVs within stringent bioprocess development timelines, is of utmost importance. SVs have the potential for multiple “knock-on” product quality, safety and efficacy effects that are unknown and sometimes difficult to control, especially as the manufacturing process is scaled-up, finalized, and transferred to new facilities. If genetic SVs or misincorporations are detected early at the start of process and product development, the best course of action is to proactively choose another high-titer, mutation-free cell clone or optimize the culture process media/feed, respectively. This prevents future clinical and regulatory risk to programs, as well as the implementation of extra batch-release assays in the quality control lab for SV-monitoring during clinical and commercial manufacture.
We hope that our experiences with SV analysis are useful to other research and development laboratories and regulatory agencies involved in the development and approval of new therapeutics that are safe and efficacious. Throughout this journey, many lessons were learned – one in particular was how genuine, collaborative teamwork between Analytical and Bioprocess groups led to the co-ownership of the Pfizer SV analysis strategy and the complete turnaround of a challenging SV situation that emerged in the early 2010s. The SV screening workflows implemented by the Pfizer “SV Analysis Team” () have substantially reduced the risk of project delays over the past ~ 6 years and continually addressed tight timelines/limited resources. Additionally, the SV team expanded product quality assessments with MS-based heightened characterization during process development, implemented new technologies for SV analysis, and played an important role in the establishment of the new commercial-ready process paradigm. Based on our experience, we strongly recommended the thorough interrogation of potential sequence variation with a streamlined testing roadmap that includes state-of-the-art techniques and coordination of genetic and analytical methodologies to provide highly sensitive SV identification, with stringent developmental action levels in place to not only ensure uniformity, but also confirm quality, across all biologics proceeding toward clinical studies. Drug substance-producing cell lines and culture processes have quality standards regarding SV screening, identification, elimination and control that must be met, and we believe that Pfizer’s current SV screening workflow achieves this standard.
Box 1: Initial Discovery of SVs at Pfizer and Evolution of MS-based Screening
In late 2010, during routine heightened characterization of a particular early-phase therapeutic antibody, mAb-1 (clone-b), trypsin peptide mapping via high resolution/accurate mass (HR/AM) LC/MS led to the discovery of an abundant Thr to Pro substitution (T304P) in heavy (H) chain (−4 Da change). Subsequent targeted LC-MS/MS analysis pinpointed the SV to T304P in the Fc region. Also in late 2010, a new cutting-edge HR/AM LC/MS-subunit analysis method (see ) was introducedCitation28 that used the immunoglobulin G-degrading enzyme of Streptococcus pyogenes (IdeS) and disulfide bond reduction to “break-up” mAbs into three ~ 25 kDa polypeptides: light (L) chain and two H chain domains, Fd’ (variable, CH1 and hinge regions) and the single-chain Fc (scFc; CH2 and CH3 regions). Leveraging the enhanced chromatographic resolution of the H chain domains, mAb-1 (clones a and b) was analyzed with this “new” LC/MS–subunit analysis method. In addition to UV peaks representing L chain, Fd’ and scFc, two unanticipated, high-level, baseline-resolved peaks were revealed in the UV chromatogram of clone-b as compared to clone-a for mAb-1. While one “unexpected” peak represented the previously elucidated scFc T304P SV, the other “unexpected” peak strongly suggested the presence of a second SV in mAb-1 (clone-b) based on the experimental accurate mass difference, + 15.9915 Da, relative to unmodified Fd’. Upon retrospective analysis of all existing trypsin peptide mapping accurate mass and sequencing data, a second SV, F151Y, was indeed confirmed (i.e., theoretical mass difference for a Phe to Tyr substitution is + 15.9949 Da due to 1 oxygen addition), superseding the original peak assignment of an oxidized H chain tryptic peptide from the CH1 domain. The exquisite chromatographic separation, accurate mass determinations, and highly sensitive nature of the new cutting-edge IdeS LC/MS-subunit analysis method, combined with 100% sequence coverage for each mAb subunit/domain (in contrast to peptide mapping which is often ≤ 100%), straightaway solidified use of this heightened characterization approach for rapid, first-line SV screening for 6+ years. With LC/MS-subunit analysis, SVs have appeared as split peaks/peak shoulders (i.e., T363N detected in mAb-2 clone-a), and as new baseline-resolved peaks either in the chromatogram (i.e., T253I detected in mAb-3 at 0.2% for both clones) or in the mass spectrum (i.e., R to K misincorporations detected in mAb-4 batch-b only), affording reliable, visual identification of high-level SVs ≥ 1% (and sometimes lower for chromatographically resolved species). At present-day, more dependable, semi-automated bioinformatics software for SV analysis via trypsin LC-MS/MS-peptide mapping has emerged, along with significant advancements in LC-MS/MS instrumentation, thereby opening up a new mainstream approach for more sensitive and efficient interrogation of both high and low-level SVs with a reportable limit of > 0.1%. While the strong reliance for LC/MS-subunit analysis in SV analysis workflows has diminished, LC/MS-subunit analysis is still used at the cell line suitability/commercial readiness evaluation stage as a final check of product quality attributes (; SV Screen 3b). LC/MS-subunit analysis will always be that reliable, visual method for spotting any new species potentially missed by trypsin LC-MS/MS-peptide mapping given the inherent 100% sequence coverage.
Box 2: Comparison of Genetic and Protein Characterization Methods for SV Detection
When the identification of genetic SVs became a pattern rather than an anomaly, the Pfizer cross-functional SV team assembled an orthogonal screening strategy involving both genetic and proteomic sequencing methods to eliminate clones that contained mutations to prevent amino acid substitutions in the therapeutic product. The embedded table compares and contrasts the techniques applied for genetic SV analysis. The initial Pfizer method for detecting genetic mutations was extensive clonal sequencing (ECS). This was a PCR-based assay where the gene of interest was amplified from either genomic DNA or cDNA. The resulting PCR product was sub-cloned into the pBluescript vector and then transformed into E.coli. Ninety-six colonies were mini-prepped for every gene of interest and sent for double stranded Sanger sequencing. This initial method had a genetic SV detection sensitivity of ≥ 5% with a 95% confidence interval (CI). ECS was then further enhanced to expanded, extensive clonal sequencing (EECS) by tripling the amount of colonies to 288. EECS provided higher sensitivity for genetic SV detection: ≥ 2% with the same CI, which provided higher confidence and better coverage. ECS and EECS also enabled high-throughput analysis of individual PCR products, rather than the bulk PCR product. Next-generation sequencing (NGS), specifically the Illumina RNAseq format, recently emerged as a more sensitive genetic sequencing technique for SV analysis as compared to EECS, lowering the detection limit to ≥ 0.5% with 100% sequence coverage. Additionally, NGS has reduced hands-on lab time to 1 hr and significantly reduced outsourcing costs among the genetic sequencing methods. In the early days, LC-MS-subunit analysis was the primary technique used for screening genetic SVs in secreted proteins due to high sample throughput and simplicity of the chromatographic and mass spectral data for visually identifying SVs de novo. LC-MS/MS-peptide mapping also was implemented on research-grade quadrupole time-of-flight and orbitrap mass spectrometers for in-depth SV analysis, with the latter mass analyzer attaining ultimate SV detection sensitivity of > 0.001% Citation20. For many years, both LC/MS-subunit analysis and LC-MS/MS-peptide mapping served as forefront techniques that ensured sensitive detection of genetic SVs in the secreted products with 100% sequence coverage. Even with the advent of SV bioinformatics, LC-MS/MS still requires an expert mass spectrometrist to comb through the mass spectral data from 2–6 cell line clone samples full-time for 1–3 weeks. Recently, NGS was unanimously implemented at Pfizer for frontline genetic SV screening because the high sensitivity and quality standards (100% sequence coverage) were upheld similar to LC/MS-subunit analysis and LC-MS/MS-peptide mapping, and the hands-on time in the lab was minimized compared to ECS and EECS.
Box 3: Minimizing Misincorporations Through Active Screening and Process Optimization
In addition to SVs from genetic mutations, misincorporation events represent another source of potential, low-level sequence variation in recombinant proteins. Misincorporations are non-genetic SVs comprising one or more amino acid substitutions that occur at numerous sites along the entire polypeptide chain, which creates additional product heterogeneity. Misincorporations originate from translational errors during protein synthesisCitation19, including tRNA mischarging (triggered by depletion of amino acid nutrients) and codon-anticodon mispairing (leading cause of amino acid substitutions at < 0.1% in the biological noiseCitation20). E. coli expression systems are notorious for imparting low-level norleucine misincorporations in recombinant proteinsCitation29, however, in the late 2000s, due to sensitivity advances in HR/AM mass spectrometers, misincorporations were reported for the first time in Chinese Hamster Ovary cell expression systems, in contradiction of the extensive ribosomal proof-reading machinery that was thought to prevent translational errors in mammalian cellsCitation30,Citation31. In practical terms, the effects of misincorporations on structure-function, safety and efficacy are very difficult to assess because these amino acid substitutions are typically found at low levels (< 1%) and they create a heterogeneous mixture of trace-level, partially-modified primary sequence proteoforms. Moreover, it is very difficult to remove the population of misincorporated proteoforms from the therapeutic product in the downstream purification process. Consequently, as a best practice, misincorporations are analytically monitored, and then minimized and controlled in the upstream cell culture process, as required.
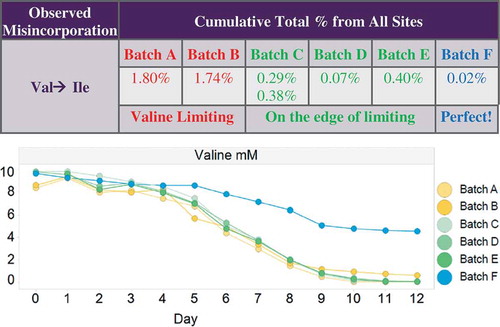
The Pfizer cross-functional SV team was focused initially on reliably detecting genetic SVs and eliminating these respective clones from further consideration. However, in 2013, SV analysis of the Pfizer biotherapeutics portfolio for genetic mutations also revealed that a few products contained low-level misincorporations. In the years to follow, more misincorporation events were detected by LC/MS-subunit analysis and/or LC-MS/MS-peptide mapping at low-levels between 0.01 and 1% for new products manufactured with the standard platform upstream and downstream processes, as well as during development of intensified, high-yield commercial-ready manufacturing processes. This led to the SV team establishing process development targets (or action levels) to ensure that misincorporations are minimized/controlled in the final drug substance: no single misincorporation at an individual site is > 0.1% and the cumulative misincorporation sites are not > 0.5%, thereby guaranteeing that misincorporations remain below the 1–2% regulatory threshold (given normal process variation), where quality, safety and efficacy concerns can escalate. As a case study, in the development of the commercial-ready process for a particular mAb, Batches A and B were found to contain cumulative Val to Ile misincorporations at > 0.5% with a few individual sites at > 0.1% (see embedded table). The daily amino acid nutrient feed rate was increased for Batches C (analyzed twice), D and E, which increased Val delivery by 1.6X and lowered the site and cumulative misincorporation levels to below the developmental action levels. However, both the site and cumulative levels were teetering just below acceptable levels, which were viewed as a risk for clinical manufacture. For Batch F, the daily Val delivery was increased to 3X by both increasing the concentration of Val in the nutrient feed and maintaining the increased feed rate, which lowered Val misincorporations to negligible levels, dramatically improving product quality and consistency. Using amino acid analysis (AAA), the concentration of Val is seen to increase from a limiting state (Batches A-E) to a non-limiting state for Batch F (see embedded graph showing Val concentration vs. days-in-culture). At present, the majority of misincorporations that exceed the established action levels are linked to depleted amino acid nutrients. Thus, misincorporations now are monitored routinely in every batch produced throughout clone selection, commercial-ready process development, pilot and clinical manufacture via AAA by sampling conditioned media in a time-course (days-in-culture) format. LC-MS/MS is then used as a final check for misincorporations just prior to locking-the-process for clinical manufacture, or on-demand if AAA indicates the possible presence of misincorporations based on the set of predetermined, lower limit, empirical concentrations for all 20 (or detectable) amino acid nutrients.
Acknowledgments
The authors sincerely thank Marta Czupryn, David Brunner, Mark Leonard, Margaret Ruesch, Paul Mensah, Ranga Godavarti, Martin Allen, Linda Francullo, John Scarcelli, Thomas Nelson, Alice Furgeson, Maureen Hoen, Justin Sperry, A. Michelle English, Andrew Saati, Elaine Stephens, Matthew Thompson, and Mary Denton for their valuable contributions, helpful discussions, and critical feedback toward establishing the SV analysis strategy in the Pfizer Biotherapeutics Pharmaceutical Sciences organization.
Disclosure statement
No potential conflict of interest was reported by the authors.
Related Research Data
References
- Reichert JM. Marketed therapeutic antibodies compendium. mAbs. 2012;4:413–415. doi:10.4161/mabs.19931.
- Kaplon H, Reichert JM. Antibodies to watch in 2018. mAbs. 2018;10:183–203. doi:10.1080/19420862.2018.1415671.
- Cafuir LA, Kempton CL. Current and emerging factor VIII replacement products for hemophilia A. Ther Adv Hematol. 2017;8:303–313. doi:10.1177/2040620717721458.
- Lalonde ME, Durocher Y. Therapeutic glycoprotein production in mammalian cells. J Biotechnol. 2017;251:128–140. doi:10.1016/j.jbiotec.2017.04.028.
- Wurm FM. Production of recombinant protein therapeutics in cultivated mammalian cells. Nat Biotechnol. 2004;22:1393–1398. doi:10.1038/nbt1026.
- Borisov OV, Field M, Ling VT, Harris RJ. Characterization of oligosaccharides in recombinant tissue plasminogen activator produced in Chinese hamster ovary cells: two decades of analytical technology development. Anal Chem. 2009;81:9744–9754. doi:10.1021/ac901498k.
- Mann M, Kelleher NL. Precision proteomics: the case for high resolution and high mass accuracy. Proc Natl Acad Sci U S A. 2008;105:18132–18138. doi:10.1073/pnas.0800788105.
- Sidoli S, Kulej K, Garcia BA. Why proteomics is not the new genomics and the future of mass spectrometry in cell biology. J Cell Biol. 2017;216:21–24. doi:10.1083/jcb.201612010.
- Borisov OV, Alvarez M, Carroll JA, Brown PW. Sequence Variants and Sequence Variant Analysis in Biotherapeutic Proteins. In: Schiel JE, Davis DL, Borisov OV, editors. State-of-the-Art and Emerging Technologies for Therapeutic Monoclonal Antibody Characterization Volume 2 Biopharmaceutical Characterization: the NISTmAb Case Study: American Chemical Society; ACS Symposium Series. Washington (DC): American Chemical Society; 2015. p. 63–117.
- Yang Y, Strahan A, Li C, Shen A, Liu H, Ouyang J, Katta V, Francissen K, Zhang B. Detecting low level sequence variants in recombinant monoclonal antibodies. mAbs. 2010;2:285–298.
- Frye C, Deshpande R, Estes S, Francissen K, Joly J, Lubiniecki A, Munro T, Russell R, Wang T, Anderson K. Industry view on the relative importance of “clonality” of biopharmaceutical-producing cell lines. Biologicals: J Int Assoc Biol Standardization. 2016;44:117–122. doi:10.1016/j.biologicals.2016.01.001.
- Calos MP, Lebkowski JS, Botchan MR. High mutation frequency in DNA transfected into mammalian cells. Proc Natl Acad Sci U S A. 1983;80:3015–3019.
- Razzaque A, Mizusawa H, Seidman MM. Rearrangement and mutagenesis of a shuttle vector plasmid after passage in mammalian cells. Proc Natl Acad Sci U S A. 1983;80:3010–3014.
- Dorai H, Sauerwald T, Campbell A, Kyung YS, Goldstein J, Magill A, Lewis MJ, Tang QM, Jan D, Ganguly S, et al. Investigation of product microheterogeneity – A case study in rapid detection of mutation in mammalian production cell lines. BioProcess Intl. 2007;66–72.
- Guo D, Gao A, Michels DA, Feeney L, Eng M, Chan B, Laird MW, Zhang B, Yu XC, Joly J, et al. Mechanisms of unintended amino acid sequence changes in recombinant monoclonal antibodies expressed in Chinese Hamster Ovary (CHO) cells. Biotechnol Bioeng. 2010;107:163–171. doi:10.1002/bit.22780.
- Zeck A, Regula JT, Larraillet V, Mautz B, Popp O, Gopfert U, Wiegeshoff F, Vollertsen UEE, Gorr IH, Koll H, et al. Low level sequence variant analysis of recombinant proteins: an optimized approach. PloS ONE. 2012;7:e40328. doi:10.1371/journal.pone.0040328.
- Fu J, Bongers J, Tao L, Huang D, Ludwig R, Huang Y, Qian Y, Basch J, Goldstein J, Krishnan R, et al. Characterization and identification of alanine to serine sequence variants in an IgG4 monoclonal antibody produced in mammalian cell lines. J Chromatogr B Analyt Technol Biomed Life Sci. 2012;908:1–8. doi:10.1016/j.jchromb.2012.09.023.
- Lin TJ, Beal KM, DeGruttola HS, Brennan S, Marzilli LA, Anderson K. Utilization of sequence variants as biomarkers to analyze population dynamics in cloned cell lines. Biotechnol Bioeng. 2017;114:1744–1752. doi:10.1002/bit.26298.
- Wong HE, Huang CJ, Zhang Z. Amino acid misincorporation in recombinant proteins. Biotechnol Adv. 2018;36:168–181. doi:10.1016/j.biotechadv.2017.10.006.
- Zhang Z, Shah B, Bondarenko PV. G/U and certain wobble position mismatches as possible main causes of amino acid misincorporations. Biochemistry. 2013;52:8165–8176. doi:10.1021/bi401002c.
- Khetan A, Huang YM, Dolnikova J, Pederson NE, Wen D, Yusuf-Makagiansar H, Chen P, Ryll T. Control of misincorporation of serine for asparagine during antibody production using CHO cells. Biotechnol Bioeng. 2010;107:116–123. doi:10.1002/bit.22771.
- Feeney L, Carvalhal V, Yu XC, Chan B, Michels DA, Wang YJ, Shen A, Ressl J, Dusel B, Laird MW. Eliminating tyrosine sequence variants in CHO cell lines producing recombinant monoclonal antibodies. Biotechnol Bioeng. 2013;110:1087–1097. doi:10.1002/bit.24759.
- Bostrom J, Haber L, Koenig P, Kelley RF, Fuh G. High affinity antigen recognition of the dual specific variants of herceptin is entropy-driven in spite of structural plasticity. PloS ONE. 2011;6:e17887. doi:10.1371/journal.pone.0017887.
- Harris RJ, Murnane AA, Utter SL, Wagner KL, Cox ET, Polastri GD, Helder JC, Sliwkowski MB. Assessing genetic heterogeneity in production cell lines: detection by peptide mapping of a low level Tyr to Gln sequence variant in a recombinant antibody.Nat Biotechnol. 1993;11:1293–1297.
- Gu S, Wen D, Weinreb PH, Sun Y, Zhang L, Foley SF, Kshirsagar R, Evans D, Mi S, Meier W, et al. Characterization of trisulfide modification in antibodies. Anal Biochem. 2010;400:89–98. doi:10.1016/j.ab.2010.01.019.
- Rogers RS, Abernathy M, Richardson DD, Rouse JC, Sperry JB, Swann P, Wypych J, Yu C, Zang L, Deshpande R. A view on the importance of “Multi-Attribute Method” for measuring purity of biopharmaceuticals and improving overall control strategy. AAPS J. 2017;20:7. doi:10.1208/s12248-017-0168-3.
- Zhang S, Bartkowiak L, Nabiswa B, Mishra P, Fann J, Ouellette D, Correia I, Regier D, Liu J. Identifying low-level sequence variants via next generation sequencing to aid stable CHO cell line screening. Biotechnol Prog. 2015;31:1077–1085. doi:10.1002/btpr.2119.
- Chevreux G, Tilly N, Bihoreau N. Fast analysis of recombinant monoclonal antibodies using IdeS proteolytic digestion and electrospray mass spectrometry. Anal Biochem. 2011;415:212–214. doi:10.1016/j.ab.2011.04.030.
- Ni J, Gao M, James A, Yao J, Yuan T, Carpick B, D’Amore T, Farrell P. Investigation into the misincorporation of norleucine into a recombinant protein vaccine candidate. J Ind Microbiol Biotechnol. 2015;42:971–975. doi:10.1007/s10295-015-1613-x.
- Wen D, Vecchi MM, Gu S, Su L, Dolnikova J, Huang YM, Foley SF, Garber E, Pederson N, Meier W. Discovery and investigation of misincorporation of serine at asparagine positions in recombinant proteins expressed in Chinese hamster ovary cells. J Biol Chem. 2009;284:32686–32694. doi:10.1074/jbc.M109.059360.
- Yu XC, Borisov OV, Alvarez M, Michels DA, Wang YJ, Ling V. Identification of codon-specific serine to asparagine mistranslation in recombinant monoclonal antibodies by high-resolution mass spectrometry. Anal Chem. 2009;81:9282–9290. doi:10.1021/ac901541h.