
ABSTRACT
Breast cancer, melanoma and glioblastoma cells undergo cell-mediated aggregation and aggregate coalescence in a transparent 3D Matrigel environment. Cells from normal tissue and non-tumorigenic cell lines do not exhibit these behaviors. Here, 266 monoclonal antibodies (mAbs) demonstrated to interact with a wide variety of membrane, secreted and matrix proteins, have been screened for their capacity to block these tumorigenic cell-specific behaviors in a 3D environment. Remarkably, only six of the 266 tested mAbs exhibited blocking activity, four targeting integrin ß-1, one targeting integrin α-3 and one targeting CD44. Colocalization of integrins ß-1 and α-3 in fixed cells and in live aggregates suggests that the integrin α-3 ß-1 dimer plays a central role in cancer cell aggregation in the 3D environment provided by Matrigel. Our results suggest that blocking by anti-integrin and anti-CD44 mAbs involves interference in cell-cell interactions.
Introduction
Tumors form in a 3D environment
Therefore, in vitro studies of cancer cell behavior should be performed in a 3D model.Citation1-Citation3 We recently reported that both tumorigenic cell lines and fresh tumor cells, when dispersed in a transparent 3D Matrigel environment, divide and undergo directed, cell-mediated cell aggregation and aggregate coalescence (“aggregation and coalescence”).Citation1-Citation3 Non-tumorigenic cell lines and normal cell cultures derived from non-cancerous tissue, do not exhibit these behaviors.Citation1-Citation3 In time, large aggregates formed by tumorigenic cells assume forms consistent with the tumors formed in vivo.Citation1-Citation3 Previously, we demonstrated that the anti-integrin ß-1 monoclonal antibody (mAb), AIIB2,Citation4 blocked aggregation and coalescence in a 3D Matrigel environment,Citation1 in the tumorigenic cell line MDA-MB-435-α6HG6, which was derived from a breast cancer.Citation5 In a subsequent study of cell aggregation and aggregate coalescence by melanoma cell lines and cells cultured from fresh melanomas, a screen of 51 purified mAbs targeting cell surface-associated molecules yielded only two anti-integrin ß-1 mAb and one anti-CD44 mAb that blocked aggregation and coalescence.Citation3 Neither affected cell growth. Both of the targeted membrane proteins have been shown to play a number of different roles in cell-cell interactions, cell behavior and cell-matrix interactions. Integrin ß-1 forms heterodimers with a number of different integrins.Citation6 These dimers facilitate binding to matrix molecules,Citation6-Citation17 transduce signals through regulatory pathways to the actin cytoskeletonCitation18-Citation20 and play direct roles in cell-cell interactions.Citation21-Citation24 They have also been shown to play roles in tumor progression and metastasis.Citation25-Citation27 CD44 plays a role in cell-cell adhesion, cell locomotion and metastasis.Citation28-Citation32 It can function coordinately with integrins.Citation33-Citation37
Here, we expanded our screen of mAbs with the expectation of identifying additional ones that block tumorigenic cell aggregation and aggregate coalescence in a 3D Matrigel environment. A collection of 266 purified and concentrated mAbs obtained from the mAb collection of the Developmental Studies Hybridoma Bank (DSHB) at Iowa, including the original 51 mAbs previously analyzed, were first screened at a very high concentration (540 µg per ml) for their capacity to block cell aggregation and aggregate coalescence of breast cancer and melanoma cell lines in a 3D Matrigel environment. The mAbs, previously validated for one or more cell applications, targeted membrane, secreted and matrix proteins that are in the following categories: cell adhesion receptors, cell signaling receptors, clusters of differentiation surface molecules, general cell surface markers, channel molecules and transporters, growth factors, metabolic proteins, secreted transcription factors and secreted tumor suppressors.
To our surprise, of the 266 mAbs tested in the initial screen, only mAbs against 3 targets blocked cell aggregation and aggregate coalescence in one or both test strains in the initial screen. Four were against integrin ß-1, one against integrin ß-3 and one against CD44. Because five of six were integrins, we verified all 27 anti-integrin mAbs in the DSHB collection at 0.6 and 0.3 µg per ml, using the breast cancer and melanoma cell lines, as well as an additional glioblastoma cell line. Three of the four anti-integrin ß-1 mAbs that blocked cell aggregation and aggregate coalescence did so maximally at 0.6 µg per ml, in all three cell lines. One anti-α-3 integrin mAb blocked aggregation and coalescence at 540 µg per ml for two of the three cell lines and for one at 0.6 µg per ml. These results suggest that ß-1 plays a fundamental role in the single cell behaviors that mediate cell aggregation and aggregate coalescence in a 3D Matrigel environment,Citation1-Citation3 and that it may do so in the integrin α-3 ß-1 heterodimer.
All of the anti-integrin mAbs that exhibited blocking activity immunostained all three cell lines. Eighteen mAbs against seven additional integrins stained one or more of the three cell lines, but exhibited no blocking activity in the aggregation and coalescence assay, even though the majority have been shown to block cell-matrix adhesion. Mixtures of mAbs against multiple anti-integrin α mAbs that stain cell and block cell-matrix adhesion had no effect on aggregation and coalescence. Our results not only reveal the specificity of mAb blocking activity for aggregation and coalescence in a 3D Matrigel environment, but also suggest that the anti-integrin mAbs and anti-CD44 mAb block cell aggregation and aggregate coalescence by interfering directly with cell-cell interactions, rather than cell-matrix interactions. Given the complexity at the cellular and behavioral level of cell aggregation and aggregate coalescence in a 3D matrix,Citation1-Citation3 it seems remarkable that only 6 of 266 mAbs (four against integrin ß-1, one against integrin α-3 and one against CD44) were the only ones that exhibited blocking activity in a 3D environment. These results, however, do not exclude the targets of mAbs with no blocking activity from still being viable blocking targets for mAbs against domains of the target proteins different from those of the mAbs tested.
Results
The assay for blocking
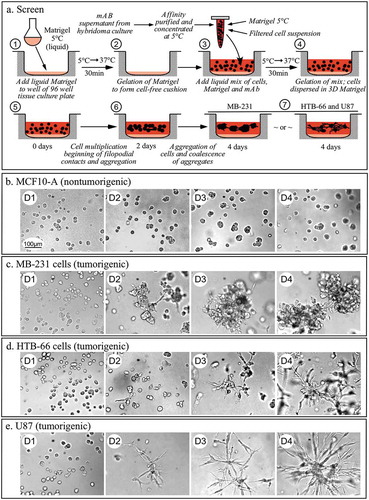
The assay employed here tested the capacity of a mAb to block tumorigenic cell aggregation and aggregate coalescence (referred to hence as “aggregation and coalescence”) in a 3D Matrigel environment, behavioral characteristics that have been demonstrated to be specific to tumorigenic cells.Citation1-Citation3 The assay relies on the transparency and gelation characteristics of Matrigel, an extract of mouse basement membrane, which separates epithelial cells from underlying tissue. It is composed primarily of laminin, nidogen (entactin), collagen IV, and proteoglycans.Citation38 It exists as a clear liquid at 5°C, but gels, forming a transparent 3D matrix, when the temperature is raised to 37°C. By mixing tumorigenic cells with Matrigel at 5°C, then raising the temperature to 37°C, cells are dispersed randomly in the 3D transparent gel. After gelation, tumorigenic cells move in a directed fashion into aggregates, which in turn undergo aggregate coalescence.Citation1-Citation3 Aggregation and coalescence are not due to random contact, but are rather cell mediated through the formation of pseudopodia and filopodia that form intercell contacts that contract, bringing together cells and aggregates.Citation1-Citation3 In the coalescence of aggregates, cells extend from aggregates to form bridges that contract, bringing aggregates together.Citation1-Citation3 Normal cells do not undergo aggregation and coalescence, but rather multiply, forming small clonal islands.Citation1-Citation3 The preparation to screen for mAbs that block this process is diagrammed in . A thin Matrigel cushion free of cells was first cast on the bottom of wells in a 96-well tissue culture plate (steps 1 and 2, ). Cells were then suspended in cold (5°C) Matrigel (liquid), with (test) or without (control) mAb, in growth medium, pipetted onto the cushion and then allowed to gel for 30 minutes at 37°C, resulting in a 3 to 4 mm-thick upper transparent gel layer with independent cells dispersed randomly throughout (steps 3 and 4, ). These cell cultures were then imaged at three different depths each day over a four day (96 hour) period to assess aggregation and coalescence (steps 5 to 7, ). When the preparation was cast in the absence of mAbs with cells of the non-tumorigenic cell line MCF-10A,Citation39 the cells multiplied, forming small clonal aggregates that remained intact after four days (). Single MCF-10A cells did not aggregate and the small clonal aggregates did not undergo coalescence, even when making contacts with one another ().Citation1− The three tumorigenic cell lines, MDA-MB-231 (referred to henceforth as MB-231) a breast cancer cell line, HTB-66, a melanoma cell line, and U87, a glioblastoma cell line, multiplied in the absence of mAbs, and single cells aggregated, cells and small aggregates aggregated, and small aggregates coalesced in the 3D Matrigel environment, through active cell interactions involving pseudopods and filopodia as previously described in detail.Citation1-Citation3 Cell aggregation began by day two and aggregate coalescence by day three (–), respectively).
Figure 1. The assay used to screen for monoclonal antibodies that block cell aggregation and aggregate coalescence in a 3D Matrigel environment.
(a) Diagram of procedure. (b) The absence of cell-cell aggregation and aggregate coalescence in a preparation containing non-tumorigenic MCF-10A cells derived from normal breast tissue. C, D, E. Cell-aggregation and aggregate coalescence in preparations of tumorigenic MB-231 cells (c) derived from a breast cancer, tumorigenic HTB-66 cells (d) derived from a melanoma, and tumorigenic U87 cells derived from a glioblastoma (e). D, day
Initial collection of the 266 mAbs
A collection of 266 mAbs were employed in the initial screen to test for their capacity to block aggregation and coalescence of MB-231 and HTB-66 cells. The entire collection was obtained from the DSHB, a National Resource created by the National Institutes of Health and housed at the University of Iowa. All 266 mAbs were purified and concentrated. The targets and mAbs are listed in . The validation characteristics and reported applications of all 266 mAbs, obtained from the DSHB website (http://dshb.biology.uiowa.edu/), are assembled in supplemental Table S1. The mAbs were categorized by their targets as follows: cell adhesion receptors, cell signaling receptors, cluster of differentiation, extracellular matrix molecules, general cell surface markers, growth factors, metabolic proteins, secreted transcription factors, channels and transporters, and secreted tumor suppressors (supplemental Table S1).
Table 1. Results of the first screen for mAbs that block cell aggregation and aggregate coalescence in a 3D Matrigel environment.
Initial screen of 266 mAbs
In the initial screen of the 266 mAbs, 123 were tested on both MB-231 and HTB-66 cells, and 143 were tested on one or the other cell line (). All were tested at a concentration of 540 µg per ml. Only 6 (2.3%) blocked aggregation and coalescence, in one or both cell lines (). Five were anti-integrins, 4 (P4C10, AIIB2, P5D2, 7E2) targeting integrin ß-1 and 1 (P1B5) integrin α-3 (). Only AIIB2 was previously shown to block aggregation and coalescence in a 3D Matrigel model.Citation1 The sixth was an anti-CD44 mAb, H4C4 (), previously shown to block aggregation and coalescence of melanoma cells in a 3D Matrigel model.Citation3 Therefore, 260 (97.7%) of the 266 tested mAbs did not affect cell aggregation and aggregate coalescence. Qualitative examination of images over a four-days period revealed that, in all cases in which a mAb did not block aggregation and coalescence, cells were viable and proliferated.
Blocking by anti-integrin mAbs
Because five of the six mAbs that had blocking activity were anti-integrins, we focused on the 27 anti-integrin mAbs in the test collection. We first tested a mAb concentration range between 540 and 0.3 µg per ml (540, 250, 125, 50, 10, 0.6 µg per ml) for the mAb P4C10 with MB-231 cells, since it was one of the 3 anti-integrin ß-1 mAbs that blocked both cell lines at 540 µg per ml in the initial screen. We found that 0.6 µg per ml was the minimum blocking concentration (supplemental Figure S1). We also tested the concentration range of 7E2, which blocked MB-231, but not HTB-66, at 540 µg per ml (). The minimum inhibitory blocking concentration was 250 µg per ml (Supplemental Figure S1). Using the minimum blocking activity of P4C10 as a standard, we then tested all 27 anti-integrin mAbs at 0.6 and 0.3 µg per ml. All were tested with the 2 original cell lines MB-231 and HTB-66, as well as the glioblastoma cell line U87.Citation40 This latter cell line, which was not used in the initial screen (), was found to be inhibited by the anti-integrin ß-1 mAbs P4C10, AIIB2, P5D2 and 7E2, and by the anti-integrin α-3 mAb P1B5 at 540 µg per ml, as was the case for the MB-231 cell line (; –), respectively). Three of the four anti-integrin ß-1 mAbs (P4C10, AIIB2, P5D2) blocked HTB-66 at 540 µg per ml and all three test strains at 0.6 µg per ml (; –), respectively). P4C10 partially blocked MB-231 and U87 at 0.3 µg per ml, and AIIB2 partially blocked HTB-66 at 0.3 µg per ml. 7E2 did not block any of the three cell lines at 0.6 µg per ml (; ). The anti-integrin α-3 mAb, PIB5, blocked MB-231 and U87, but not HTB-66, at 540 µg per ml. PIB5 also blocked U87 at 0.6 µg per ml, and partially blocked U87 at 0.3 µg per ml (, Supplemental Figure S2).
Table 2. Blocking activity of 27 anti-integrin mAbs.
Figure 2. Inhibition by anti-integrin ß-1 mAbs of cell aggregation and aggregate coalescence in a 3D Matrigel environment at 540, 0.6 and 0.3 µg per ml.
Control cultures were untreated. (a). P4C10. (b). AIIB2. (c). P5D2. (d). 7E2. The scale bar for all micrographs is provided in panel A.
Staining by the anti-integrin mAbs
All 27 anti-integrin mAbs were also tested for their capacity to stain the three cancer-cell lines by indirect immunostaining. Of the 27 mAbs, 23 stained cells of one or more of the test strains (–)). Five of the six anti-integrin ß-1 mAbs (P4C10, AIIB2, P5D2, P5D8, 7E2) stained all three cell lines (–); ). One of the five, P5D8, stained (), but did not block aggregation and coalescence (; ). Staining of individual cells was associated with the cell surface, lamellipodia and filopodia (–)). Of the four anti-integrin ß-1 mAbs that blocked, the three (P4C10, AIIB2, P5D2) that blocked all three cell lines at 0.6 µg per ml have been demonstrated to interact with the ß1 domain of integrin ß-1 (–)).Citation41 The domain that is recognized by 7E2, which blocks two of the three cell lines, has not been determined. The anti-integrin α-3 mAb P1B5, which recognizes the ß-propeller of integrin α-3, blocked MB-231 and U87 cells at 540 µg per ml, but not HTB-66 cells (), but stained all three cell lines ( and ). Of the 22 anti-integrin mAbs that did not block, 18 stained one or more of the three test strains (). Eleven stained all three cell lines (). It should be noted that, of the 27 tested anti-integrin mAbs, 16 have been shown to block cell adhesion to matrix molecules in a variety of previous studies (supplemental Table S2). The 16 mAbs include both mAbs that blocked aggregation and coalescence in a 3D Matrigel environment (P4C10, AIIB2, P5D2, P1B5), and mAbs that did not block aggregation and coalescence in a 3D Matrigel environment (P5D8, P4H9, 10E5, 7H2, 9H5, P1E6, 6F1, P4G9, B11G2, P1D6, P1F6, P5H9, P5G10, 9.11TGA7) (supplemental Table S2). Therefore, the capacity to block adhesion of cells to matrix molecules was accompanied by the capacity to block aggregation and coalescence for only a minority of anti-integrin mAbs.
Figure 3. Two-dimensional model of integrin α-3 ß-1, known mAb binding sites, and staining patterns of the 23 anti-integrin mAbs that exhibited cytostaining in the three tested cell lines.
(a) Models of integrin α-3 and integrin ß-1. (b) Binding sites of anti-integrin α-3 and anti-integrin ß-1 mAbs that exhibited blocking activity in one or more of the cell lines tested. (c) Binding sites and cell line staining patterns of anti-integrin mAbs that block. (d) Binding sites and cell line staining patterns of anti-integrin mAbs that do not block. mAb, monoclonal antibody; +++, intense staining; ++, moderate staining; +, low staining, -, no staining.
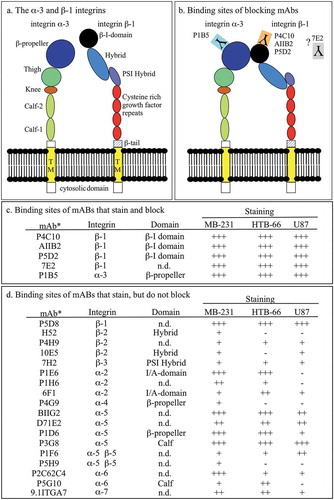
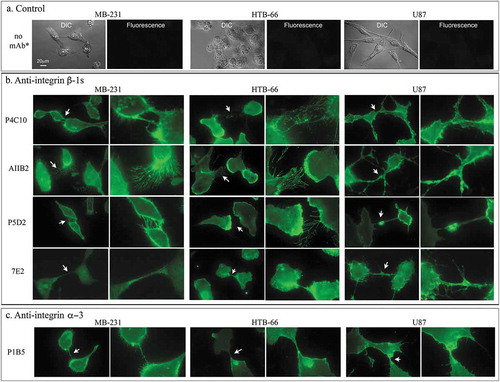
Figure 4. Indirect immunostaining with anti-integrin ß −1 and α −3 mAbs.
(a) Controls in which no mAb was added to cells of the three cell lines. (b) Staining by anti-integrin ß −1 mAbs P4C10, AIIB2, P5D2 and 7E2. (c) Staining by the anti-integrin α −3 mAb P1B5. Arrows indicate regions that are enlarged in the adjacent panel to the right. The scale bar for all images is presented in panel A, DIC image, MB-231.
Colocalization of ß-1 and α-3
Integrin ß-1 pairs with other integrins in the plasma membrane to form integrin receptors.Citation6,Citation42 Since the only anti-integrin mAb with blocking activity other than the anti-integrin ß-1 mAbs that blocked aggregation and coalescence was the anti-integrin α-3 mAb, P1B5, we tested for colocalization by double-labeling experiments. Cells of each of the three test strains were fixed, cotreated with the rat-derived anti-integrin ß-1 mAb, AIIB2, and the mouse-derived anti-integrin α-3 mAb, P1B5. Cells were then treated with the secondary fluorescent antibodies, anti-rat IgG H + L-AlexaFluor 488 and anti-mouse IgG H + L-R-Phycoerythrin, and analyzed for localization of the alternate fluors by confocal microscopy. AIIB2 and PIB5 overlapped at the plasma membrane for all three cell lines (), suggesting that the great majority of integrin ß-1 and integrin α-3 are complexed.
Figure 5. Colocalization of integrin ß-1 and integrin α-3 in both fixed and live cells.
(a) Indirect double staining of fixed MB-231, HTB-66 and U87 cells for integrin ß-1, using the rat-derived mAb AIIB2 and the fluor-tagged secondary antibody, anti-rat IgG Alexa Fluor 488 (green) and for integrin α-3, using the mouse-derived mAb P1B5 and the fluor-tagged secondary antibody, anti-mouse IgG Phycoerythrin (red). AIIB2, P1B5 and merged images are presented for each cell line. (b) Staining of live U87 clonal cell islands in a 3D Matrigel environment with fluor-tagged anti-integrin ß-1 mAb P4C10-HiLyte (750 nm) and fluor-tagged anti-integrin α-3 mAb P1B5-HiLyte (488 nm).
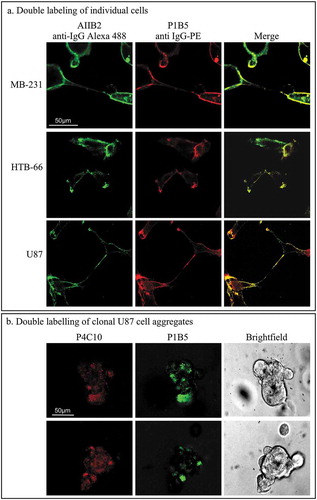
To demonstrate colocalization of integrin ß-1 and integrin α-3 in live cells undergoing aggregation and coalescence in the 3D Matrigel model, we used a different strategy than that for single cells. Because Matrigel is mouse-derived, using a mouse anti-IgG as a secondary antibody caused background staining of the matrix, resulting in imaging problems.Citation43 The anti-integrin ß-1 mAb P4C10 was therefore linked to the AnaTag HiLyte Fluor 750 and the anti-integrin α-3 mAb P1B5 was linked to the AnaTag Hilyte Fluor 488. The respective emission wave lengths were 750 and 488 nm, allowing imaging of the same live preparation to be performed independently for the two fluors. U87 cells were treated simultaneously for 4 days in a 3D Matrigel preparation with the fluor-linked anti-integrin ß-1 mAb and the fluor-linked anti-integrin α-3 mAb. Live small clonal aggregates, containing two to four cells, exhibited overlapping staining patterns, again demonstrating colocalization ().
mAb-blocked cells are viable
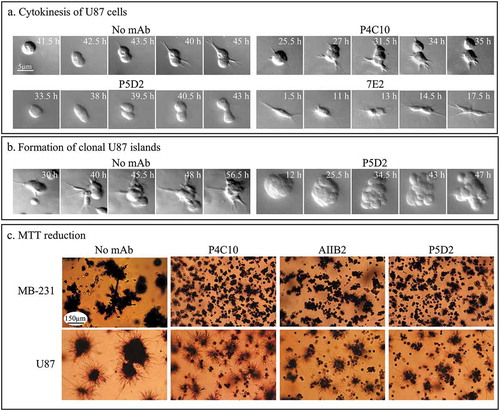
Blocking by mAbs of aggregation and coalescence was interpreted as interference of cell-cell, cell-aggregate and aggregate-aggregate interactions. However, blocking could also be due to toxicity and cell death. For all 3D analyses, images were taken every day for a four-day period at different depths to assess cell toxicity and cell multiplication. In all 260 cases in which mAbs did not block aggregation and coalescence, cells were motile, extended pseudopods and filopodia, underwent cell-mediated aggregation, and underwent cell division. In addition, we monitored over time individual U87 cells treated with 30 µg per ml of anti-integrin ß-1 mAbs that blocked aggregation and coalescence in the 3D Matrigel preparation. In particular, we looked for cell cleavage and formation of clonal aggregates resulting from cleavage.Citation3,Citation44 In the presence of the three tested mAbs, P4C10, P5D2 and 7E2, cells divided (), formed clonal aggregates as demonstrated in for P5D2 (). We next tested whether cells treated with mAbs that blocked aggregation and coalescence were metabolically active (). Untreated control cultures and test cultures treated with P4C10, AIIB2 and P5D2, were analyzed for 3-(4, 5-dimethylthiazol-2-yl)-2, 5-diphenyltetrazolium bromide (MTT) reduction after four days of incubation. Formazan crystal formation reflects metabolic activity.Citation45 As was the case for the untreated control cells, the mAb-treated preparations exhibited MTT reduction (), demonstrating viability.
Figure 6. mAbs that block cell aggregation and aggregate coalescence do not inhibit cytokinesis or affect metabolic activity.
(a) Representative examples of U87 cells undergoing cytokinesis in the absence of mAbs and in 30 µg per ml of the blocking mAbs P4C10, P5D2 and 7E2. (b) Formation of small clonal islands occurs in P5D2 blocked U87 cells as demonstrated by the representative clonal aggregate formed. The time in hours after 3D Matrigel model set up is indicated. (c) MTT reduction in P4C10, AIIB2 and P5D2 blocked cultures occurs in the majority of cells and clonal aggregates
Addition of anti-integrin β-1 mAbs after aggregation and coalescence
The employed assay assessed the capacity of a mAb to block aggregation and coalescence, but did not test whether mAbs that blocked could rapidly dismantle an aggregate. To this end, we incubated 3D Matrigel preparations of U87 cells for four days in the absence of mAbs, during which they formed large aggregates, then added each of the five anti-integrin mAbs with blocking activity (P4C10, AIIB2, P5D2, 7E2, P1B5) at 5 µg per ml. Seven days after addition of the antibodies, the preparations were imaged. For all five mAbs, a minority of cells did exit the tested aggregates, but the main aggregates remained relatively intact (supplemental Figure S3).
Multiple mAb treatment
Although the results suggest that the integrin α-3 ß-1 is involved in cell-cell interactions basic to aggregation and coalescence, there is no explanation for why so many mAbs that do not block aggregation and coalescence do block cell-matrix adhesions and stain the cell lines, suggesting they are expressed. This raises the question of why they are expressed, why the mAbs block cell-matrix adhesion, but do not block aggregation and coalescence. One explanation may be that the integrins are functionally redundant for cell-matrix adhesion, and applying simply one such mAb may not significantly affect cell behaviors. If redundant, then adding three such mAbs should have an additive effect. We therefore tested a combination of the three mAbs that stained HTB-66 cells, and have been shown to block cell-matrix adhesion, but which did not individually block aggregation and coalescence. The three mAbs were PID6, P1E6 and P5G10, which target α-2, α-5, and α-6, respectively. The combination was tested at 10 µg per ml, 30 µg per ml and 125 µg per ml, of each mAb. None of the three combinations at low, medium or high concentrations blocked aggregation and coalescence (Supplemental Figure S4). Finally, we tested the effects of a combination of the anti-integrin α-3 mAb, P1B5, and anti-integrin α-6 mAb, P5G10. These α-integrins have been shown to work coordinately in adhesion, migration and growth of epithelial cells and integrin internalization.Citation46,Citation47 P1B5 blocks cell-matrix adhesion and P5G10 appears to bind to the same matrix protein domain as the anti-integrin α-6 mAb GoH3,Citation10,Citation48,Citation49 which blocks cell matrix protein interactions.Citation50 GoH3 is not in the DSHB collection, and was therefore not tested here. A mixture of the two mAbs P1B5 and P5G10 at 30 µg per ml each had no effect on HTB-66 aggregation and coalescence (supplemental Figure S5).
Anti-CD44 mAbs
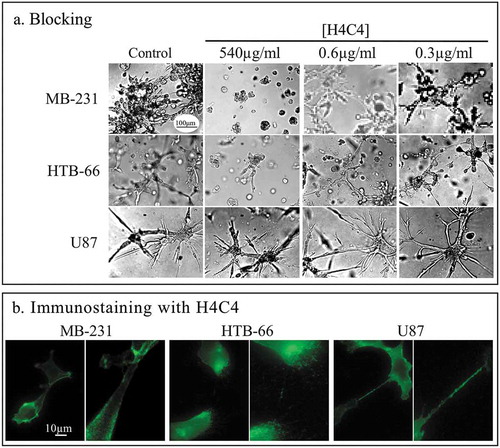
CD44 is a plasma membrane glycoprotein that is spliced, post-transcriptionally into a number of isoforms. It plays a variety of roles in metastasis and tumorigenesis.Citation51-Citation53 We previously reported that the anti-CD44 mAb, H4C4, blocked cell aggregation and aggregate coalescence in melanoma cells.Citation3 H4C4 recognizes the N-terminus of CD44,Citation54 which is extracellular and in the hyaluronan binding domain.Citation54-Citation56 In the initial screen, we found that H4C4 was the only mAb of four anti-CD44 mAbs that exhibited blocking activity for both MB-231 and HTB-66 cells (, ). However, even at 540 µg per ml, it did not block aggregation and coalescence of glioblastoma-derived U87 cells (). H4C4 did stain cells of all three cell lines (). At 0.6 µg per ml, H4C4 blocked MB-231 and HTB-66 aggregation and coalescence (). H4C4 has also been shown to block cell adhesion to hyaluronic acid.Citation57 It is noteworthy that CD44 has been shown to cooperate with integrins in cell matrix adhesion, and signaling.Citation33-Citation35,Citation37
Figure 7. The anti-CD44 mAb H4C4 blocks aggregation and coalescence of only two of the three cell lines, but stains all three with equal intensity.
(a) Blocking of aggregation and coalescence by H4C4 at 540, 0.6 and 0.3 µg per ml. (b) Immunostaining of the three cell lines by H4C4.
Discussion
In the initial 3D screen performed at 540 µg per ml of mAb, only six of the 266 mAbs (2.3%) blocked aggregation and coalescence of one or both of the cell lines, MB-231 and HTB-66. Five of the six were against integrins and one against CD44. In previous studies, it was demonstrated that the anti-integrin mAb AIIB2 against integrin ß-1 blocked aggregation and coalescence,Citation1 that the mAb P1B5 against integrin α-3 caused cells to exit aggregates and that the mAb H4C4 against CD44 blocked aggregation and coalescence.Citation1,Citation3 Weavers et alCitation4 also observed that AIIB2 destabilized aggregates of the breast cancer-derived cell line T4-2, in a 3D Matrigel environment. What seems remarkable in the present screen of 266 mAbs is the paucity of mAbs that blocked aggregation and coalescence in a 3D environment. Thus, 260 of the tested mAbs had no effect on cell multiplication, viability, cell polarization, or cell-mediated aggregation and coalescence in a 3D Matrigel environment.
Of the 27 anti-integrin mAbs that were tested, only five blocked aggregation in one or more of the three test cells lines, four against integrin β-1 and one against integrin α-3. The three anti-integrin β-1 mAbs that blocked all three cell lines (P4C10, AIIB2, P5D2) had been shown previously to bind to the amino acid sequence NKGEVFULLVGK (207 to 218) of the β-I domain.Citation41 All three of these mAbs blocked maximally at 0.6 µg per ml and stained cells of all three cell lines intensely at 10 µg per ml. In addition, P4C10 and P1B5 were demonstrated to stain living cells forming aggregates in a 3D Matrigel environment. The fourth anti-integrin β-1 mAb that blocked aggregation, 7E2, did so only for the cell lines MB-231 and U87, but not the cell line HTB-66, at 540 µg per ml. However, 7E2 stained the cell surface of all three cell lines at 10 µg per ml. Unlike P4C10, AIIB2 and P5D2, the 7E2 binding domain has not been determined. 7E2 was generated against Chinese hamster ovary cells, and had not been previously reported to interact with human cells.Citation58 One anti-integrin β-1 mAb, P5D8, which did not block, still stained all three cell lines intensely. The target domain of P5D8 has also not been determined. A last anti-integrin β-1, V2E9, neither blocked nor stained any of the three cell lines. It was generated against chicken cell integrin ß-1, and had not previously been tested against human integrin ß-1.Citation59
The anti-integrin α-3 mAb, P1B5, was the only anti-integrin mAb other than the four anti-integrin ß-1 mAbs of the 27 anti-integrin mAbs tested that blocked aggregation and coalescence. P1B5 has been demonstrated to bind to the ß-propeller of integrin α-3.Citation60,Citation61 Although P1B5 blocked aggregation and coalescence of U87 at 0.6 µg per ml, it blocked MB-231 only at a very high concentration (540 µg per ml) and did not block HTB-66 cells even at the very high concentration. P1B5 did, however, stain all three cell lines at the same intensity at 10 µg per ml. Moreover, double-labeling experiments with AIIB2, against ß-1, and P1B5, against α-3, revealed colocalization in all three cell types, both in fixed cell preparations and in live cell aggregates in the 3D Matrigel matrix. These results suggest that the integrin α-3 ß-1 dimer plays an integral role in the cell-cell interactions that drive aggregation and coalescence in a 3D environment, although the absence of blocking activity by P1B5 in HTB-66 cell preparations, even at 540 µg per ml, and the absence of blocking activity by P1B5 at 0.6 µg per ml in MB-231 cell preparations, are puzzling. One possible explanation is that integrin α-3 plays a role as a modulator of integrin ß-1 activity, but it is integrin ß-1 that plays the crucial role in the cell-cell interactions that drive cell aggregation and aggregate coalescence. It is more puzzling that blocking of aggregation and coalescence was not obtained with the majority of anti-integrins tested, since many of the target integrins, such as integrin α-6, partner with integrin ß-1 in adhesion to matrix molecules.Citation9,Citation62,Citation63
Indeed, 16 of the 27 anti-integrin mAbs we tested have been previously shown to block adhesion to matrix molecules (supplemental Table S2). Eleven of these mAbs that blocked adhesion to matrix molecules did not block aggregation and coalescence. These 11 mAbs targeted ß-1 (P5D8), ß-2 (10E5), ß-3 (7H2, 9H5), α-2 (P1E6, 6F1), α-4 (P4G9), α-5 (BIIG2, P1D6), α-5/ß-5 (P1F6, P5H9), α-6 (P5G10) and α-7 (9.11TGAT) (). In some cases, mAbs from sources other than the DSHB have been used more routinely than mAbs used here, but in at least once case, the DSHB anti-integrin α-6, P5G10, and the more generally used mAb GoH3, the matrix protein binding site facilitating cell-matrix adhesion, appears to be shared.Citation48 Based on our results, one might conclude that cells express a majority of integrins that do not play a role in aggregation and coalescence in 3D, and that only integrin α-3 ß-1 is essential. Since so many of the mAbs employed here have been shown to block binding of cells to matrix molecules, and our staining experiments have revealed that a majority of these integrin targets are expressed in one or more of the tested cell lines, one might conclude that matrix adhesion is not necessary in the 3D model. However, the integrin dimers that could be formed by the ß and α-integrins may be functionally redundant. Hence, blocking one or even two different integrins may be insufficient for blocking matrix binding. It seems reasonable to assume that the intricate cell and aggregate translocation behaviors basic to cell aggregation and coalescence may require adhesion to the 3D Matrigel matrix. However, treatment with mixtures of mAbs against integrins α-2, α-5 and α-6, and mixtures of mAbs against integrin α-3 and α-6 even at individual mAb concentrations of 125 µg per ml, had no effect on aggregation and coalescence in a 3D environment. This leads to the tentative conclusion that it may be specifically the integrin α-3 ß-1 dimer that plays a central role in these 3D behaviors.
In conclusion, we used the capacity to block cancer cell aggregation and aggregate coalescence in a 3D environment as an assay to screen a collection of 266 mAbs, the majority of which targeted cell surface or secreted molecules. We used this assay for several reasons. First, it has been noted repeatedly that cancer cells form tumors in a 3D environment and in many cases in a basement membrane matrix.Citation1-Citation3,Citation64,Citation65 Matrigel, used to establish the in vitro 3D matrix, represents reconstituted basement membrane.Citation38 The crux of this point is that tumor development occurs in a 3D environment, not on a 2D substratum. Second, we have shown that cell aggregation and aggregate coalescence are characteristics of tumorigenic cells, not normal cells,Citation1-Citation3 just as is the case for resistance to signals that inhibit cell multiplication,Citation66-Citation68 growth factor independence,Citation69,Citation70 self-signaling for cell multiplication,Citation71,Citation72 invasiveness and metastasis,Citation73 tumorigenesis in animal models,Citation74 loss of contact inhibition,Citation75,Citation76 and additional characteristics. And third, tumorigenic cell aggregation and aggregate coalescence reflect aspects of tumorigenesis.Citation1-Citation3 This is most obvious in field cancerization, in which multiple tumorigenic loci coalesce, contributing to the growth and heterogeneity of developing tumors,Citation77,Citation78 as is most obvious in histological sections of developing melanomas.Citation79 Our results are most remarkable for the paucity of blocking mAbs and the specificity of the subset of anti-integrin mAbs, as well as the anti-CD44 mAb that blocks aggregation and coalescence. Our results demonstrate that of 27 anti-integrin mAbs, only five exhibited blocking activity and only three, all against the same ß-I, blocked in all three test strains. Of the five, four targeted integrin ß-1 and one integrin α-3. Because integrins function in pairs and because of colocalization of ß-1 and α-3 on the cell surfaces all three test strains, we have put forward the hypothesis that integrin α-3 β-1 plays a central role in tumorigenic cell aggregation and aggregate coalescence in a 3D environment. Moreover, the same may be true for CD44. Variants of CD44 have been shown to cooperate with integrin ß-1 in osteopontin binding.Citation33
It must be emphasized, however, that cancer cell aggregation and aggregate coalescence in a 3D environment are complex in vitro behaviors specific to tumorigenic cells.Citation1-Citation3,Citation44 Many of the tested mAbs that bind to proteins may target domains of surface molecules that do not interfere with protein function, but that does not exclude these molecules as potential blocking targets in future screens of mAbs. We have also suggested the possibility that redundancy may exist among the different integrins, and this may explain some of the negative results obtained, but the results of experiments to test this hypothesis have not borne this hypothesis out. We have also not tested whether any of the mAbs in the collection interfere with the differentiation of aggregates after prolonged incubation in a 3D environment. Therefore, it seems likely that an expanded screen in a 3D environment, the use of multiple mAbs targeting functionally redundant integrins, and the effects on the differentiation of aggregates, will reveal additional mAbs and target integrins that play central roles in cancer cell aggregation and aggregate coalescence. Finally, the identified mAbs will be tested in mouse models to assess their effectiveness in blocking tumorigenesis in vivo.
Material and methods
Cell lines
The three cell lines used in the screen were MB-231, derived from a breast carcinoma, HTB-66, derived from a malignant melanoma and U87, derived from a primary glioblastoma.Citation40,Citation80,Citation81 The three were obtained from the American Type Culture Collection (ATCC). MB-231 cells and the non-tumorigenic cell line MCF-10A were cultured in DMEM/F12 medium (Thermo Fisher Scientific) supplemented with 5% horse serum (Thermo Fisher Scientific) and human recombinant epidermal growth factor (Cat.# E-9644), insulin (Cat.# I-9278), hydrocortisone (Cat.# H-0135), cholera toxin (Cat.# C-8052, Sigma Aldrich), and penicillin/streptomycin (Thermo Fisher Scientific).Citation39,Citation44,Citation80 HTB-66 and U87 cells were cultured in MEM medium supplemented with 1% sodium pyruvate, 1X non-essential amino acids (all Thermo Fisher Scientific), 10% fetal bovine serum (Atlanta Biologicals), and penicillin/streptomycin (Thermo Fisher Scientific).
Monoclonal antibodies
The 266 mAbs used in this study were obtained from the DSHB (www.dshb.biology.edu) and are listed with their target antigens in . Characterization of these mAbs, including their capacity to be used for western blot analysis, immunoprecipitation, immunohistochemistry, immunocytostaining, FACS analysis, ELISA analysis, and functional blocking are provided in supplemental Table S1. Hybridomas were cultured in Hyclone ADCF mAb medium (GE Healthcare, Cat.# SH30349.02), containing 1% glutamax, 1% sodium pyruvate, 1% penicillin streptomycin (all Thermo Fisher Scientific) supplemented with 0.1% gentamycin (IBI Scientific, Cat.# IB02030), at 37°C in 7.5% CO2.Citation82-Citation84 In all cases, supernatants were harvested from hybridoma cultures that had reached concentrations of 1.5 to 2.0 × 10⁶ cells per ml. The mAbs were affinity purified using a Protein G HP spin trap column (GE Healthcare, Cat.#28903134) and concentrated using an ultra-centrifugal filter (EMD Millipore, Cat.# UFC905024). In some cases, Protein G in the column was replaced with Protein L resin (GenScript Cat.# L00239).
Coalescence assay
The screen for inhibition of coalescence by mAbs in a 3D Matrigel environment was described previously and is diagrammed in .Citation3 To each well in a 96-well plate (Corning Inc.), 50 µl of Matrigel in growth factor medium (Corning Inc., Cat.# 354234) at 5°C was added to form a cushion. The cushion polymerized by incubating for 30 minutes at 37°C. Cells suspended in the respective growth medium at 3 × 10⁵ per ml were strained through a 70 µm strainer to ensure single cell suspensions. The purified mAb was added to 60 µl of medium to achieve the noted final concentration and added to 80 µl of cells. Sixty µl of medium lacking mAb was added as a control. To this mixture, 30 µl of Matrigel in growth medium at 5°C was added to achieve a final volume of 170 µl. Eighty µl of the cell/Matrigel mixture was immediately distributed over the Matrigel cushion in each tissue culture dish well, and the mixture was incubated at 37°C in 5% CO2 for 30 minutes, resulting in Matrigel gelation. All mAb preparations were tested in duplicate. Coalescence was monitored in each 3D Matrigel preparation over a 4 day period every 24 hours using an Axioivert 100 inverted microscope (Carl Zeiss, Inc.), equipped with a 10x phase contrast objective and an XCD-V50 digital camera (Sony Corp.).
Immunofluorescent staining of fixed cells
Cells were dispersed on a cover slip in a 20 mm petri dish and grown overnight in growth medium. Cells were fixed in 3.8% paraformaldehyde (Electron Microscopy Science), washed with Tris buffer solution, TBS pH7.6 (Thermo Fisher Scientific) and blocked with 1% bovine serum albumin in TBS, pH7.6, for one hour. Preparations were then washed and treated with 10 µg per ml of mAb. For containing experiments, cells were treated with 5 µg per ml of each mAb, then washed three times. Single mAb-stained preparations were treated with affinity-purified fluorescent anti-rat IgG H + L Alexa Fluor 488 antibody (Thermo Fisher Scientific, Cat.# A-11006) or with the affinity-purified fluorescent anti-mouse IgG H + L Alexa Fluor 488 antibody (Jackson ImmunoResearch, Cat.# 115–545-003) at a 1:1000 dilution for 1 hour. Double mAb stained preparations were treated with the secondary anti-rat IgG H + L Alexa Fluor 488 antibody (Thermo Fisher Scientific, Cat.# A-11006) and secondary affinity purified anti-mouse IgG H + L R-Phycoerythrin antibody (Thermo Fisher Scientific, Cat.# P852) at a 1:1000 dilution for 1 hour. Cells were imaged with a EOS Rebel T3i/EOS 600D camera (Canon) attached to a Nikon TE2000 inverted epifluorescence microscope (Nikon Instruments).
Immunostaining of live aggregates in matrigel
Wells of a µ-slide Angiogenesis 15-well chamber slide (ibidi USA, Inc., Cat.# 81506) were coated with 8 µl of phenol red-free Matrigel (Corning Inc., Cat.# 356237) to provide a Matrigel cushion. To avoid cross-reaction with the mouse-derived Matrigel, the secondary antibody step was omitted. Instead, purified mAbs were directly labeled with the AnaTag HiLyte 750 nm or 488 nm Labeling Kit (ANASPEC, Cat.#AS72043 and AS72047) according to the manufacturer’s instruction. Eighty µl of cells at a concentration of 3 × 10⁵ per ml in growth medium lacking phenol red (HyClone) were mixed with labeled antibody at a final concentration of 5 µg/ml each in 30 µl of phenol red-free Matrigel. Ten µl of this mixture was applied to the Matrigel cushion. After polymerization at 37°, in 5% CO2, for 30 min, 20 µl of phenol red-free medium was added, and the preparation incubated in the dark for 4 days at 37°, in 5% CO2. The cell preparations were imaged using a Leica SP8 STDE confocal microscope. Image processing for analysis was done using Fiji software.Citation85
Cell viability by MTT reduction assay
Cells were cultured in the described 3D assay preparation in phenol-free Matrigel (Corning, Cat.# 356237) with or without mAb. The final mAb concentration was 30 µg/ml. On Day 4, 5 µl of 5 mM MTT (Thermo Fisher Scientific, Cat.# M6494) was added directly to the wells, to a final concentration of 100 µM. After 6 hours of incubation, cells were imaged and scored for formazan formation using a EOS Rebel T3i/EOS 600D camera (Canon) attached to a Nikon TE2000 inverted epifluorescence microscope (Nikon Instruments).
Cell division in 3D matrigel model
A glass-windowed, 65 mm Petri dishes (Cellvis, D60-3–0-N), custom modified in house for DIC microscopy, was employed as previously described.Citation3 In brief, a Matrigel cushion was cast on the glass bottom of a Petri dish. Cells in liquid Matrigel (5°C) were filtered through a 70 µm cell strainer. Each mAb was added to a final concentration of 540 µg/ml. A 750 µl aliquot of the cell/Matrigel/mAb mixture was then cast on the Matrigel coated glass window of the Petri dish. The 1.5 mm-thick preparation was incubated for 30 minutes at 37°C in 5% CO2 to allow gelation, and medium added. The preparation was positioned on the motor-driven stage of a Zeiss Axio Imager M2 microscope (Carl Zeiss Inc.) equipped with DIC optics and an AxioCam 503 mono color CCD camera (Carl Zeiss Inc.). The camera, the motor and the microscope were computer-synchronized. The microscope was housed in an incubator, set at 37°C in 5% CO2. A collection of 150 DIC optical sections were obtained in a 45-second period and repeated every 10 minutes for 4 days. Optical sections were directly saved as jpeg images and processed using J3D-DIAS 4.2.Citation3
Disclosure Interest
The authors report no conflict of interest.
Abbreviations
| DSHB | = | Developmental Studies Hybridoma Bank |
| DMEM | = | Dulbecco’s modified Eagle medium |
| ELISA | = | enzyme linked immunosorbent assay |
| FACS | = | fluorescent activated cell sorting; mAb, monoclonal antibody |
| mAb | = | monoclonal antibody |
| MB-231 | = | MDA-MB-231 |
| MEM | = | modified Eagle’s medium |
| NEA | = | Anon-essential amino acids |
| 2D | = | 2 dimensional |
| 3D | = | 3 dimensional |
Correction Statement
This article has been republished with minor changes. These changes do not impact the academic content of the article.
Supplemental Material
Download Zip (3.4 MB)Acknowledgments
These studies were supported by the Developmental Studies Hybridoma Bank, a National Resource created by NIH and housed at the University of Iowa.
Supplementary material
Supplemental data for this article can be accessed on the publisher’s website.
References
- Scherer A, Kuhl S, Wessels D, Lusche DF, Hanson B, Ambrose J, Voss, E., Fletcher, E., Goldman, C., Soll, D. R., et al. A computer-assisted 3D model for analyzing the aggregation of tumorigenic cells reveals specialized behaviors and unique cell types that facilitate aggregate coalescence. PLoS One. 2015;10:e0118628. doi:10.1371/journal.pone.0118628.
- Ambrose J, Livitz M, Wessels D, Kuhl S, Lusche DF, Scherer A, Voss E, Soll DR. Mediated coalescence: a possible mechanism for tumor cellular heterogeneity. Am J Cancer Res. 2015;5:3485–504.
- Wessels D, Lusche DF, Voss E, Kuhl S, Buchele EC, Klemme MR, Russell KB, Ambrose J, Soll BA, Bossler A, et al. Melanoma cells undergo aggressive coalescence in a 3D Matrigel model that is repressed by anti-CD44. PLoS One. 2017;12:e0173400. doi:10.1371/journal.pone.0173400.
- Weaver VM, Petersen OW, Wang F, Larabell CA, Briand P, Damsky C, Bissell MJ. Reversion of the malignant phenotype of human breast cells in three-dimensional culture and in vivo by integrin blocking antibodies. J Cell Biol. 1997;137:231–45.
- Mukhopadhyay R, Theriault RL, Price JE. Increased levels of alpha6 integrins are associated with the metastatic phenotype of human breast cancer cells. Clin Exp Mets. 1999;17:325–32.
- Gehlsen KR, Dillner L, Engvall E, Ruoslahti E. The human laminin receptor is a member of the integrin family of cell adhesion receptors. Science. 1988;241:1228–29.
- Chen WT, Hasegawa E, Hasegawa T, Weinstock C, Yamada KM. Development of cell surface linkage complexes in cultured fibroblasts. J Cell Biol. 1985;100:1103–14.
- Horwitz A, Duggan K, Greggs R, Decker C, Buck C. The cell substrate attachment (CSAT) antigen has properties of a receptor for laminin and fibronectin. J Cell Biol. 1985;101:2134–44.
- Pytela R, Pierschbacher MD, Ruoslahti E. Identification and isolation of a 140 kd cell surface glycoprotein with properties expected of a fibronectin receptor. Cell. 1985;40:191–98.
- Wayner EA, Carter WG. Identification of multiple cell adhesion receptors for collagen and fibronectin in human fibrosarcoma cells possessing unique alpha and common beta subunits. J Cell Biol. 1987;105:1873–84.
- Carter WG, Wayner EA, Bouchard TS, Kaur P. The role of integrins alpha 2 beta 1 and alpha 3 beta 1 in cell-cell and cell-substrate adhesion of human epidermal cells. J Cell Biol. 1990;110:1387–404.
- Hall DE, Reichardt LF, Crowley E, Holley B, Moezzi H, Sonnenberg A, Damsky CH. The alpha 1/beta 1 and alpha 6/beta 1 integrin heterodimers mediate cell attachment to distinct sites on laminin. J Cell Biol. 1990;110:2175–84.
- Dedhar S, Jewell K, Rojiani M, Gray V. The receptor for the basement membrane glycoprotein entactin is the integrin alpha 3/beta 1. J Biol Chem. 1992;267:18908–14.
- Gehlsen KR, Sriramarao P, Furcht LT, Skubitz AP. A synthetic peptide derived from the carboxy terminus of the laminin A chain represents a binding site for the alpha 3 beta 1 integrin. J Cell Biol. 1992;117:449–59.
- DeFreitas MF, Yoshida CK, Frazier WA, Mendrick DL, Kypta RM, Reichardt LF. Identification of integrin alpha 3 beta 1 as a neuronal thrombospondin receptor mediating neurite outgrowth. Neuron. 1995;15:333–43.
- Wu C, Chung AE, McDonald JA. A novel role for alpha 3 beta 1 integrins in extracellular matrix assembly. J Cell Sci. 1995;108:2511–23.
- Fukushi J, Makagiansar IT, Stallcup WB. NG2 proteoglycan promotes endothelial cell motility and angiogenesis via engagement of galectin-3 and alpha3beta1 integrin. Mol Biol Cell. 2004;15:3580–90. doi:10.1091/mbc.e04-03-0236.
- Tamkun JW, DeSimone DW, Fonda D, Patel RS, Buck C, Horwitz AF, Hynes RO. Structure of integrin, a glycoprotein involved in the transmembrane linkage between fibronectin and actin. Cell. 1986;46:271–82.
- Yamaguchi A, Tanoue K, Yamazaki H. Secondary signals mediated by GPIIb/IIIa in thrombin-activated platelets. Biochim Biophys Acta. 1990;1054:8–13.
- Hughes PE, O’Toole TE, Ylanne J, Shattil SJ, Ginsberg MH. The conserved membrane-proximal region of an integrin cytoplasmic domain specifies ligand binding affinity. J Biol Chem. 1995;270:12411–17.
- Kaufmann R, Frosch D, Westphal C, Weber L, Klein CE. Integrin VLA-3: ultrastructural localization at cell-cell contact sites of human cell cultures. J Cell Biol. 1989;109:1807–15.
- Larjava H, Peltonen J, Akiyama SK, Yamada SS, Gralnick HR, Uitto J, Yamada KM. Novel function for beta 1 integrins in keratinocyte cell-cell interactions. J Cell Biol. 1990;110:803–15.
- Nakamura K, Iwamoto R, Mekada E. Membrane-anchored heparin-binding EGF-like growth factor (HB-EGF) and diphtheria toxin receptor-associated protein (DRAP27)/CD9 form a complex with integrin alpha 3 beta 1 at cell-cell contact sites. J Cell Biol. 1995;129:1691–705.
- Frolikova M, Sebkova N, Ded L, Dvorakova-Hortova K. Characterization of CD46 and beta1 integrin dynamics during sperm acrosome reaction. Sci Rep. 2016;6:33714. doi:10.1038/srep33714.
- Gehlsen KR, Davis GE, Sriramarao P. Integrin expression in human melanoma cells with differing invasive and metastatic properties. Clin Exp Mets. 1992;10:111–20.
- Sachs N, Secades P, van Hulst L, Kreft M, Song JY, Sonnenberg A. Loss of integrin alpha3 prevents skin tumor formation by promoting epidermal turnover and depletion of slow-cycling cells. Proc Natl Acad Sci USA. 2012;109:21468–73. doi:10.1073/pnas.1204614110.
- Ganguly KK, Pal S, Moulik S, Chatterjee A. Integrins and metastasis. Cell Adh Migr. 2013;7:251–61. doi:10.4161/cam.23840.
- Weber GF, Ashkar S, Glimcher MJ, Cantor H. Receptor-ligand interaction between CD44 and osteopontin (Eta-1). Science. 1996;271:509–12.
- Naor D, Sionov RV, Ish-Shalom D. CD44: structure, function, and association with the malignant process. Adv Cancer Res. 1997;71:241–319.
- Goodison S, Urquidi V, Tarin D. CD44 cell adhesion molecules. Mol Pathol. 1999;52:189–96.
- Piotrowicz RS, Damaj BB, Hachicha M, Incardona F, Howell SB, Finlayson M. A6 peptide activates CD44 adhesive activity, induces FAK and MEK phosphorylation, and inhibits the migration and metastasis of CD44-expressing cells. Mol Cancer Ther. 2011;10:2072–82. doi:10.1158/1535-7163.MCT-11-0351.
- Senbanjo LT, Chellaiah MA. CD44: a multifunctional cell surface adhesion receptor is a regulator of progression and metastasis of cancer cells. Front Cell Dev Biol. 2017;5:18. doi:10.3389/fcell.2017.00018.
- Katagiri YU, Sleeman J, Fujii H, Herrlich P, Hotta H, Tanaka K, Chikuma S, Yagita H, Okumura K, Murakami M, et al. CD44 variants but not CD44s cooperate with beta1-containing integrins to permit cells to bind to osteopontin independently of arginine-glycine-aspartic acid, thereby stimulating cell motility and chemotaxis. Cancer Res. 1999;59:219–26.
- Kurtis MS, Tu BP, Gaya OA, Mollenhauer J, Knudson W, Loeser RF, Knudson CB, Sah RL. Mechanisms of chondrocyte adhesion to cartilage: role of beta1-integrins, CD44, and annexin V. J Orthop Res. 2001;19:1122–30. doi:10.1016/S0736-0266(01)00051-1.
- Knudson W, Loeser RF. CD44 and integrin matrix receptors participate in cartilage homeostasis. Cell Mol Life Sci. 2002;59:36–44.
- Kren A, Baeriswyl V, Lehembre F, Wunderlin C, Strittmatter K, Antoniadis H, Fässler R, Cavallaro U, Christofori G. Increased tumor cell dissemination and cellular senescence in the absence of beta1-integrin function. Embo J. 2007;26:2832–42. doi:10.1038/sj.emboj.7601738.
- Lee JL, Wang MJ, Sudhir PR, Chen JY. CD44 engagement promotes matrix-derived survival through the CD44-SRC-integrin axis in lipid rafts. Mol Cell Biol. 2008;28:5710–23. doi:10.1128/MCB.00186-08.
- Hughes CS, Postovit LM, Lajoie GA. Matrigel: a complex protein mixture required for optimal growth of cell culture. Proteomics. 2010;10:1886–90. doi:10.1002/pmic.200900758.
- Soule HD, Maloney TM, Wolman SR, Peterson WD Jr., Brenz R, McGrath CM, Russo J, Pauley RJ, Jones RF, Brooks SC. Isolation and characterization of a spontaneously immortalized human breast epithelial cell line, MCF-10. Cancer Res. 1990;50:6075–86.
- Clark MJ, Homer N, O’Connor BD, Chen Z, Eskin A, Lee H, Merriman B, Nelson SF, Horwitz MS. U87MG decoded: the genomic sequence of a cytogenetically aberrant human cancer cell line. PLoS Genet. 2010;6:e1000832. doi:10.1371/journal.pgen.1000832.
- Takada Y, Puzon W. Identification of a regulatory region of integrin beta 1 subunit using activating and inhibiting antibodies. J Biol Chem. 1993;268:17597–601.
- Belkin VM, Kozlova NI, Bychkova VV, Shekhonin BV. Beta 1 integrin subunit dimerization via disulfide bonds. Biochem Mol Biol Int. 1996;40:53–60.
- Goodpaster T, Randolph-Habecker J. A flexible mouse-on-mouse immunohistochemical staining technique adaptable to biotin-free reagents, immunofluorescence, and multiple antibody staining. J Histochem Cytochem. 2014;62:197–204. doi:10.1369/0022155413511620.
- Lusche DF, Buchele EC, Russell KB, Soll BA, Vitolo MI, Klemme MR, Wessels DJ, Soll DR. Overexpressing TPTE2 (TPIP), a homolog of the human tumor suppressor gene PTEN, rescues the abnormal phenotype of the PTEN(-/-) mutant. Oncotarget. 2018;9:21100–21. doi:10.18632/oncotarget.24941.
- Slater TF, Sawyer B, Straeuli U. Studies on succinate-tetrazolium reductase systems. Iii. Points of coupling of four different tetrazolium salts. Biochim Biophys Acta. 1963;77:383–93.
- Yazlovitskaya EM, Viquez OM, Tu T, De Arcangelis A, Georges-Labouesse E, Sonnenberg A, Pozzi A, Zent R. The laminin binding alpha3 and alpha6 integrins cooperate to promote epithelial cell adhesion and growth. Matrix Biol. 2018. doi:10.1016/j.matbio.2018.08.010.
- Das L, Anderson TA, Gard JM, Sroka IC, Strautman SR, Nagle RB, Morrissey C, Knudsen BS, Cress AE. Characterization of laminin binding integrin internalization in prostate cancer cells. J Cell Biochem. 2017;118:1038–49. doi:10.1002/jcb.25673.
- Wayner EA, Hoffstrom BG. Development of monoclonal antibodies to integrin receptors. Methods Enzymol. 2007;426:117–53. doi:10.1016/S0076-6879(07)26007-0.
- Carter WG, Kaur P, Gil SG, Gahr PJ, Wayner EA. Distinct functions for integrins alpha 3 beta 1 in focal adhesions and alpha 6 beta 4/bullous pemphigoid antigen in a new stable anchoring contact (SAC) of keratinocytes: relation to hemidesmosomes. J Cell Biol. 1990;111:3141–54.
- Sonnenberg A, Modderman PW, Hogervorst F. Laminin receptor on platelets is the integrin VLA-6. Nature. 1988;336:487–89. doi:10.1038/336487a0.
- Heider KH, Dammrich J, Skroch-Angel P, Muller-Hermelink HK, Vollmers HP, Herrlich P, Ponta H. Differential expression of CD44 splice variants in intestinal- and diffuse-type human gastric carcinomas and normal gastric mucosa. Cancer Res. 1993;53:4197–203.
- Olsson E, Honeth G, Bendahl PO, Saal LH, Gruvberger-Saal S, Ringner M, Vallon-Christersson J, Jönsson G, Holm K, Lövgren K, et al. CD44 isoforms are heterogeneously expressed in breast cancer and correlate with tumor subtypes and cancer stem cell markers. BMC Cancer. 2011;11:418. doi:10.1186/1471-2407-11-418.
- Basakran NS. CD44 as a potential diagnostic tumor marker. Saudi Med J. 2015;36:273–79. doi:10.15537/smj.2015.3.9622.
- Belitsos PC, Hildreth JE, August JT. Homotypic cell aggregation induced by anti-CD44(Pgp-1) monoclonal antibodies and related to CD44(Pgp-1) expression. J Immunol. 1990;144:1661–70.
- Peach RJ, Hollenbaugh D, Stamenkovic I, Aruffo A. Identification of hyaluronic acid binding sites in the extracellular domain of CD44. J Cell Biol. 1993;122:257–64.
- Bajorath J, Greenfield B, Munro SB, Day AJ, Aruffo A. Identification of CD44 residues important for hyaluronan binding and delineation of the binding site. J Biol Chem. 1998;273:338–43.
- Gardner MJ, Catterall JB, Jones LM, Turner GA. Human ovarian tumour cells can bind hyaluronic acid via membrane CD44: a possible step in peritoneal metastasis. Clin Exp Mets. 1996;14:325–34.
- Brown PJ, Juliano RL. Monoclonal antibodies to distinctive epitopes on the alpha and beta subunits of the fibronectin receptor. Exp Cell Res. 1988;177:303–18.
- Hayashi Y, Haimovich B, Reszka A, Boettiger D, Horwitz A. Expression and function of chicken integrin beta 1 subunit and its cytoplasmic domain mutants in mouse NIH 3T3 cells. J Cell Biol. 1990;110:175–84.
- Zhang XP, Puzon-McLaughlin W, Irie A, Kovach N, Prokopishyn NL, Laferte S, Takeuchi K, Tsuji T, Takada Y. Alpha 3 beta 1 adhesion to laminin-5 and invasin: critical and differential role of integrin residues clustered at the boundary between alpha 3 N-terminal repeats 2 and 3. Biochem. 1999;38:14424–31.
- Byron A, Humphries JD, Askari JA, Craig SE, Mould AP, Humphries MJ. Anti-integrin monoclonal antibodies. J Cell Sci. 2009;122:4009–11. doi:10.1242/jcs.056770.
- Pytela R, Pierschbacher MD, Ruoslahti E. A 125/115-kDa cell surface receptor specific for vitronectin interacts with the arginine-glycine-aspartic acid adhesion sequence derived from fibronectin. Proc Natl Acad Sci USA. 1985;82:5766–70.
- Hynes RO. Integrins: a family of cell surface receptors. Cell. 1987;48:549–54.
- Petersen OW, Ronnov-Jessen L, Howlett AR, Bissell MJ. Interaction with basement membrane serves to rapidly distinguish growth and differentiation pattern of normal and malignant human breast epithelial cells. Proc Natl Acad Sci USA. 1992;89:9064–68.
- Vinci M, Gowan S, Boxall F, Patterson L, Zimmermann M, Court W, Lomas C, Mendiola M, Hardisson D, Eccles SA. Advances in establishment and analysis of three-dimensional tumor spheroid-based functional assays for target validation and drug evaluation. BMC Biol. 2012;10:29. doi:10.1186/1741-7007-10-29.
- Pardee AB. G1 events and regulation of cell proliferation. Science. 1989;246:603–08.
- Hanahan D, Weinberg RA. The hallmarks of cancer. Cell. 2000;100:57–70.
- Hanahan D, Weinberg RA. Hallmarks of cancer: the next generation. Cell. 2011;144:646–74. doi:10.1016/j.cell.2011.02.013.
- Wyllie AH, Kerr JF, Currie AR. Cell death: the significance of apoptosis. Int Rev Cytol. 1980;68:251–306.
- Lowe SW, Bodis S, Bardeesy N, McClatchey A, Remington L, Ruley HE, Fisher DE, Jacks T, Pelletier J, Housman DE. Apoptosis and the prognostic significance of p53 mutation. Cold Spring Harb Symp Quant Biol. 1994;59:419–26.
- Sporn MB, Todaro GJ. Autocrine secretion and malignant transformation of cells. N Engl J Med. 1980;303:878–80. doi:10.1056/NEJM198010093031511.
- Ertao Z, Jianhui C, Chuangqi C, Changjiang Q, Sile C, Yulong H, Hui, W., Shirong, C. Autocrine Sonic hedgehog signaling promotes gastric cancer proliferation through induction of phospholipase Cgamma1 and the ERK1/2 pathway. J Exp Clin Cancer Res. 2016;35:63. doi:10.1186/s13046-016-0444-6.
- Woodhouse EC, Chuaqui RF, Liotta LA. General mechanisms of metastasis. Cancer. 1997;80:1529–37.
- Rl B, Hy C, Messing A, van Dyke T, Aj L, Palmiter RD. Transgenic mice harboring SV40 T-antigen genes develop characteristic brain tumors. Cell. 1984;37:367–79.
- Abercrombie M, Heaysman JE. Observations on the social behaviour of cells in tissue culture. II. Monolayering of fibroblasts. Exp Cell Res. 1954;6:293–306.
- Abercrombie M. Contact inhibition and malignancy. Nature. 1979;281:259–62.
- Slaughter DP, Southwick HW, Smejkal W. Field cancerization in oral stratified squamous epithelium; clinical implications of multicentric origin. Cancer. 1953;6:963–68.
- Lochhead P, Chan AT, Nishihara R, Fuchs CS, Beck AH, Giovannucci E, Ogino S. Etiologic field effect: reappraisal of the field effect concept in cancer predisposition and progression. Mod Pathol. 2015;28:14–29. doi:10.1038/modpathol.2014.81.
- Smoller BR. Histologic criteria for diagnosing primary cutaneous malignant melanoma. Mod Pathol. 2006;19(Suppl 2):S34–40. doi:10.1038/modpathol.3800508.
- Cailleau R, Young R, Olive M, Reeves WJ Jr. Breast tumor cell lines from pleural effusions. J Natl Cancer Inst. 1974;53:661–74.
- Moore GE, Gerner RE. Malignant melanoma. Surg Gynecol Obstet. 1971;132:427–36.
- Sanchez P, Daniels KJ, Park YN, Soll DR. Generating a battery of monoclonal antibodies against native green fluorescent protein for immunostaining, FACS, IP, and ChIP using a unique adjuvant. Monoclon Antib Immunodiagn Immunother. 2014;33:80–88. doi:10.1089/mab.2013.0089.
- Park YN, Glover RA, Daniels KJ, Soll DR. Generation and validation of monoclonal antibodies against the maltose binding protein. Monoclon Antib Immunodiagn Immunother. 2016;35:104–08. doi:10.1089/mab.2015.0072.
- Conway TP, Daniels KJ, Park YN, Soll DR. Generating a battery of monoclonal antibodies against firefly luciferase for dot blot analysis, western blot analysis, and immunostaining of cells in culture and paraffin sections. Monoclon Antib Immunodiagn Immunother. 2018;37:45–51. doi:10.1089/mab.2017.0057.
- Schindelin J, Arganda-Carreras I, Frise E, Kaynig V, Longair M, Pietzsch T, Preibisch S, Rueden C, Saalfeld S, Schmid B, et al. Fiji: an open-source platform for biological-image analysis. Nat Methods. 2012;9:676–82. doi:10.1038/nmeth.2019.