
ABSTRACT
Immunization of mice followed by hybridoma or B-cell screening is one of the most common antibody discovery methods used to generate therapeutic monoclonal antibody (mAb) candidates. There are a multitude of different immunization protocols that can generate an immune response in animals. However, an extensive analysis of the antibody repertoires that these alternative immunization protocols can generate has not been performed. In this study, we immunized mice that transgenically express human antibodies with either programmed cell death 1 protein or cytotoxic T-lymphocyte associated protein 4 using four different immunization protocols, and then utilized a single cell microfluidic platform to generate tissue-specific, natively paired immunoglobulin (Ig) repertoires from each method and enriched for target-specific binders using yeast single-chain variable fragment (scFv) display. We deep sequenced the scFv repertoires from both the pre-sort and post-sort libraries. All methods and both targets yielded similar oligoclonality, variable (V) and joining (J) gene usage, and divergence from germline of enriched libraries. However, there were differences between targets and/or immunization protocols for overall clonal counts, complementarity-determining region 3 (CDR3) length, and antibody/CDR3 sequence diversity. Our data suggest that, although different immunization protocols may generate a response to an antigen, performing multiple immunization protocols in parallel can yield greater Ig diversity. We conclude that modern microfluidic methods, followed by an extensive molecular genomic analysis of antibody repertoires, can be used to quickly analyze new immunization protocols or mouse platforms.
Introduction
Therapeutic monoclonal antibodies (mAbs) are often discovered through mouse immunization followed by hybridoma screening or single B-cell screening. The use of transgenic mice with fully human variable regions has enabled the discovery of fully human mAbs through mouse immunization and screening.Citation1 However, there are numerous ways in which to perform the immunization by utilizing a combination of different antigen preparations, adjuvants, injection sites, and dosing schedules. Different immunization methods have been shown to stimulate different immune responses, affecting the titer and characteristics of the resulting antibodies.Citation2,Citation3 However, the extent to which diverse immunization protocols influence the antibody repertoire response has yet to be fully characterized, partly due to the difficulty of characterizing diverse antibody repertoires.
To comprehensively determine antibody repertoire sequence diversity, individual heavy and light chain sequences can be obtained through high-throughput sequencing of B cells in bulk.Citation4,Citation5 However, such methods are of limited utility because heavy and light chain immunoglobulin (Ig) are not natively paired. Native Ig pairing is a requirement for functional characterization of antibodies. Conventionally, fusion of mouse B cells into hybridomas can be used for functional screening, but, even with automation, this is a slow process that does not comprehensively characterize mouse repertoires. Single cell plating of single hybridomas or B cells into individual wells prior to sequencing can link heavy and light chain sequences, but such methods are also limited to thousands of antibodies.Citation6–Citation11 To comprehensively characterize binders in diverse repertoires, we previously developed technologies that recreate recombinant, natively paired antibody libraries suitable for high-throughput screening and sequencing.Citation12,Citation13 The DNA libraries are introduced into a recombinant yeast expression system and multiple rounds of fluorescence-activated cell sorting (FACS) enrich the library for antigen-specific binders.
In this study, we used our B-cell screening platform to characterize the tissue-specific antibody repertoires of transgenic humanized mice (Trianni MouseTM) that were immunized with two different antigens using four different immunization protocols. We chose the transmembrane human proteins cytotoxic T-lymphocyte associated protein 4 (CTLA-4) and programmed cell death 1 (PD-1) as targets. Antibodies against both proteins have shown efficacy as cancer immunotherapy drugsCitation14,Citation15 by functioning to modulate T-cell checkpoints in, for example, melanomaCitation16 and non-small-cell lung cancer.Citation17 For each antigen and each immunization method, we first captured the natively paired antibody libraries from up to three tissue types, and then we expressed these libraries as scFv in a recombinant yeast display system and used FACS to enrich for antigen-binding populations, using deep sequencing to compare the repertoires before and after sorting. We examined antibody abundance, complementarity-determining region 3 (CDR3) length, variable (V) and joining (J) gene usage, divergence from germline, and sequence diversity, and found that different immunization methods led to both similar and distinct antibody sequence characteristics.
Results
Overview of the experimental approach
We immunized Trianni humanized mice against two distinct targets (human PD-1 and human CTLA-4) using four different immunization protocols: ALD/MDP rapid, ISA50 rapid, ISA50 12 week, and Cells/DNA (). The antigens for the first three protocols were soluble His-tagged extracellular domain proteins, while the antigens for the Cells/DNA protocol were mouse cells and DNA plasmids expressing full-length, untagged proteins. The rapid protocols and the Cells/DNA protocol involved multiple injections per week for four weeks, while the 12-week protocol involved one injection every four weeks for 12 weeks (see Methods section for additional details on the protocols). After a positive serum response to the antigen was determined by enzyme-linked immunosorbent assay (ELISA), single-cell suspensions were isolated from the spleen, lymph nodes, and in some cases bone marrow of the mice.
Figure 1. Workflow overview. (a) Mice were immunized using one of four immunization methods (ALD/MDP rapid, ISA50 rapid, ISA50 12 week, and Cells/DNA), and spleen, lymph node, and sometimes bone marrow tissues were harvested. (b) Millions of individual B cells from the immunized mice were encapsulated into droplets using a microfluidic system. The cells were lysed, RNA was captured from the single cells, and IgK-IgH scFv libraries were created with emulsion RT-PCR. The bottom image shows the droplet generation process. (c) Linked IgK-IgH DNA libraries were transformed into a yeast display system and sorted against antigen with FACS. The repertoires were deep sequenced before and after sorting. (d) The antibody repertoires were analyzed by a multitude of molecular genomic metrics to identify similarities and differences between the immunization methods/tissues.
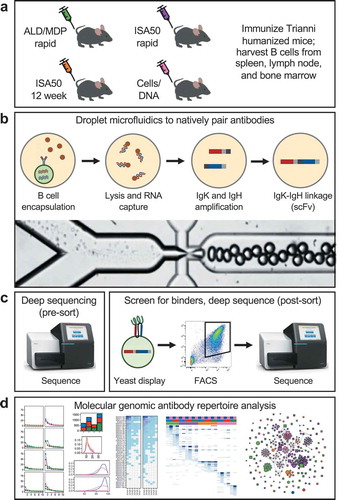
Using our previously described high-throughput microfluidic antibody discovery platform,Citation12,Citation18,Citation19 B cells isolated from each tissue (>2 million total cells per immunization method; Supplementary Table S1) were encapsulated into droplets such that each droplet contained a single B cell (). The heavy and light (kappa only) chain sequences from each cell were amplified within droplets to generate an scFv sequence that retains the proper heavy:light Ig pairing of the original B cell. The DNA products were extracted from the emulsion to create a library of natively paired scFv sequences. To enrich for antigen-specific binders, the scFv libraries were expressed in a yeast surface display system and multiple rounds of FACS sorting was performed using biotinylated soluble antigens (). The scFv DNA libraries before and after FACS enrichment were deep sequenced, followed by in-depth bioinformatic analysis of the antibody repertoire profiles ().
Analysis of serum titers
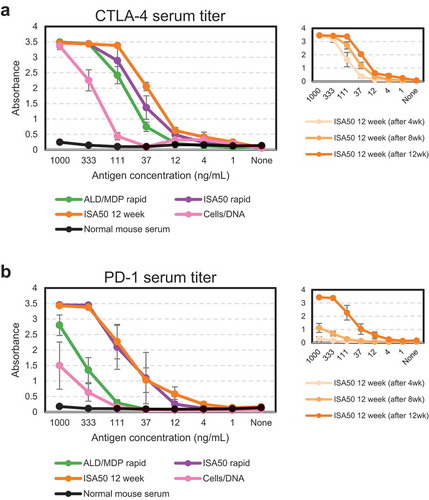
Prior to harvesting any tissues, an ELISA against soluble antigen was performed to measure the presence of antigen-specific antibodies in the mouse serum of each animal. All methods generated a positive serum titer, and the antibody titers were generally stronger against CTLA-4 () than PD-1 () for all immunization methods. For both antigens, the ISA50 12-week protocol gave the strongest response, followed by ISA50 rapid, ALD/MDP rapid, and then Cells/DNA. We note that since the Cells/DNA method did not use soluble antigen for immunization, but soluble protein was used for the ELISA, the signal may underrepresent the true target-specific antibody titer for those animals. A serum titer was obtained after each injection in the ISA50 12-week method, revealing a consistent increase in titer after each injection (, right inset).
Figure 2. Serum titers from immunized animals compared to normal mouse serum measured by ELISA prior to tissue harvest. Serum titers of individual CTLA-4 immunized (a) and PD-1 immunized (b) animals were averaged (± standard error) for each immunization method. ISA50 12-week titers were also measured at three time points (insets on right).
Isolation of scFv clones by yeast display
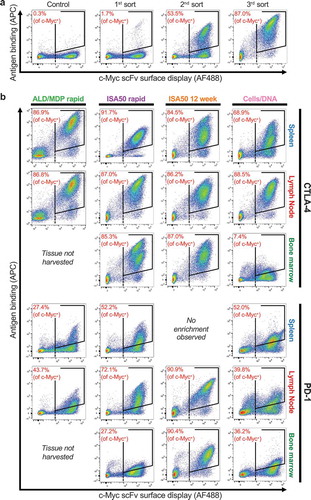
Yeast surface scFv expression libraries were generated from each tissue from each immunization method and subjected to FACS with soluble CTLA-4 or PD-1 antigen. Yeast that express an scFv on the cell surface were identified via detection of a C-terminal c-Myc tag (x-axis, AF488), and binding of strepavidin-APC was used to detect soluble biotinylated antigen (y-axis). Three rounds of sorting against soluble antigen were performed (), in which double-positive yeast cells were sorted, expanded, and re-stained after each round, leading to an increase in the enrichment after each sort. Initial pre-sort libraries showed low percentages of scFv-expressing yeast cells binding to the antigens at 50 nM (PD-1) or 70 nM (CTLA-4) final concentration (ranging from 0.3% to 5% for CTLA-4 and 0.1–0.7% for PD-1). After three rounds of sorting, the antigen-binding cells were further enriched, where on average 78.2% of scFv-expressing cells showed binding to CTLA-4 and 53.2% of scFv-expressing yeast cells showed binding to PD-1 (). Only one tissue (PD-1 spleen from ISA50 12 week) did not show any enrichment after three rounds of sorting.
Figure 3. FACS enrichment of antigen-specific binders using yeast display. The x-axis measures presence of a C-terminal c-Myc tag (AF488), indicating expression of an scFv on the surface of the cell. The y-axis measures the binding of antigen to the scFv-expressing cells (APC). The gates used for yeast selection (double positive) are indicated. A dashed black line identifies c-Myc+ yeast. (a) Example FACS data for a full three sort enrichment series (CTLA-4, ISA50 rapid, Lymph Node), including a control expressing an irrelevant scFv library. (b) The post-3rd sort FACS image is shown for each target, for each tissue, and for each immunization method. Note: the image for CTLA-4, ISA50 rapid, Lymph Node is the same image used for the 3rd sort from (a).
Immunoglobulin diversity pre- and post-sort
To fully characterize the antibody repertoires, we performed deep sequencing of the scFv libraries before and after FACS enrichment. Pre- and post-sort sequences reflect the diversity of the total antibody repertoire from immunized mice and the antigen-specific Ig repertoire, respectively. First, we quantified the number of scFv clones generated by the different immunization methods (; Supplementary Table S1). We conservatively define “clones” as the consensus of scFv sequences with ≤2 amino acid differences in the CDR3 sequences of the paired light+heavy chain Ig. For the CTLA-4 immunizations, the different immunization methods generated comparable numbers of clones both pre-sort (range 13,260–19,112) and post-sort (range 980–1,433). For the PD-1 immunization, the different methods generated a wider range of clones pre-sort (7,071–22,768) and post-sort (559–1,567). In all cases, the clonal diversity of the post-sort libraries represented less than 10% of the diversity of the initial pre-sort libraries. Interestingly, for both CTLA-4 and PD-1, the Cells/DNA method resulted in the lowest antibody titer (), but the highest number of antigen-specific scFv clones (), suggesting that the pre-sort titer against soluble antigen is not necessarily an indicator of how diverse an scFv library will be after sorting.
Figure 4. Overview of the diversity of the scFv libraries generated using different immunization methods, pre- and post-FACS enrichment of antigen-specific clones. (a) The number of unique scFv clones (defined as the consensus of closely related groups of sequences with ≤2 amino acid differences in their linked CDR3s) derived from CTLA-4 (left) and PD-1 (right) immunized mice. The bars represent the number of clones derived from the four different methods, color-coded by the tissue origin (Sp = Spleen, LN = Lymph nodes, BM = Bone marrow). Note that bone marrow was not harvested for the ALD/MDP rapid method. The top and bottom panels represent pre- and post-sort clone counts, respectively. (b) Oligoclonality of the various libraries as represented by the top ten most abundant clones in each library. The x-axis displays the clones in decreasing abundance while the y-axis represents the abundance (as percent of sequencing reads) of the corresponding clones. The colors represent the libraries derived from different tissue origins. Note that each repertoire is composed of a “long tail” of clones (total clone number is indicated in panel a) that are not shown. (c) Density plots of the distribution of heavy chain CDR3 amino acid lengths of the scFv clones for the various libraries. Each unique clone was only represented once and not scaled by clone abundance.
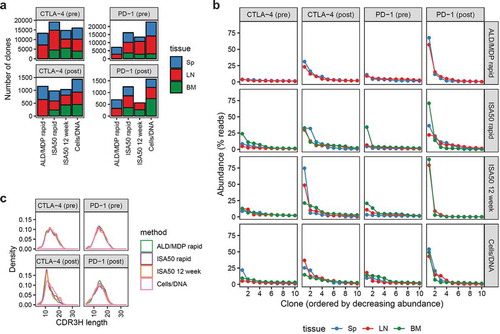
To assess oligoclonality of the libraries, we measured the abundance of individual clones as reflected by the number of their sequencing reads (). Pre-sort libraries had low oligoclonality with <0.3% of the clones having high abundance, defined as >1% of the sequencing reads of their respective libraries. In contrast, all post-sort libraries were more oligoclonal, where about 10× more clones were highly abundant in their respective libraries. In the most extreme case (PD-1, ISA50 12 week immunized, post-sort, bone marrow-derived library), a single clone represented 88.3% of the reads of the library. The different immunization methods did not result in noticeable differences in overall library oligoclonality.
The distribution of CDR3 amino acid sequence lengths is another feature that provides insight into repertoire composition. We surveyed CDR3 length distribution for both the light (CDR3K) and heavy (CDR3H) chains of all scFv libraries (). Both CTLA-4 and PD-1 pre-sort libraries had normally distributed CDR3H lengths with a median of 14 amino acids. For CTLA-4, FACS sorting enriched for clones with shorter CDR3H (median values for ALD/MDP rapid, ISA50 rapid, ISA50 12 week, and Cells/DNA were 11, 11, 12, and 13 amino acids, respectively). Conversely, there was no change in the distribution of CDR3H lengths post-sort for the PD-1 libraries. The light chain CDR3K had a median length of 9 amino acids for all libraries, both pre-sort and post-sort (Supplementary Figure S1).
Genetic factors impacting pre- and post-sort immunoglobulin diversity
V(D)J recombination of antibody gene segments contributes to the vast combinatorial diversity of antibodies.Citation20 To understand how the different immunization methods contribute to such diversity in Trianni mice, we compared V- and J-gene usage of the scFv clones from each library (; Supplementary Figure S2a, b). Pre-sort, V-J-gene usage was similar across the Ig repertoires generated using the different immunization methods. For example, all immunization methods for both targets shared not only the most common heavy chain V-J pair (IGHV3-33 pairing with IGHJ4), but also the most common light chain V-J pair (IGKV1-6 pairing with IGKJ1). For the heavy chain, IGHV3-33 paired to IGHJ4 remained the most common V-J pair in the post-sort libraries, though the different immunization methods led to varying patterns of V-J usage for less common pairs. Interestingly, FACS enriched for clones with less abundant V-J pairs for the light chain. For example, for the CTLA-4 library produced by the ISA50 rapid method, IGKV3-20 pairing with IGKJ3 was the 19th most common V-J pair pre-sort, but it was the most common pair post-sort (Supplementary Figure S2a). In general, FACS selection of antigen-specific binders dramatically reduced the number of unique V-J pairs regardless of immunization method or antigen, further indicating increased oligoclonality post sort.
Figure 5. Heavy chain V and J gene usage pre-sort (left panel) and post-sort (right panel). (a) The heatmaps show the abundance of clones with specific V (y-axis) and J (x-axis) gene pairing for the scFv libraries derived from mice immunized with CTLA-4, using the four different immunization methods (shown as individual panels). The color represents clone abundance, as indicated by the legend. (b) V-J-gene usage heatmaps for libraries derived from PD-1 immunized mice. (c) Density plots showing the distribution of heavy chain V gene nucleotide percent identity to germline sequences. The blue and pink curves represent the distribution for the pre- and post-sort libraries, respectively. P-values were calculated by Wilcoxon rank sum test.
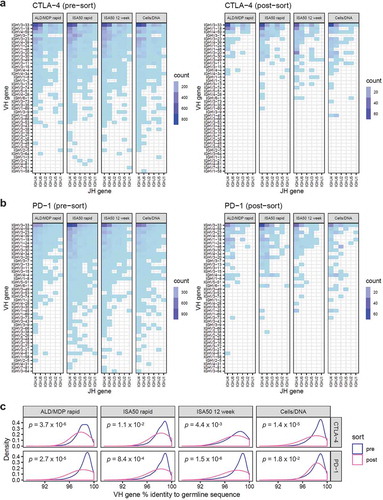
To quantitatively measure the extent of V-J-gene usage sharing, we correlated the abundance of heavy chain V-J pairs across all libraries. Despite the visual differences in the V-J usage patterns, V-J-gene abundance significantly correlated across all libraries generated using different methods, antigens, pre- and post-sort (Pearson correlation coefficients between 0.70 and 0.99, p-values <0.001). We further compared the V-J-gene usage with our previous study that used a different humanized mouse (Medarex HuMAb-Mouse) immunized with interleukin-21 receptor,Citation19 and we observed no correlation in V-J-gene usage between this current study and the previous study (Supplementary Figure S3). Together, this suggests that V-J-gene usage was minimally affected by FACS-sorting antigens or immunization methods. We postulate that V-J-gene usage is predetermined by the mouse genetic background.
Somatic hypermutation of V-genes further contributes to antibody diversity.Citation21 We measured the nucleotide percent identity of the heavy and light chain V gene to their respective germline sequences (; Supplementary Figure S2c). Pre-sort, the V-genes generally showed little divergence from germline sequences, with averages ranging from 97.7% to 98.4% for heavy chain and 97.9–98.5% for light chain. However, all post-sort libraries had heavy chain and light chain V-genes with significantly lower percent identity to germline (Wilcoxon rank sum test, p-values indicated in figures), possibly reflecting enrichment of antigen-driven affinity-matured clones.
Common and distinct scFv clones discovered across immunization methods
We next analyzed the diversity of scFv sequences that were obtained from the different immunization methods. First, we curated a list of all linked light and heavy chain CDR3 sequences (CDR3K+CDR3H) from the post-sort samples, then filtered for enriched sequences, defined as scFv that were ≥0.1% of the sequencing reads in a post-sort library and were enriched ≥1.8 fold compared to its respective pre-sort library. We tabulated the abundance (% sequencing reads) of the CDR3K+CDR3H sequences across all pre- and post-sort libraries. In general, our results suggested that different immunization methods and different tissues of origin can be used to increase the diversity of Ig candidate binders.
We compared the CDR3K+CDR3H binder sequences across the four immunization methods. We observed frequent enrichment of scFv sequences that were initially low abundance in the pre-sort libraries, for both CTLA-4 and PD-1 (). For CTLA-4, 6.3% of the 238 scFv binders were enriched in at least two methods, with one scFv shared across all four methods (). For PD-1, only 4 of 205 scFv sequences were enriched in libraries from at least two methods, none of which were seen across all methods (). Together these data reveal that, despite the similarities seen in the V-J-gene usage, each immunization method can generate a mostly distinct set of antigen-specific binders.
Figure 6. Heatmaps showing scFv clone sharing among the different libraries for CTLA-4 (a) and PD-1 (b). Each row on the heatmaps represents a unique clone defined by a unique paired light and heavy chain CDR3 (CDR3K+CDR3H). Each column represents an scFv library, annotated by the color boxes on top of the heatmap. For example, the first column represents a pre-sort library derived from the spleen of mice immunized with the ALD/MDP rapid method. The following column represents the post-sort library from the same tissue and method. Only enriched clones, defined as clones with post-sort frequency ≥0.1% and enrichment (post versus pre) ≥1.8 fold in at least one library, are shown. The color of the heatmaps represents clone abundance in percent sequencing reads, as indicated in the legend. The clones (rows) are arranged by descending abundance in the post-sort libraries, within each pre-post library pair, for the library pairs from left to right of the heatmaps. A dark blue bar across multiple columns indicates that a particular enriched clone is observed across multiple libraries. The PD-1 spleen library from the ISA50 12-week method did not enrich during FACS, and thus this particular set of libraries was not shown.
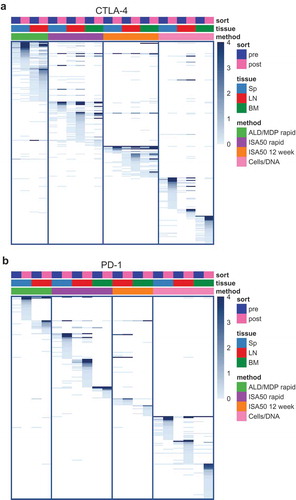
There was less sharing of common sequences across the immunization methods compared with sharing across tissues within the same method. For CTLA-4, there were both common and distinct Ig sequences among the libraries from different tissue origins, with a wide range of sequence sharing between tissues within the same immunization method (). For example, for the CTLA-4 ISA50 12-week method, 72.7% and 54.5% of the FACS-enriched sequences in the spleen library were also enriched in the lymph node and bone marrow libraries, respectively. However, for the CTLA-4 Cells/DNA method, none of the enriched scFv sequences in the bone marrow library were also enriched in the spleen or lymph node libraries. Relative to CTLA-4, the different tissues for PD-1 produced antibodies with more distinct sequences, as the amount of sequence sharing between the tissues within the same method ranged from 0% to 14.3% ().
Clonal cluster analysis of scFv clones
Clonal cluster analysisCitation18,Citation19 reveals clonal lineages of similar antibody sequences, generated by processes such as affinity maturation and selection in vivo. Though our libraries were derived from different mice, and it is therefore impossible to distinguish clonal clusters from similar clones arising in different mice, clonal cluster analysis is still useful for visualizing similar sequences across different immunization methods and tissues. To this end, we performed pairwise alignments of all cognate paired full-length IgK+IgH amino acid sequences (i.e., not just the CDR3K+CDR3H) in all libraries, clustering sequences with at most nine amino acid differences.
We observed 117 clusters for CTLA-4, including many clusters with a single sequence (). Strikingly, CTLA-4 binders displayed a major clonal cluster containing 234 related scFv sequences, comprising clones from all four immunization methods and all tissues. This suggests that the immunization with CTLA-4 generated one particularly dominant antibody (and similar variants) regardless of the immunization protocol or tissue of origin. The second largest clonal cluster of CTLA-4 binders contained 32 sequences, whereas 50 clusters contained a single sequence, indicating that a significant amount of method-specific and tissue-specific sequence diversity was still generated beyond the dominant clusters. These dominant clusters do not resemble ipilimumab (generated in Medarex HuMAb-Mouse) or tremelimumab (generated in Abgenix XenoMouse).
Figure 7. Clonal cluster analysis for the FACS-enriched scFv clones. Each node represents an scFv clone (full-length IgK+IgH). The color of the nodes indicates the immunization method from which the scFv clones were derived. The size of the nodes reflects the frequency of the scFv clones in the FACS-sorted population (small = 0.1–3%; medium = 3–12%; large = >12%). The shape of the nodes indicates the mouse tissue origin from which the clones were derived. We computed the total number of amino acid differences between each pairwise alignment of scFv sequences. Edges indicate pairwise alignments with ≤9 amino acid differences. (a) Clonal clusters for CTLA-4 binders. The scFv sequences for two mAbs against CTLA-4, ipilimumab and tremelimumab, were included for comparison. (b) Clonal clusters for PD-1. The scFv sequences for two mAbs against PD-1, pembrolizumab and nivolumab, were included for comparison. The size and shape parameters do not apply to the mAbs.
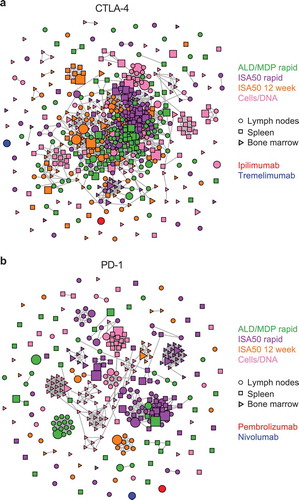
There were 101 clonal clusters for the FACS-enriched PD-1 scFv sequences. In contrast with the extensive similarity among CTLA-4 binders, PD-1 binders from different immunization methods rarely clustered together, with only two clusters containing sequences from more than one immunization method (). This included the largest cluster, which contained 48 related sequences derived from the ISA50 rapid and ALD/MLD rapid methods. Similarly, there was little clustering of sequences from different tissues, suggesting that each tissue produced a distinct set of antibodies (consistent with ). We found that neither of two commercial anti-PD-1 antibodies clustered with any of our sequences: pembrolizumab (a humanized antibody) or nivolumab (from Medarex HuMAb-Mouse) ().
Clustering as a concatenation of IgK+IgH may mask the sequence diversity contributed by the IgH versus the IgK. To identify the source of sequence diversity for enriched scFv sequences, we clustered IgK and IgH separately, using five amino acid difference as the clustering threshold. For CTLA-4 binders, this resulted in 27 and 146 clusters for IgK and IgH, respectively (Supplementary Figure S4a). The presence of fewer clusters for IgK indicates lower sequence diversity among these sequences. Similar to the concatenated IgK+IgH, there was extensive clustering of sequences derived from different immunization methods when IgK and IgH sequences were clustered separately. For IgH, 152 sequences formed a prominent major clonal cluster. The light chain sequences of ipilimumab and tremelimumab clustered with two independent clusters of the IgK sequences, while their heavy chain sequences did not cluster with any of the IgH sequences (Supplementary Figure S4a). These data suggest that despite the presence of a dominant cluster, IgH sequences are the major contributors of Ig diversity within the CTLA-4 binders.
Clustering of the IgK and IgH sequences separately for the PD-1 binders resulted in 32 and 69 clusters, respectively (Supplementary Figure S4b). Eleven clusters within the IgK sequences contained sequences derived from more than one immunization method. On the other hand, all but three clusters of the IgH sequences only contained sequences derived from a single immunization method. For example, the largest cluster within the IgH sequences contained 56 sequences, and all of them were derived from the Cells/DNA method. While both pembrolizumab heavy and light chain and nivolumab heavy chain were not similar to any sequences we discovered, nivolumab light chain clustered with a light chain cluster that originated from two different immunization methods and multiple tissues (Supplementary Figure S4b). Together, these data indicate that each of the immunization methods resulted in diverse sequence patterns for CTLA-4 and PD-1 binders, generating a large group of similar antibodies for the former, but a more diverse, distinct set of antibodies for the latter.
Discussion
A diverse antibody repertoire ensures protective immunity against a wide range of antigens and antigen epitopes. In mice, antibody repertoire plasticity can be exploited for the discovery of therapeutic mAbs. In this study, we showed that different mouse immunization methods can generate many similar Ig sequences, though the extent of overlap was dependent on the target. However, each immunization method mostly generated unique antigen-specific Ig sequences. It remains unknown whether such diversity is truly imparted by the immunization methods or merely reflects stochastic variation or biases in the sorting method.
Notably, V-J-gene usage was highly similar across the antibody libraries derived from different immunization methods, consistent with previous reports that V-gene usage is strongly genetically predetermined.Citation22,Citation23 Comparison of the humanized mice from this study and from our previous work revealed that mice with different genetic backgrounds had distinct V-J-gene usage, thus immunizing different mouse strains should lead to antibodies with more diverse V- and J-gene usage. Interestingly, immunizations of mice with CTLA-4 led to a large cluster of similar Ig variants, regardless of immunization method. This suggests that the binding sites of antibodies targeting CTLA-4 may be limited to certain epitopes, although epitope mapping experiments would be necessary to test this hypothesis. On the other hand, immunizations with PD-1 led to more distinct population of Ig sequences among the different libraries. Even within a single immunization method, different tissues produced anti-PD-1 scFv with distinct CDR3s (). The similarity in V-J-gene usage but dissimilarity in clonal composition between CTLA-4 and PD-1 binders indicates that the antibody repertoire is shaped by both genetics (e.g., mouse strain) and antigen exposure.
Of the immunization methods we tested, the Cells/DNA method was unique in that it did not use soluble antigens to immunize mice, and instead uses the natively expressed forms of the membrane proteins. The Cells/DNA method is attractive in its simplicity, as it obviates the need for the production and purification of soluble proteins as antigens. Thus, this method may be especially useful for antigens that are membrane-associated proteins, such as multi-pass transmembrane proteins, which are difficult targets for antibody generation.Citation24 Future work should test if mice immunized with the Cells/DNA method generated more physiologically relevant antibodies against membrane-associated antigens than mice immunized with soluble versions of the same antigens. In fact, anti-PD-1 antibodies produced by the Cells/DNA method formed distinct clusters separate from antibodies produced by the other methods (), which may indicate that they bind different epitopes. Previous studies suggested that DNA priming immunization induces higher levels of antigen-specific B-cell responses.Citation25,Citation26 Consistently, the Cells/DNA method resulted in the highest number of antigen-specific scFv clones in this study (), although functional experiments will be necessary to determine if these scFv clones translate to better mAbs.
When generating mAbs, the ability to capture high-affinity antibodies from the natural repertoire is highly desirable, eliminating the need to perform affinity maturation in vitro. In our study, FACS selection of antigen-specific antibodies enriched for antibodies more divergent from their germline sequences (; Supplementary Figure S2c), suggesting that these antigen-specific antibodies had undergone affinity maturation in vivo. Functional validation of individual full-length mAbs from each method would be necessary to confirm whether a particular immunization method is superior in generating higher affinity antibodies. Because each immunization method resulted in vast and distinct antibody repertoires, this indicates that the use of multiple immunization protocols in parallel may be beneficial in generating a highly diverse pool of candidate antibodies, thus increasing the chances of finding the best candidates for clinical development.
The goal of this study was to perform a broad repertoire analysis based on high-throughput target-specific binding and sequencing. Preliminary functional analysis of select antibodies from different representative clusters has shown a wide range of activities, including non-blockers/weak blockers/strong blockers, strong affinities/weak affinities, and some epitope diversity (data not shown). In the future, a more comprehensive analysis of individually expressed antibodies will be critical to determine if specific immunization methods produced more superior antibodies, such as those with increased affinity, ability to bind unique epitopes, or having enhanced functional activity. Alternative display methods could also be explored, such as antigen-binding fragment (Fab) display, which may more accurately reflect the function of the full-length mAbs. It is clear that our methods will be useful to quickly and comprehensively analyze the antigen-specific repertoires of additional immunization methods or alternative mouse or humanized mouse strains. Thus, a variety of methods can be tested in parallel for new targets of interest to drug discovery groups, significantly improving timelines and generating a deeper portfolio of candidates.
Materials and methods
Mouse immunization and sample preparation
All mouse work was performed at Antibody Solutions (Sunnyvale, CA) and was overseen by a licensed veterinarian. Mouse immunizations were performed with four different protocols with C57BL/6 transgenic humanized mice from Trianni (San Francisco, CA). His-tagged PD-1 extracellular domain (R&D systems 8986-PD) and His-tagged CTLA-4 extracellular domain (Acro Biosystems CT4-H5229) were used for all immunizations except for Cells/DNA. The human PD-1 extracellular domain used is 17 kDa, with a theoretical pI of 8.6, and is 62.5% homologous with mouse PD-1. The human CTLA-4 extracellular domain used is 15.4 kDa, with a theoretical pI of 4.3, and is 68.5% homologous with mouse CTLA-4. We note that it is possible that the immunizations could be biased towards specific epitopes that are not shared between the human and mouse proteins.
The ALD/MDP rapid method used 10 µg of soluble antigen with ALD/MDP (alhydrogel/muramyl dipeptide) adjuvant injected into the footpad twice per week for four weeks, followed by two final boosts without adjuvant prior to tissue harvest. The ISA50 rapid method followed the same rapid dosing schedule, with Seppic Montanide ISA50 as the adjuvant. The ISA50 12-week method used an intraperitoneal injection of 10 µg protein with Seppic Montanide ISA50 as adjuvant once every four weeks for 12 weeks, with tissue harvest approximately one week after the last injection. The Cells/DNA method used two different immunogens: (1) Mitomycin C-treated mouse 3T3 cells stably expressing un-tagged full-length protein on the cell surface, 1–2 million cells per injection per mouse (surface expression of PD-1 and CTLA-4 was verified by FACS); and (2) DNA plasmid encoding un-tagged full-length protein, 20 µg per injection per mouse. A footpad injection was performed on day 0 with cells, then day 3, 7, and 10 with DNA, then day 14 with cells, day 17 and 21 with DNA, and final boosts on day 24 and 27 with cells prior to tissue harvest. Three mice were used for all methods and both targets, except for ALD/MDP rapid with CTLA-4, which used five mice.
Titer of each mouse was assessed by ELISA on a 1:3 dilution series of antigen, starting at 1000 ng/mL, using a horseradish peroxidase-goat anti-mouse IgG detection antibody (Jackson ImmunoResearch 115-035-071). ELISA was performed prior to the final boosts for ALD/MDP, ISA50 rapid, and Cells/DNA, and prior to injections 2, 3 and 4 for ISA50 12 week.
Mice were euthanized and prepared for aseptic tissue harvest. Inguinal and popliteal lymph nodes, spleen, and sometimes bone marrow were harvested from each mouse, washed with basal medium, and then teased as needed to dissociate cells. The cells were strained through a 70 µm mesh filter with basal medium. Cells from individual mice were pooled by organ type, and spleen and lymph node B cells were selected with a mouse Pan-B negative selection kit (Stemcell Technologies), and CD138+ plasma B cells were isolated from bone marrow with a mouse CD138+ positive selection kit (Miltenyi Biotec). Cells were resuspended to 6,000 cells/uL in phosphate-buffered saline with 12% OptiPrep Density Gradient Medium (Sigma) for microfluidic encapsulation.
Generating paired heavy and light chain libraries
Paired heavy and light chain libraries were generated as previously reported.Citation12,Citation18 During the development of this method, several spike-in experiments with known antibody sequences were performed that indicated proper antibody pairing was maintained; however, there is always the possibility that a minority of sequences could still have improper pairing. Briefly, we encapsulated approximately 1.1–2.3 million spleen or lymph node B cells or 35,000–220,000 bone marrow plasma B cells (Supplementary Table S1) into fluorocarbon oil (Dolomite) emulsion microdroplets with lysis buffer and oligo-dT beads (New England Biolabs) using a co-flow emulsion droplet microfluidic chip. The beads were extracted from droplets using Pico-Break (Dolomite). Multiplex overlap extension reverse transcriptase polymerase chain reaction was performed in emulsions using purified RNA bound to beads as template. Emulsions were generated in mineral oil using glass Telos microfluidic chips (Dolomite). Linked light-heavy chain scFv DNA libraries were purified and nested PCR was performed using NEBNext High-Fidelity amplification mix (New England BioLabs) with Illumina adapter-containing primers for deep sequencing or with primers for cloning into the yeast expression vector. Only kappa light chain sequences were captured, while lambda light chain sequences were not included in this study.
Yeast library screening
The same PD-1 and CTLA-4 proteins used for immunization were biotinylated as previously described.Citation12,Citation18 Yeast scFv display libraries were generated using the amplified DNA libraries from above and a custom-built yeast surface display vector, propagated, and induced as previously described.Citation12,Citation18 In-frame scFv sequences have a C-terminal c-Myc tag; to identify scFv-expressing yeast cells, after scFv expression induction, yeast cells were expanded and stained with anti-c-Myc (Thermo Fisher Scientific A21281) and AF488-conjugated secondary antibody (Thermo Fisher Scientific A11039). Biotinylated antigen was added at a final concentration of 50 nM for PD-1 or 70 nM CTLA-4 then stained with APC-streptavidin (Thermo Fisher Scientific) to select antigen-binding cells. The yeast cells were flow sorted on a BD Influx (Stanford Shared FACS Facility) or a BD FACSMelody for double-positive cells (AF488+/APC+), and recovered yeast cells were plated for expansion on SD-CAA plates with kanamycin, streptomycin, and penicillin (Teknova). The expansion, induction, staining, and recovery were performed two additional times with the same antigen and concentration. After the final sort, the enriched plasmid libraries were isolated with Zymoprep Yeast Plasmid Miniprep kit (Zymo Research).
Antibody repertoire sequencing
Antibody repertoire sequencing was performed in two separate sequencing runs as previously described.Citation12,Citation18 For the first run, the entire scFv regions were amplified to add Illumina adapters to both the pre-sort and post-sort libraries to sequence the linked IgK-IgH CDR3 regions. For the second run, the heavy chain and light chain V(D)J-gene regions were amplified separately to sequence the entire V-gene regions. Post-sort libraries were sequenced with MiSeq Reagent Kit v2 (500-cycle), and pre-sort libraries were sequenced with MiSeq Reagent Kit v3 (600-cycle), according to the manufacturer’s instructions (Illumina). The number of reads obtained for each sample is provided in Supplementary Table S1.
Sequence analysis
Processing of the sequencing data was performed as previously described.Citation12,Citation18 Briefly, to estimate the diversity of the libraries, we defined “clones” conservatively. First, we concatenated the CDR3K and CDR3H amino acid sequences from each scFv sequence into a single contiguous amino acid sequence. Next, we used UBLASTCitation27 to compute the total number of amino acid difference in all pairwise alignments between each concatenated sequence in each data set. Groups of sequences with ≤2 amino acid differences in the concatenated CDR3s were counted as a single clone. We then further filtered the list to only consider clones with ≥2 sequencing reads. We note that our objective was not to exhaustively capture the long tail of low abundance clones, but to obtain higher confidence clones with reduced sequencing error. Further, we did not barcodeCitation4 our DNA libraries as a way to monitor oligoclonality since it is difficult to find a way to incorporate unique sequences that do not change the protein coding sequence of our expression libraries, and because the linkage PCR is three separate PCRs in the same droplet (two half reactions and a linkage reaction), which would make the barcodes complicated to interpret.
ScFv clone sharing heatmap
We curated a list of all linked light and heavy chain CDR3K+CDR3H sequences across all libraries and filtered for enriched sequences, defined as sequences that occupied ≥0.1% of the sequencing reads in a post-sort library, and were enriched ≥1.8 fold when comparing post- versus pre-sort frequencies in the same library. We then tabulated the abundance (in % sequencing reads) of the CDR3K+CDR3H sequences across all pre- and post-sort libraries. The heatmap was generated using the pheatmap package (version 1.0.10) in R (version 3.4.2).
Clonal cluster analysis and visualization
We used USEARCHCitation27 to compute the total amino acid differences between each pairwise alignment of FACS-sorted scFv or single chain sequences. We then used the R package igraph (version 1.2.2)Citation28 to generate clustering plots for the pairwise alignments. The sequences were represented as “nodes”, colored based on the immunization method from which the scFv clones were derived. The size of the nodes reflects the frequency of the scFv clones in the FACS-sorted population (small = 0.1–3%; medium = 3–12%; large = >12%). The shape of the nodes indicates the mouse tissue origin from which the clones were derived. We define “edges” as the links between nodes. Edges indicate pairwise alignments with ≤9 amino acid differences for scFv or ≤5 amino acid differences for single chain sequences. The layout_with_graphopt (charge = 0.03) option was used to format the output. Ipilimumab, tremelimumab, pembrolizumab, and nivolumab sequences were obtained from the KEGG DRUG database.
Abbreviations
| alhydrogel/muramyl dipeptide | = | (ALD/MDP) |
| antigen-binding fragment | = | (Fab) |
| bone marrow | = | (BM) |
| complementarity-determining region 3 | = | (CDR3) |
| cytotoxic T-lymphocyte associated protein 4 | = | (CTLA-4) |
| enzyme-linked immunosorbent assay | = | (ELISA) |
| fluorescence-activated cell sorting | = | (FACS) |
| immunoglobulin | = | (Ig) |
| joining | = | (J) |
| lymph nodes | = | (LN) |
| monoclonal antibody | = | (mAb) |
| programmed cell death 1 | = | (PD-1) |
| single-chain variable fragment | = | (scFv) |
| spleen | = | (Sp) |
| variable | = | (V) |
Disclosure of Potential Conflicts of Interest
MAA, YWL, NW, KS, RCE, JL, RL, RAM, MSA, JFS, MJS, DSJ, and ASA are employees of GigaGen Inc. and receive both equity shares and salary for their work.
Supplemental Material
Download Zip (1.3 MB)Acknowledgments
David Meininger provided valuable discussions regarding immunizations with the Trianni MouseTM. Antibody Solutions (Sunnyvale, CA) was a valuable resource for mouse immunization methods.
Supplemental material
Supplemental data for this article can be accessed on the publisher’s website.
Additional information
Funding
Related Research Data
References
- Nelson AL, Dhimolea E, Reichert JM. Development trends for human monoclonal antibody therapeutics. Nat Rev Drug Discov. 2010;9:767–74. doi:10.1038/nrd3229.
- McNeal MM, Rae MN, Ward RL. Effects of different adjuvants on rotavirus antibody responses and protection in mice following intramuscular immunization with inactivated rotavirus. Vaccine. 1999;17:1573–80. doi:10.1016/S0264-410X(98)00359-4.
- Khurana S, Verma N, Yewdell JW, Hilbert AK, Castellino F, Lattanzi M, Del Giudice G, Rappuoli R, Golding H. MF59 Adjuvant enhances diversity and affinity of antibody-mediated immune response to pandemic influenza vaccines. Sci Transl Med. 2011;3:85ra48–8.
- Georgiou G, Ippolito GC, Beausang J, Busse CE, Wardemann H, Quake SR. The promise and challenge of high-throughput sequencing of the antibody repertoire. Nat Biotechnol. 2014;32:158–68. doi:10.1038/nbt.2782.
- Lu J, Panavas T, Thys K, Aerssens J, Naso M, Fisher J, Rycyzyn M, Sweet RW. IgG variable region and VH CDR3 diversity in unimmunized mice analyzed by massively parallel sequencing. Mol Immunol. 2014;57:274–83. doi:10.1016/j.molimm.2013.09.008.
- Reddy ST, Ge X, Miklos AE, Hughes RA, Kang SH, Hoi KH, Chrysostomou C, Hunicke-Smith SP, Iverson BL, Tucker PW, et al. Monoclonal antibodies isolated without screening by analyzing the variable-gene repertoire of plasma cells. Nat Biotechnol. 2010;28:965–69. doi:10.1038/nbt.1665.
- Köhler G, Milstein C. Continuous cultures of fused cells secreting antibody of predefined specificity. Nature. 1975;256:495–97. doi:10.1038/256495a0.
- Brüggemann M, Caskey HM, Teale C, Waldmann H, Williams GT, Surani MA, Neuberger MS. A repertoire of monoclonal antibodies with human heavy chains from transgenic mice. Proc Natl Acad Sci USA. 1989;86:6709–13. doi:10.1073/pnas.86.17.6709.
- Dura B, Liu Y, Voldman J. Deformability-based microfluidic cell pairing and fusion. Lab Chip. 2014;14:2783–89. doi:10.1039/c4lc00303a.
- Weinstein JA, Zeng X, Chien Y-H, Quake SR. Correlation of gene expression and genome mutation in single B-cells. PLoS One. 2013;8:e67624–5. doi:10.1371/journal.pone.0067624.
- Wang B, Lee C-H, Johnson EL, Kluwe CA, Cunningham JC, Tanno H, Crooks RM, Georgiou G, Ellington AD. Discovery of high affinity anti-ricin antibodies by B cell receptor sequencing and by yeast display of combinatorial VH:VL libraries from immunized animals. mAbs. 2016;8:1035–44. doi:10.1080/19420862.2016.1196521.
- Adler AS, Mizrahi RA, Spindler MJ, Adams MS, Asensio MA, Edgar RC, Leong J, Leong R, Johnson DS. Rare, high-affinity mouse anti-PD-1 antibodies that function in checkpoint blockade, discovered using microfluidics and molecular genomics. mAbs. 2017;9:1270–81. doi:10.1080/19420862.2017.1371386.
- Wang B, DeKosky BJ, Timm MR, Lee J, Normandin E, Misasi J, Kong R, McDaniel JR, Delidakis G, Leigh KE, et al. Functional interrogation and mining of natively paired human VH:VL antibody repertoires. Nature Publishing Group. 2018;36:152–55.
- Pardoll DM. The blockade of immune checkpoints in cancer immunotherapy. Nat Rev Cancer. 2012;12:252–64. doi:10.1038/nrc3239.
- Ribas A, Wolchok JD. Cancer immunotherapy using checkpoint blockade. Science. 2018;359:1350–55. doi:10.1126/science.aar4060.
- Hodi FS, O’Day SJ, McDermott DF, Weber RW, Sosman JA, Haanen JB, Gonzalez R, Robert C, Schadendorf D, Hassel JC, et al. Improved survival with ipilimumab in patients with metastatic melanoma. N Engl J Med. 2010;363:711–23. doi:10.1056/NEJMoa1011205.
- Garon EB, Rizvi NA, Hui R, Leighl N, Balmanoukian AS, Eder JP, Patnaik A, Aggarwal C, Gubens M, Horn L, et al. Pembrolizumab for the treatment of non–small-cell lung cancer. N Engl J Med. 2015;372:2018–28. doi:10.1056/NEJMoa1501824.
- Adler AS, Mizrahi RA, Spindler MJ, Adams MS, Asensio MA, Edgar RC, Leong J, Leong R, Roalfe L, White R, et al. Rare, high-affinity anti-pathogen antibodies from human repertoires, discovered using microfluidics and molecular genomics. mAbs. 2017;9:1282–96. doi:10.1080/19420862.2017.1371383.
- Adler AS, Bedinger D, Adams MS, Asensio MA, Edgar RC, Leong R, Leong J, Mizrahi RA, Spindler MJ, Bandi SR, et al. A natively paired antibody library yields drug leads with higher sensitivity and specificity than a randomly paired antibody library. mAbs. 2018;10:431–43. doi:10.1080/19420862.2018.1426422.
- Alt FW, Yancopoulos GD, Blackwell TK, Wood C, Thomas E, Boss M, Coffman R, Rosenberg N, Tonegawa S, Baltimore D. Ordered rearrangement of immunoglobulin heavy chain variable region segments. Embo J. 1984;3:1209–19. doi:10.1002/j.1460-2075.1984.tb01955.x.
- Tonegawa S. Somatic generation of antibody diversity. Nature. 1983;302:575–81. doi:10.1038/302575a0.
- Greiff V, Menzel U, Miho E, Weber C, Riedel R, Cook S, Valai A, Lopes T, Radbruch A, Winkler TH, et al. Systems analysis reveals high genetic and antigen-driven predetermination of antibody repertoires throughout B cell development. CellReports. 2017;19:1467–78.
- Glanville J, Kuo TC, von H-C B, Guey L, Berka J, Sundar PD, Huerta G, Mehta GR, Oksenberg JR, Hauser SL, et al. Naive antibody gene-segment frequencies are heritable and unaltered by chronic lymphocyte ablation. Proc Natl Acad Sci USA. 2011;108:20066–71. doi:10.1073/pnas.1107498108.
- Hazen M, Bhakta S, Vij R, Randle S, Kallop D, Chiang V, Hötzel I, Jaiswal BS, Ervin KE, Li B, et al. An improved and robust DNA immunization method to develop antibodies against extra-cellular loops of multi-transmembrane proteins. mAbs. 2014;6:95–107. doi:10.4161/mabs.26761.
- Li W, Wang S, Pilot LS. Study on the use of DNA priming immunization to enhance Y. Vaccines. 2014;2:36–48.
- Liu S, Wang S, Lu S. DNA immunization as a technology platform for monoclonal antibody induction. Emerg Microbes Infect. 2016;5:e33–3. doi:10.1038/emi.2016.119.
- Edgar RC. Search and clustering orders of magnitude faster than BLAST. Bioinformatics. 2010;26:2460–61. doi:10.1093/bioinformatics/btq461.
- Csardi G, Nepusz T The igraph software package for complex network research. InterJournal [Internet] 2006; Complex Systems:1695. http://igraph.org