
ABSTRACT
Traditional hybridoma and B cell cloning antibody discovery platforms have inherent limits in immune repertoire sampling depth. One consequence is that monoclonal antibody (mAb) leads often lack the necessary affinity for therapeutic applications, thus requiring labor-intensive and time-consuming affinity in vitro engineering optimization steps. Here, we show that high-affinity variants of mouse-derived mAbs can be rapidly obtained by testing of somatic sequence variants obtained by deep sequencing of antibody variable regions in immune repertories from immunized mice, even with a relatively sparse sampling of sequence variants from large sequence datasets. Affinity improvements can be achieved for mAbs with a wide range of affinities. The optimized antibody variants derived from immune repertoire mining have no detectable in vitro off-target binding and have in vivo clearance comparable to the parental mAbs, essential properties in therapeutic antibody leads. As generation of antibody variants in vitro is replaced by mining of variants generated in vivo, the procedure can be applied to rapidly identify affinity-optimized mAb variants.
Introduction
Immunized mice are a major source of antibodies for diagnostic, reagent and therapeutic applications. The main technologies to isolate monoclonal antibodies (mAbs) from immunized mice are hybridoma and B cell cloning.Citation1,Citation2 Both technologies have been vastly improved over the years and frequently yield antibodies with the desired properties. The simplicity, robustness, low cost and ability of traditional antibody discovery platforms to rapidly produce antibodies for a wide range of screening assays means that these technologies will remain one of the workhorses of antibody discovery in the foreseeable future. However, a shortcoming of these technologies is the relatively limited immune repertoire sampling depth that can be achieved compared to the potential size of the immune repertoire of immunized animals. These limits are imposed by relatively low myeloma cell fusion efficiencies and by throughput capacity for single B cell capture and processing.Citation3 A consequence of this limitation in mining depth is that the affinity of mAbs discovered by these methods, which is a function of several factors including the size of antibody panels, may not necessarily be the highest that a given immune repertoire may have to offer. Therefore, in vitro engineering of affinity by rational or directed evolution methods may be required to obtain mAbs with the high affinities needed for reagent or therapeutic applications.Citation4 However, these methods, while effective, can be time-consuming and labor-intensive, especially when applied to a set of different antibody leads. The development of robust methods that bypass these engineering steps would therefore allow rapid affinity optimization of a larger number of mAb leads simultaneously.
Comprehensive mining of immune repertoires can be achieved by deep sequencing technologies, also known as Next-Gen sequencing (NGS).Citation5 However, sequence data provide limited information for identification of antigen-specific clones with the desired epitope and activity. This is compounded by the loss of heavy and light chain pairing information that occurs in most commonly used NGS methods, which precludes straightforward reconstitution of functional antibodies. An alternative approach to bypass this limitation would be the application of NGS for deep mining of immune repertoires guided by information from mAbs obtained by traditional methods. In essence, NGS could be used to mine for heavy and light chain variants within B cell lineages that are generated by the natural process of somatic mutation and clonal expansion, followed by testing of variants for improved functional properties. Using this approach, somatic variants of mAbs derived by B cell cloning with improved human immunodeficiency type 1 virus (HIV-1) neutralization properties have been identified in blood samples from infected human donors.Citation6–Citation8 Although successfully applied, questions remain for the routine application of this technology to antibody discovery.
In the context of HIV-1 immune responses, the B cell lineages interrogated are derived from mAbs that usually have long heavy chain third complementarity-determining region (CDR) sequences and high loads of somatic mutations, typical of human-derived broadly neutralizing antibodies to HIV-1.Citation9–Citation11 These two properties result in antibodies with sufficient sequence information for unambiguous identification of variants belonging to specific B cell lineages in NGS datasets. In contrast, natural mouse antibodies have, on average, shorter heavy chain CDR3 (CDR H3) sequences and lower mutational load, limiting the amount of information available to unambiguously identify B cell lineages in NGS datasets.Citation12 In addition, a tendency of anti-HIV-1 antibody variants with non-native chain pairings to bind non-specifically was noted in these previous reports.Citation6 Finally, data beyond virus strain binding spectrum and neutralizing activity is not described in these reports. Therefore, the value and robustness of NGS immune repertoire mining methods for optimization of monoclonal antibodies from mouse origin, a major source of antibodies in the pharmaceutical industry, remains unclear. Here, we show that mouse mAbs can be rapidly optimized for binding affinity using NGS-based immune repertoire mining and chain shuffling while retaining off-target and pharmacokinetic properties compatible with therapeutic applications.
Results
Establishing a workflow to enable deep mining for affinity maturation of hybridoma antibodies
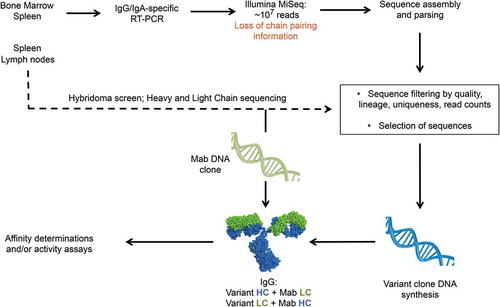
The procedure described here mines the variable region diversity generated in antibody repertoires during in vivo affinity maturation for in vitro optimization of antibodies derived from the same immune repertoires obtained by standard hybridoma. Briefly, antibody variable region sequences clonally related to mAbs of interest are identified in NGS-generated immune mouse repertoire datasets and used to generate antibody variants that are screened for affinity (). The traditional antibody discovery workflow and the initial repertoire sequencing and sequence parsing are performed in parallel to expedite the search of variants. In the work we describe here, lymph nodes and a fraction of the spleens of immunized mice were used in the traditional hybridoma workflow. The rest of the spleen tissue and bone marrow was used to extract RNA and amplify the heavy and light chain variable regions of the entire repertoire. Amplicons are then subjected to Illumina MiSeq paired-end sequencing to obtain the sequence of the entire variable regions, which are parsed for V and J germline use. Once mAb leads are screened and their variable regions sequenced, the data is immediately available for mining of sequence variants. Of note, the NGS method used here does not yield chain pairing information because heavy and light chain datasets are analyzed independently. NGS-derived variant chains are initially paired with either the heavy or light chain of the reference mAb, and NGS-derived chain variants in antibodies with improved affinity are subsequently combined to test for higher binding affinity antibodies ().
Figure 1. Overall workflow of immune repertoire mining for affinity engineering. Repertoire sequencing is performed in parallel and from tissues from the same mice used for hybridoma development. Immune repertoire is performed immediately after mAb characterization and sequencing. Initial affinity screening is done with hybrid IgG composed of a mAb and a variant chain. Combination of variant chains after initial affinity screening is not shown for simplicity.
Selection of sequence variants
The main principles for mining of antibody sequences from immune repertoires are based on the biological mechanisms of primary naïve and secondary antigen-experienced immune repertoire diversification which, in mice, is produced solely by recombination of V, D and J germline segments into full-length antibody variable regions and somatic mutation.Citation13 Upon antigen binding, somatic mutation and clonal expansion lead to lineages of clonally related but distinct B cells expressing antibodies that bind antigen with affinities that may differ among clones. We used a working definition of sequence lineage based on these principles, which are generally accepted in the field,Citation3 but with some modifications. Sequences in the same lineage as the reference mAb are defined as those that have the same V and J germlines and CDR3 length as the sequences of the reference antibody (, Suppl. Fig. 1). The D segment of the heavy chain is ignored due to the impracticality of consistently assigning D germline use with high confidence. To account for somatic mutation in CDR3 in both chains, mismatches are allowed in these regions within lineages. The CDR H3 amino acid identity threshold for a sequence variant to be included in the lineage was set at a permissive 60% from residues 93 to 102 (Kabat system used throughout). No limit in the number of somatic mutations was set for the light chain CDR3. As many different lineages may have identical VL and JL germline segments and CDR3 length, additional light chain residues were considered to increase the probability of selecting variants within the lineage. These “markers” are the residues in positions 95 or 96, which are often defined by VJ recombination, and somatic mutations present in any position in the reference antibody. These somatic mutations were chosen on an ad-hoc basis, selecting the markers that result in a sub-sample of sequences that can be practically mined.
Table 1. Germline composition and CDR H3 sequence of reference mAbs.a
Due to the large number of unique sequences in most datasets, additional filters were applied to reduce the number of candidates. These filters were, sequentially, minimum number of read counts required for each unique sequence, which varied according to total unique sequence counts, and unique combination of residues in CDR and selected framework positions. Here we used an expansive definition of CDR, which combines the Kabat and the international ImMunoGeneTics information system® (IMGT®; http://www.imgt.org) definitions.Citation14,Citation15 The framework residues considered for clone selection are located in the VH/VL interface and in positions that affect CDR conformation.Citation16–Citation20 Combined, these comprised 35 to 52 residues per variable region for different mAbs and chains (Suppl. Fig. 2). Thus, framework positions less likely to affect affinity were ignored for variant selection. We refer to these as “irrelevant framework positions”. Variants were chosen to include a wide range of the most prevalent somatic mutations in the selected positions in each dataset, confirmed by inspection of phylogenetic trees with the final filtered sequence variants.
Selection and affinity optimization of anti-αSynuclein mAbs
We initially tested the workflow described above in an αSynuclein (αSyn) antibody discovery campaign. Human αSyn is a potential target for the treatment of Parkinson’s disease.Citation21 Mice immunized with human αSyn were used to generate mAbs and immune repertoire sequence datasets by NGS. Two antibodies were selected for further optimization, S1 and S2, which bound different linear αSyn epitopes (residues 111-130 and 91-110, respectively) (Suppl. Fig. 3). Germline use was assigned unambiguously for both antibodies (, Suppl. Fig. 1A).
From the NGS dataset, a total of 374 unique VH sequences grouped with the S1 mAb lineage, of which 30 had unique combinations of residues in CDR and selected framework positions and count numbers greater than 1 (). A set of 12 heavy chain variants (S-H1 to S-H12) that covered the most prevalent somatic mutations in CDR and selected framework positions were selected (, and Suppl. Fig. 2A). For the light chain, only 57 unique sequences were identified in the dataset that included the Q27R and T53S somatic mutations, CDR L3 length 8 and the germline Trp residue at position 96, used to define the mAb S1 light chain lineage. A total of 28 unique light chain sequences passed subsequent filters, of which five variants with limited redundancy in somatic mutations (S-L1 to S-L5) were selected for testing (, and Suppl. Fig. 2B). Antibodies were expressed by pairing each variant with the corresponding chain from mAb S1. All variants expressed and bound antigen in surface plasmon resonance (SPR) assays (, Suppl. Fig. 4). The antibodies with variant light chains bound to antigen with affinities slightly lower than mAb S1. In contrast, three variants with NGS-derived heavy chains had affinities significantly improved relative to S1 mAb. Of these, heavy chain S-H6 paired to the reference S1 light chain (mAb variant S1-H6) had the best affinity, with a sixfold improvement relative to the reference S1 mAb (, , Suppl. Fig. 5).
Table 2. Heavy chain variable region sequence variant filtering and counts.
Table 3. Light chain variable region sequence variant filtering and counts.
Table 4. Binding kinetics and off-target binding of mAbs and best affinity variants.
Figure 2. Anti-αSyn mAb and variant chain dendrograms. Variant light and heavy chains for mAb S1 are shown in A and B. Variant chains light and heavy chains for mAb S2 in C and D. Only sequences with unique CDR and selected framework positions and passing the read counts filter in and are included. Mutations in irrelevant framework positions were ignored for tree construction. NGS-derived variants are shown as in blue and orange symbols. Chains in variant mAbs with affinity at least 1.6-fold better than reference mAbs are shown in magenta, with the best variants marked with an asterisk. For mAb S2 light chain variants only the three best variants are marked in magenta. Labels of variants not selected for testing are omitted for clarity. Black diamonds show the germline sequences at the root of the trees. Labels in the same line indicate variants in a top to bottom order for that region of the tree. Scale bars show residue substitution distance.
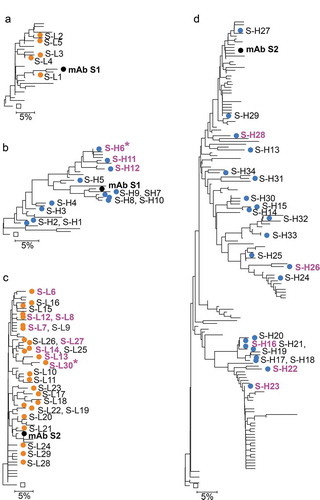
Antibody S2 has a relatively short CDR H3 of length 7, providing less information for reliable identification of clones within the lineage. Upon analysis of sequences in the dataset with the same germline use and CDR H3 length as mAb S2, a group of sequences was identified that varied mostly by the conservative substitutions Val/Leu and Arg/Lys in positions 93 and 94. A subset of 22 diverse heavy chain variants covering most of the major somatic mutations for that group was selected after application of filters (, , Suppl. Fig. 2A). The light chain lineage was defined as including both the K30E somatic mutation and a Gln residue at position 96 in the VJ junction as for mAb S2. A total of 25 diverse light chain clones passing other filters were selected (, , Suppl. Fig. 2B). Pairing of NGS-derived variants with the corresponding mAb S2 chains resulted in antibody variants with increased affinity relative to mAb S2, including both heavy and light chains (, Suppl. Fig. 4 and 5). The best variant had the S-L30 light chain paired to the reference mAb S2 heavy chain (mAb variant S2-L30) (, , Suppl. Fig. 5).
Selection and affinity optimization of convergent anti-FcRH5 mAbs
The deep mining workflow was tested in a second antibody campaign seeking antibodies that bind human Fc-receptor homolog 5 (FcRH5), an immunoglobulin domain cell surface receptor.Citation22 Three unique mAbs, F1, F2 and F3, were obtained from a pool of five mice with monovalent affinities ranging from 0.4 to 67 nM. The three antibodies had different combinations of IGHV1 heavy and IGKV4 light chains with CDR H3 length 11 of similar sequences (, Suppl. Fig. 1B). In particular, mAb F2 shares similar heavy and light chain sequences with mAbs F3 and F1, respectively. In fact, mAbs F2 and F3 have heavy chains that meet the criteria used here to group heavy chains in the same lineage, with the same VH and JH germline use and CDR H3 length and 82% CDR H3 amino acid identity (2 mismatches in 11 residues), although light chain germline use and heavy chain junctional DNA sequence analysis indicates that these mAbs are clonally independent (Suppl. Fig. 1B). The light chains of mAbs F2 and F1 differ by only five somatic mutations and by Jκ germline use, the latter being apparent only by detailed DNA sequence analysis (, Suppl. Fig. 1B). Consistent with their shared sequence features, the F1, F2, and F3 mAbs cross-competed for binding to antigen in an SPR-based assay (data not shown), indicating these are functionally and structurally similar but clonally independent, thus forming a group of convergent lineages. Of note, these three mAbs are not the product of artifactually mispaired chains, as all heavy and light chains clearly have different V(D)J junctions (Suppl. Fig. 1B). Therefore, this panel provides an opportunity to elucidate the potentially confounding effects lineage convergence on the identification of suitable sequence variants for affinity optimization. In addition, the 100-fold range in affinities in this panel also allows determination of affinity improvements that can be achieved with similar mAbs of significantly different affinities.
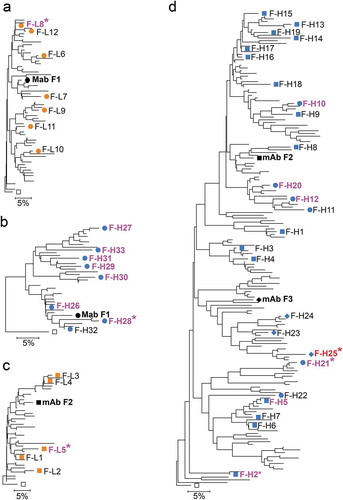
Identification of sequence variants was performed by applying filters as above, increasing the read count filters to at least 10 or 30 counts due to the large number of unique sequences identified for the sequence lineages ( and ). For mAbs F2 and F3, 25 diverse IGHV1-14/IGHJ2 heavy chain variants with CDR H3 length 11 were selected (, Suppl. Fig. 2A). All but four of these variants could be classified as belonging to either the F2 or F3 lineages using the criteria used here for lineage definition; variants F-H2, F-H8 and F-H21 grouped only with mAb F2 heavy chain lineage, whereas variant F-H24 grouped only with the mAb F3 heavy chain lineage. Closer inspection of the nucleotide sequence of selected variants showed that variants F-H23, F-H24 and F-H25 had F3-like VDJ junction whereas the others had F2-like or non-F2/F3 junctions, indicating that the selected set had heavy chain variants from two or more different lineages (Suppl. Fig. 6). These junctional analyses were mostly congruent with sequence clustering in the dendrogram, especially the clustering of the F3-like clones (). Combined, the data indicates that the sampled F2/F3 heavy chain sequences comprise sequences of several convergent lineages. Given the sequence similarity of the F2 and F3 lineages, the 25 selected heavy chain variants were combined with both F2 and F3 light chains.
Figure 3. Anti-FcRH5 mAb and variant chain dendrograms. Variant light and heavy chains for mAb F1 are shown in (A) and (B). Variant light chains for mAb S2 are shown in (C). Variants heavy chains for mAbs F2 and F3 are shown in (D). Only sequences with unique CDR and selected framework positions and passing the read counts filter as shown in and are included. Mutations in irrelevant framework positions were ignored for tree construction. NGS-derived variants are shown as blue and orange symbols. Chains in variant mAbs with affinity at least 1.6-fold better than reference mAbs are shown in magenta or red for the F3 variant, with the best variants marked with asterisks. Labels of variants not selected for testing are omitted for clarity. Open squares show the germline sequences used to root the tree. Squares, diamonds, and circles in (D) indicate F2-like, F3-like and Non-F2/F3 variants as assessed by junctional analysis in Supplementary Figure 6. Scale bars show residue substitution distance. Note that combination of F2, F3 and non-F2/F3 variants in the same tree in (D) does not indicate common descent from a progenitor B cell, solely sequence similarity clustering.
Twelve F3 light chain-paired and three F2 light chain-paired mAbs with heavy chain NGS variants expressed, but failed to bind antigen detectably in SPR (, Suppl. Fig. 7). Six heavy chain variants paired to the F2 light chain bound FcRH5 with an improved affinity relative to mAb F2, whereas one heavy chain variant (F-H25) paired to the F3 light chain bound with an affinity of 130 pM, about threefold better than the mAb F3 affinity (, , Suppl. Figs. 5 and 7). The best antibodies with the F3 light chain were obtained by pairing with the F3-like heavy chain variants (, blue diamonds). In contrast, pairing the F2 light chain with these F3-like heavy chain variants resulted in antibodies with low or undetectable binding affinity (, Suppl. Fig. 7). The converse was true for F2-like and non-F2/F3 heavy chain variants F-H1 to F-H22, which tended to result in higher affinity antibodies when paired with the F2 light chain (, blue circles). These same F2-like and non-F2/F3-like heavy chain variants yielded low affinity or non-binding antibodies when paired with the mAb F3 light chain (, blue circles).
Figure 4. Affinities of variant antibodies. Antibody variants with NGS-derived light, heavy or both light and heavy chains are shown in orange, blue and maroon as indicated in the top left box. Recombinant mAbs are shown in black and their affinities are highlighted with dashed lines. Non-binding variants are shown in small boxes above the graph. The lineage of the NGS-derived F1 to F3 heavy and light chain sequence variants are shown in different symbols as indicated above the graph, using the same symbols and colors as in and detailed in the large box above the graph for each reference mAb. Note that for the variants with NGS-derived heavy and light chains (in maroon) for F1 and F2 variants have light chains derived from the F1 (F-L8) and F2 (F-L5) lineages, respectively. F2 and F3-like sequences were determined by nucleotide junctional sequence analysis as shown in Supplementary Figure 4. Variants indicated by name omit the S- and F- prefixes for clarity. Variants with KD values above the upper bound are shown in the upper limit of the affinity scale. Affinities were determined at 25°C for all mAbs and variants.
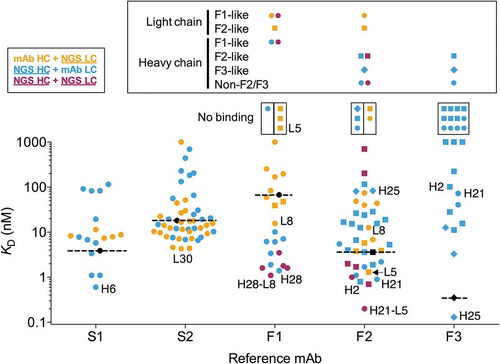
We further tested inter-lineage chain compatibility by combining the similar F1 and F2 light chain variants with the F1 and F2 mAb heavy chains. A total of 12 light chain variants with the IGKV4-63/IGKJ5 (F1-like) and five IGKV4-63/IGKJ4 (F2-like) germlines with CDR L3 length 9 were selected (, , Suppl. Fig. 2B). Both sets of light chain variants had Asp and Leu in position 31 and 96, respectively, as lineage markers. Variants with the mAb F1 heavy chain yielded higher affinity antibodies when paired to the F1-like light chains than the ones paired with F2-like light chains and vice-versa (, Suppl. Fig. 7). The highest affinity antibodies (F1-L8 and F2-L5) were obtained when pairing light chain variants with heavy chains of the mAbs within the same lineage. Overall, the results indicate that, although variants of increased affinity can be obtained by combining chains from different convergent lineages (e.g., antibody variant F-H21), most inter-lineage chain combinations result in antibodies that bind with poor affinity.
The F1 mAb has a unique heavy chain derived from the IGHV1-67 germline (). We selected eight heavy chain variants of mAb F1 (, , Suppl. Fig. 2A) and tested these variants in combination with the mAb F1 light chain. Seven of the eight antibodies tested bound with higher affinity than mAb F1, with improvements ranging from 7 to 49-fold relative to mAb F1 (, Suppl. Fig. 5 and 7).
Effect of combination of variant chains on affinity
We sought to understand whether combination of variant heavy and light chain sequences would result in affinity improvements beyond those obtained by combining variant with reference mAb chains. For the S2 variant chains, the 7 best heavy chains combined with the 11 best light chains did not yield variant antibodies with apparent affinity improvements relative to variant S2-L30 (data not shown). This was mostly due to the slow dissociation rate of variant S2-L30 at 37°C (, Suppl. Fig. 5), which provided a limited dynamic range for reliable detection of additional affinity improvements. Combination of the 7 best F1 heavy chain variants with the best F1 light chain variant, F-L8, resulted in antibody variants with 1.2 to 3.8-fold higher affinity relative to antibodies with the same heavy chains and mAb F1 light chain (, , Suppl. Figs. 5 and 7). Similar results were obtained with the mAb F2 variants (, , Suppl. Figs. 5 and 7). Pairing of the best F2 light chain variant, F-L5, to the seven best F2 heavy chain variants resulted in antibodies with additional 1.3 to 3.9-fold affinity improvements relative to the corresponding antibodies with the mAb F2 heavy chain. Interestingly, two heavy chain variants that, when combined with the reference mAb F2 light chain, yielded high-affinity antibodies produced low-affinity antibodies when combined with light chain variant F-L5 (, Suppl. Fig. 7). Overall, the results show that a combination of heavy and light chain variants can lead to further affinity improvements relative to variants with one mAb antibody chain.
Impact of mAb chain pairing on antibody off-target binding and pharmacokinetics in mice
Mispairing of antibody chains could potentially result in unexpected off-target binding.Citation6 We tested off-target binding potential in a previously described baculovirus (BV) enzyme-linked immunosorbent assay (ELISA) that correlates with antibody clearance in cynomolgus monkeys and humans.Citation23 The BV ELISA scores of antibodies with NGS-derived chains were similar to those of the reference mAbs and significantly lower than 5, the threshold for positive scoring in this assay (). Consistent with the results from the BV ELISA, shuffling of NGS-derived chain variants did not affect the pharmacokinetic properties of antibodies. In mice that received a single intravenous administration of IgG, antibody variants S1-H6 and S2-L30 exhibited comparable systemic clearance and exposure (i.e., AUC) compared to the reference mAbs S1 and S2 (, Suppl. Fig. 8).
Table 5. Pharmacokinetic properties of murine antibodies in C57BL6 mice.a
Discussion
Immune repertoire mining by NGS has been used mostly for the elucidation of immune responses in infected and vaccinated human donors. Despite its potential for application to mouse antibody discovery, a major focus of drug discovery in industry, the usefulness of NGS-based repertoire mining for antibody optimization in this context remains unclear. Here, we showed rapid affinity optimization of mouse antibodies against two different targets by NGS-based repertoire mining. Improvements in affinity ranged from 3 to 60-fold, with the larger improvements obtained with the lowest affinity mAb. Sub-nanomolar variants can be identified for mAbs with relatively high affinities (e.g., mAb F2 and F3). Importantly, the antibody variants derived from repertoire mining retain low off-target binding potential and favorable pharmacokinetic properties that are similar to the reference mAbs, essential attributes in therapeutic antibody candidates.
Two major challenges in the repertoire mining method described here are: 1) lineage definition in mouse repertoires, and 2) the large datasets from which variants must be selected. Uncertainty in mouse antibody lineage definition is due to the relatively limited information provided by short CDR H3 sequences, limited junctional diversity in the light chain and the existence of clonally independent convergent lineages, exemplified by the F1, F2 and F3 mAbs, presumed to be more prevalent in antibodies with relatively short CDR H3 sequences as found in mice. Some of these difficulties were compounded by the analysis of sequences at the amino acid level, which provides less information than nucleotide sequence analyses. Precision of lineage definition could be further improved by detailed nucleotide sequence analysis of junctional regions. For example, although amino acid sequence analysis yielded a set of overlapping heavy chain variants for the F2 and F3 mAb lineages, nucleotide sequence analysis of junctional regions in the selected heavy chains was able to differentiate F2-like, F3-like and what appeared to be additional convergent heavy chains, albeit with significant uncertainty (Suppl. Fig. 6). The importance of precise lineage definition is illustrated by the finding that, for the closely related F1, F2, and F3 mAbs, intra-lineage chain pairing tended to result in higher affinity antibodies than inter-lineage chain pairing. However, variants with inter-lineage chain pairings can result in high-affinity variants as well (e.g., variant F2-H21). Thus, in cases where lineage convergence is clear or suspected, testing the convergent antibody sequences as a single lineage, as done here for the F2 and F3 mAbs, may result in the identification of rare high-affinity variants.
The average 60% CDR H3 sequence identity used for lineage definition was an arbitrary value designed to sample a potentially wide range of CDR H3 somatic mutations in the datasets. In fact, five of the six heavy chain variants that, when paired with the F2 light chain, yielded higher affinity antibodies that had three or four residue mismatches with the mAb F2 heavy chain (64–73% identity), indicating that wide CDR H3 sequence diversity sampling can be effective at identifying high-affinity antibody variants. However, this threshold could be adjusted up to sample only more closely related sequences and to minimize the risk of sampling of sequences that are not part of the B cell lineage of interest.
The light chain repertoire has even less information than the heavy chain, as VJ recombination introduces insertions and deletions in the light chain of mouse antibodies with relatively low frequency. To avoid selection of light chains from different lineages with the same V and J germlines that may have irrelevant or unwanted mutations, we used somatic mutation markers for light chain lineage definition. This limited the sequence space search in the light chain to closely related or descendant clones of the reference mAbs. Despite this limitation, light chain variants that contributed to improved affinities were identified in three of the four antibodies tested.
The large sequence diversity in datasets for most variants poses the challenge of selecting sequences more likely to yield variants of high affinity. This is true even with the relatively limited sequencing depth used here ( and ), which probably did not fully sample the repertoires as indicated by the absence of exact matches for some of the mAbs in the datasets (Suppl. Fig. 2). Some of the observed diversity was probably generated by polymerase chain reaction (PCR) and sequencing errors. The impact of these two factors was minimized in most datasets by considering sequences with higher read numbers. Ignoring somatic mutations in irrelevant framework positions that are usually left with the human residue in most antibody humanization procedures further reduces the number of unique sequences to be considered, although potentially excluding rare useful variants. However, this still resulted in datasets of dozens or hundreds of unique sequences ( and ) that currently cannot be fully analyzed in a practical manner. Therefore, a critical question was whether relatively sparse sampling of sequence variants would be effective at identifying high-affinity variants in a range of antibodies. The results show that significant affinity improvements can in fact be achieved without the need for comprehensive sampling of the available repertoire diversity, even for mAbs with relatively high affinities. One possible reason for this is that many of the variants not tested had mostly different combinations or a subset of the same mutations found in the tested variants along with rarer mutations (data not shown), and may be redundant to a certain extent with those tested. If a small subset of mutations prevalent in the datasets is responsible for most of the observed affinity improvements, limited sampling would be expected to identify improved variants with relatively high probability. Still, more focused selection of variants based on parameters that correlate with affinity may help optimize variant search in datasets, somatic mutation load being a likely determining factor in affinity. For instance, variants that lead to higher affinity mAbs tend to have higher somatic mutation load (e.g. F-H25, F-L5, S-L30) although notable exceptions occur (e.g., F-H2, F-L8) ( and , Suppl. Fig. 9). However, not all variants with high somatic mutation loads lead to higher affinity mAb variants. Read counts did not correlate with affinity improvements (data not shown).
The key advantage of the repertoire mining method described here over traditional in vitro affinity engineering methods is that the tasks of generating and selecting improved antibody variants are largely done in vivo. Thus, variant sequences are immediately available once the sequences of mAbs of interest are determined, expediting the process of identifying variant antibodies with improved affinities. As commercial DNA synthesis is widely available, the repertoire mining method allows engineering of several lead mAbs in parallel without the need for randomized library construction and selection in parallel for different clones. The time required for synthesis, cloning, and expression of selected variants is similar to the time required for library construction and immunoglobulin G (IgG) expression in traditional affinity maturation. Therefore, the time and effort savings in the workflow described here relative to traditional affinity maturation methods correspond to those required for library selection and subcloning of hits to mammalian IgG expression vectors.
The repertoire mining method for affinity optimization should be particularly useful in the optimization of mAbs binding antigens that are not compatible with in vitro selection methods, not available or unstable in purified form or that are unknown (e.g., mAbs derived from whole cell immunizations) if cell-based or other assays are available to rank antibody variants. However, the repertoire mining method as described here may not be effective at identifying variants with different cross-reactivity patterns with antigen homologs, as the immune system typically does not select for these properties outside the context of self-reactivity. In fact, the effectiveness of our repertoire mining method may be more limited when preservation of mAb discrimination between closely related antigens or cross-reactivity between significantly distinct antigens (e.g., species variants) is required in the context of affinity maturation. Unpredictable fine specificity properties in clones within the same lineage with different affinities could potentially arise in these situations, but this remains to be determined. The method may also have limitations when very high affinities, beyond those invariants shown here, are required for the intended applications. In those cases, testing a substantially larger set of variants may be needed to achieve the desired fine specificity and affinity properties. Therefore, the effectiveness of the repertoire mining method for affinity improvement may depend on the affinity and fine specificity requirements that antibodies must meet and sequence conservation of the target antigen with relevant homologs.
Materials and methods
Antigen generation
The ninth Ig domain of FcRH5 with a His-tag fused at the N-terminus was expressed in Chinese hamster ovary (CHO) cells and purified from the culture media through Ni-NTA-agarose beads (Thermo Fisher). A secondary size-exclusion chromatography (SEC) step was performed using a Superdex S75 (GE Healthcare) column to remove aggregates. The pooled fractions were dialyzed against phosphate-buffered saline (PBS) and stored at 4°C. The identity of the protein was confirmed by in-source decay mass spectrometry. The protein was characterized by SDS-PAGE and analytical SEC coupled to a multi-angle laser light scattering (MALLS) detector. No aggregates were detected in the purified sample. His-tagged human αSyn was expressed in E. coli strain 58F3 transformed with the pST239/αSyn plasmid. E. coli paste from 1 L shake flask culture (15–20 g pellet) was solubilized in 10 volumes (w/v) of 20 mM Tris-HCl, pH 8.0, containing 7 M guanidine HCl. The cell lysate was centrifuged and the resulting supernatant was loaded onto a 20-ml Qiagen Ni-NTA metal chelate column equilibrated in 20 mM Tris-HCl, pH 8.6, containing 6 M guanidine HCl. The column was washed with additional buffer containing 50 mM imidazole (Ultrol grade; Calbiochem). The protein was eluted with buffer containing 250 mM imidazole. After dialysis, the N-terminal Unizyme-polyhis tag was cleaved off according to the manufacturer’s (Qiagen) instructions. The detagged protein was subsequently dialyzed into 6 M guanidine hydrochloride, pH 6.0. To generate the αSyn monomer, the protein was dialyzed into PBS (8 mM Na2HPO4, 137 mM NaCl, 2 mM KH2PO4, 2.7 mM KCl, pH 7.4) and then filtered through 0.2 μm filter (Millipore).
Mouse immunization, hybridoma panel generation and mAb sequencing
Five C57BL6 αSyn-knockout mice were immunized and boosted with 100 µg of human αSyn in Ribi adjuvant. Five Balb/c mice were immunized 100 µg FcRH5 domain 9 in complete Freund’s adjuvant followed by boosts of antigen with incomplete Freund’s adjuvant. Hybridoma fusions were performed as previously described except that both splenocytes and lymph node cells were used for fusion.Citation24 MAbs specific for αSyn and FcRH5 were identified by ELISA using IgG from purified hybridoma supernatants. Total RNA was extracted from hybridoma cells using an RNeasy Mini Kit (Qiagen) and reverse-transcription (RT) PCR of the heavy and kappa chains was performed using a SMARTer RACE cDNA Amplification Kit (Clontech). The PCR step was performed using the forward Universal Primer Mix from SMARTer RACE cDNA Amplification Kit for both chains and primers CTGCTCACTGGATGGTGGGAAG and CTGGWCAGGGMTCCAGAGTTCCA for the light and heavy chains, respectively. Amplified PCR products were directly sequenced by the dideoxy sequencing method.
Sequencing of mouse immune repertoires
Spleen and bone marrow cells were collected, red blood cells were removed by direct lysis with ammonium chloride. Remaining splenocytes and bone marrow cells were lysed in Buffer RLT (Qiagen). RNA was purified using the RNeasy Mini Kit according to the instructions from the manufacturer. RT of the heavy, kappa and lambda chains transcripts was performed in parallel reactions using a SuperScript First-Strand Synthesis System (Thermo Fisher Scientific). RT was performed with 1 µg total RNA, 2 pmol of reverse RT primers (Suppl. File 1) and 50 U SuperScript III reverse transcriptase in a 20 µl reaction according to manufacturer’s instructions. PCR was performed using 0.5 µM of forward and reverse primers high fidelity Phusion DNA Polymerase (New England Biolabs) for 30 cycles as follows: Denaturation at 98°C for 10 seconds, annealing at 55°C for 10 seconds and extension at 72°C for 5 minutes to maximize complete extension of products and attempt to minimize chimeric PCR products. Primers used for the RT and PCR steps are listed in Supplementary File 1. PCR forward and reverse primers were pooled in equimolar ratios. Amplicons of the expected size range around 300–350 base pairs were purified from agarose gels and sequenced by paired-end sequencing in an Illumina MiSeq instrument as described.Citation25
Sequence processing and selection of variant sequences for testing
Nucleotide sequence read assembly and parsing was done with the Abgenesis software (DistributedBio, South San Francisco, CA), using the IMGT® mouse germline reference sequence set.Citation26 Amino acid sequences of reads matching V and J germlines of mAbs, ignoring allele number, were extracted from the Abgenesis output FASTA files. Post-processing of sequences was done using a custom Excel macro to sequentially 1) extract sequences within variable region boundaries, 2) remove incomplete sequences and sequences with ambiguous residues, 3) remove the first eight residues of framework region 1 (FR1) encoded by amplification primers, 4) extract sequences matching mAb CDR3 length and identity threshold of 57% for CDR H3 sequences, and 5) identify and count unique variable region sequences. The 57% threshold better approximates a 60% amino acid identity across the range of CDR H3 lengths, as using a nominal 60% threshold results in several CDR H3 lengths (e.g., lengths 7, 12, 14, 17) having a significantly higher effective minimal identity (65% to 71%) than other lengths. Light chain sequence datasets were further filtered by the presence of specific somatic mutations or germline residues present in reference mAbs. Variant sequences were selected from a subset of sequences with read counts meeting a specified threshold and unique combination of residues in CDR and selected framework positions. The light chain framework residues that were considered for variant selection were located in Kabat positions 35, 36, 38, 43, 44, 46 to 49, 71, and 87. For the heavy chain, framework Kabat position 24, 37, 39, 45, 47 to 49, 71, 73, 76, 78, and 91 were considered. Sequence strings were created from each unique sequence by removing irrelevant framework positions. The unique subset of these string sequences was aligned using ClustalW and dendrograms were generated by the Neighbor-Joining method using the MEGA7 software.Citation27 Sequence variants were selected by visually inspecting sequences to ensure that most prevalent somatic mutations in CDR and relevant framework position were included in at least one selected variant and prioritizing variants with fewer framework mutations in irrelevant positions and higher read counts where possible. Sequence diversity of selected variants was confirmed by inspection of dendrograms.
DNA synthesis and IgG expression
Coding sequences of variable regions from mAbs and selected variants were generated by DNA synthesis (Genewiz) and cloned in IgG expression vectors. The last seven residues of the light chain variable region were determined by the expression vector as GTKLEIK or GTKVEIK for fully murine or murine/human chimeric constructs, respectively. Variable regions of mAbs S1 and S2 and their variants were cloned in mouse IgG2a expression vectors. Variable regions of mAbs F1, F2 and F3 and their variants and selected S1 and S2 variants were cloned as chimeric constructs in human IgG1, human Kappa chain expression vectors. Small-scale, high-throughput IgG expression and purification were performed as previously described.Citation28,Citation29 Selected high-affinity variants and reference mAbs were transiently expressed in CHO cells at the 1 L scale and purified by protein A affinity chromatography followed by SEC.
Surface plasmon resonance
Antibody clones identified from NGS were expressed as human IgG1 and tested for affinity by SPR in a BIAcore T200 apparatus (GE Life Sciences, Piscataway, NJ) in a protein A capture format. Briefly, test antibodies were captured on flow cells 2, 3, or 4 with flow cell 1 as a reference on a protein A (for chimeric human IgG1) or anti-mouse-Fc (for murine IgG2a) chip. Antigen was used as analyte, with a flow rate of 30 μl/minute. Between injections, the capture surface was regenerated by a 30-second injection of 10 mM glycine, pH 1.5 at a flow rate of 10 μl/minute. Interactions were assessed at 25°C or 37°C in 10 mM HEPES pH 7.4, 150 mM NaCl, 0.05% Tween 20. Reference data from the reference flow cell and from injection of buffer alone was subtracted prior to kinetic analysis. Kinetic information was calculated by fitting data to a 1:1 binding model. Reference subtraction and data fitting were performed using BIAevaluation software. Some affinity determinations were performed using a single-cycle kinetics method.
Epitope mapping
Epitope binning of anti-FcRH5 antibodies was performed as previously described.Citation30 The mAb S1 and S2 binding sites were mapped by ELISA. Synthetic peptides, containing an N-terminal biotin separated from the peptide by a polyethylene glycol-based spacer, were captured on ELISA plates coated with NeutrAvidin (Pierce). NeutrAvidin-captured biotinylated recombinant human synuclein monomer was used as a positive control. Binding of undiluted hybridoma supernatants was evaluated with a goat anti-mouse IgG Fc-horseradish peroxidase (Sigma, Cat. A0168), followed by incubation with 3,3ʹ,5,5ʹ-tetramethylbenzidine substrate and quantitation of the optical absorbance at 650 nm.
BV ELISA
The BV ELISA was performed as previously describedCitation23 using chimeric mouse/human IgG1 antibodies purified by protein A affinity chromatography and SEC.
Pharmacokinetics studies
All animal studies were performed in the animal facility accredited by the Association for Assessment and Accreditation of Laboratory Animal Care International. The procedures of animal studies were under the compliance of Institutional Animal Care and Use Committee of the facility. To measure systemic concentrations of antibodies, C57BL6 mice were injected with a single dose of 5 mg/kg antibody intravenously. Blood was collected via retro-orbital bleeding at 10 min, 1 hr, 6 hr, 1 day, 2 day, 3 day, 7 day, 14 day, and 21 day post-antibody administration. Serum was isolated from blood samples and applied to ELISA assay for concentration measurement. The area under the curve (AUC) of serum concentration-time profile, maximum serum concentration of antibody (Cmax), and the systemic clearance (CL) was assessed via non-compartmental analysis using WinNonlin 6.4 (Certara, St. Louis, MO).
Abbreviations
| αSyn | = | αSynuclein |
| AUC | = | area under the curve |
| BV | = | baculovirus |
| CDR | = | complementarity-determining region |
| CDR H3 | = | heavy chain CDR3 |
| CHO | = | Chinese hamster ovary |
| CL | = | systemic clearance |
| Cmax | = | maximum serum concentration of antibody |
| ELISA | = | enzyme-linked immunosorbent assay |
| FcRH5 | = | Fc-receptor homolog 5 |
| FR1 | = | framework region 1 |
| HIV-1 | = | human immunodeficiency type 1 virus |
| IgG | = | immunoglobulin G |
| IMGT® | = | the international ImMunoGeneTics information system® |
| mAb | = | monoclonal antibody |
| MALLS | = | multi-angle laser light scattering |
| NGS | = | Next-Gen sequencing |
| PBS | = | phosphate-buffered saline |
| PCR | = | polymerase-chain reaction |
| RT | = | reverse-transcription |
| SEC | = | size-exclusion chromatography |
| SPR | = | surface plasmon resonance |
Disclosure of Potential Conflicts of Interest
All authors are current or former employees of Genentech.
Supplemental Material
Download Zip (23.6 MB)Acknowledgments
We thank Kellen Schneider for animal immunization support, Pamela Chan for assistance with the BV ELISA assay and Ben Chih and Sheila Ulufatu for PK assay support. We also thank Steve Guerrero and Qing Zhang for helpful discussions.
Supplemental material
Supplemental data for this article can be accessed on the publisher’s website.
References
- Kohler G, Milstein C. Continuous cultures of fused cells secreting antibody of predefined specificity. Nature. 1975;256:495–97.
- Tiller T, Busse CE, Wardemann H. Cloning and expression of murine Ig genes from single B cells. J Immunol Methods. 2009;350:183–93. doi:10.1016/j.jim.2009.08.009.
- Hershberg U, Luning Prak ET. The analysis of clonal expansions in normal and autoimmune B cell repertoires. Phil Trans R Soc B. 2015;370:20140239.
- Levin AM, Weiss GA. Optimizing the affinity and specificity of proteins with molecular display. Mol Biosyst. 2006;2:49–57. doi:10.1039/b511782h.
- Parola C, Neumeier D, Reddy ST. Integrating high-throughput screening and sequencing for monoclonal antibody discovery and engineering. Immunology. 2018;153:31–41. doi:10.1111/imm.12838.
- Zhu J, Ofek G, Yang Y, Zhang B, Louder MK, Lu G, McKee K, Pancera M, Skinner J, Zhang Z, et al. Mining the antibodyome for HIV-1-neutralizing antibodies with next-generation sequencing and phylogenetic pairing of heavy/light chains. Proc Natl Acad Sci USA. 2013;110:6470–75. doi:10.1073/pnas.1219320110.
- Sok D, Laserson U, Laserson J, Liu Y, Vigneault F, Julien JP, Briney B, Ramos A, Saye KF, Le K, et al. The effects of somatic hypermutation on neutralization and binding in the PGT121 family of broadly neutralizing HIV antibodies. PLoS Pathog. 2013;9:e1003754. doi:10.1371/journal.ppat.1003754.
- Rudicell RS, Kwon YD, Ko SY, Pegu A, Louder MK, Georgiev IS, Wu X, Zhu J, Boyington JC, Chen X, et al. Enhanced potency of a broadly neutralizing HIV-1 antibody in vitro improves protection against lentiviral infection in vivo. J Virol. 2014;88:12669–82. doi:10.1128/JVI.02213-14.
- Yu L, Guan Y. Immunologic basis for long HCDR3s in broadly neutralizing antibodies against HIV-1. Front Immunol. 2014;5:250. doi:10.3389/fimmu.2014.00250.
- Burton DR, Hangartner L. Broadly neutralizing antibodies to HIV and their role in vaccine design. Annu Rev Immunol. 2016;34:635–59. doi:10.1146/annurev-immunol-041015-055515.
- Breden F, Lepik C, Longo NS, Montero M, Lipsky PE, Scott JK. Comparison of antibody repertoires produced by HIV-1 infection, other chronic and acute infections, and systemic autoimmune disease. PLoS One. 2011;6:e16857. doi:10.1371/journal.pone.0016857.
- Zemlin M, Klinger M, Link J, Zemlin C, Bauer K, Engler JA, Schroeder HW, Kirkham PM. Expressed murine and human CDR-H3 intervals of equal length exhibit distinct repertoires that differ in their amino acid composition and predicted range of structures. J Mol Biol. 2003;334:733–49.
- Schroeder HW Jr. Similarity and divergence in the development and expression of the mouse and human antibody repertoires. Dev Comp Immunol. 2006;30:119–35. doi:10.1016/j.dci.2005.06.006.
- Kabat EA, Wu TT, Perry HM, Gottesman KS, Foeller C. Sequences of proteins of immunological interest. Bethesda (MD): NIH Publication; 1991.
- Lefranc MP, Ehrenmann F, Ginestoux C, Giudicelli V, Duroux P. Use of IMGT((R)) databases and tools for antibody engineering and humanization. Methods Mol Biol. 2012;907:3–37. doi:10.1007/978-1-61779-974-7_1.
- Foote J, Winter G. Antibody framework residues affecting the conformation of the hypervariable loops. J Mol Biol. 1992;224:487–99.
- Presta LG, Lahr SJ, Shields RL, Porter JP, Gorman CM, Fendly BM, Jardieu PM. Humanization of an antibody directed against IgE. J Immunol. 1993;151:2623–32.
- Padlan EA. Anatomy of the antibody molecule. Mol Immunol. 1994;31:169–217.
- Bujotzek A, Dunbar J, Lipsmeier F, Schafer W, Antes I, Deane CM, Georges G. Prediction of VH-VL domain orientation for antibody variable domain modeling. Proteins. 2015;83:681–95. doi:10.1002/prot.24756.
- North B, Lehmann A, Dunbrack RL Jr. A new clustering of antibody CDR loop conformations. J Mol Biol. 2011;406:228–56. doi:10.1016/j.jmb.2010.10.030.
- Bengoa-Vergniory N, Roberts RF, Wade-Martins R, Alegre-Abarrategui J. Alpha-synuclein oligomers: a new hope. Acta Neuropathol. 2017;134:819–38. doi:10.1007/s00401-017-1755-1.
- Polson AG, Zheng B, Elkins K, Chang W, Du C, Dowd P, Yen L, Tan C, Hongo J-A, Koeppen H, et al. Expression pattern of the human FcRH/IRTA receptors in normal tissue and in B-chronic lymphocytic leukemia. Int Immunol. 2006;18:1363–73. doi:10.1093/intimm/dxl069.
- Hotzel I, Theil FP, Bernstein LJ, Prabhu S, Deng R, Quintana L, Lutman J, Sibia R, Chan P, Bumbaca D, et al. A strategy for risk mitigation of antibodies with fast clearance. MAbs. 2012;4:753–60. doi:10.4161/mabs.22189.
- Hazen M, Bhakta S, Vij R, Randle S, Kallop D, Chiang V, Hötzel I, Jaiswal BS, Ervin KE, Li B, et al. An improved and robust DNA immunization method to develop antibodies against extracellular loops of multi-transmembrane proteins. MAbs. 2014;6:95–107. doi:10.4161/mabs.26761.
- Chen Y, Kim SH, Shang Y, Guillory J, Stinson J, Zhang Q, Hötzel I, Hoi KH. Barcoded sequencing workflow for high throughput digitization of hybridoma antibody variable domain sequences. J Immunol Methods. 2018;455:88–94. doi:10.1016/j.jim.2018.01.004.
- Lefranc MP. IMGT, the international ImMunoGeneTics database: a high-quality information system for comparative immunogenetics and immunology. Dev Comp Immunol. 2002;26:697–705.
- Kumar S, Stecher G, Tamura K. MEGA7: molecular evolutionary genetics analysis version 7.0 for bigger datasets. Mol Biol Evol. 2016;33:1870–74. doi:10.1093/molbev/msw054.
- Bos AB, Luan P, Duque JN, Reilly D, Harms PD, Wong AW. Optimization and automation of an end-to-end high throughput microscale transient protein production process. Biotechnol Bioeng. 2015;112:1832–42. doi:10.1002/bit.25601.
- Luan P, Lee S, Arena TA, Paluch M, Kansopon J, Viajar S, Begum Z, Chiang N, Nakamura G, Hass PE, et al. Automated high throughput microscale antibody purification workflows for accelerating antibody discovery. MAbs. 2018;10:624–35. doi:10.1080/19420862.2018.1445450.
- Vij R, Lin Z, Chiang N, Vernes JM, Storek KM, Park S, Chan J, Meng YG, Comps-Agrar L, Luan P, et al. A targeted boost-and-sort immunization strategy using Escherichia coli BamA identifies rare growth inhibitory antibodies. Sci Rep. 2018;8:7136. doi:10.1038/s41598-018-25609-z.