
ABSTRACT
Growth in the pharmaceutical industry has led to an increasing demand for rapid characterization of therapeutic monoclonal antibodies. The current methods for antibody sequence confirmation (e.g., N-terminal Edman sequencing and traditional peptide mapping methods) are not sufficient; thus, we developed a fast method for sequencing recombinant monoclonal antibodies using a novel digestion-on-emitter technology. Using this method, a monoclonal antibody can be denatured, reduced, digested, and sequenced in less than an hour. High throughput and satisfactory protein sequence coverage were achieved by using a non-specific protease from Aspergillus saitoi, protease XIII, to digest the denatured and reduced monoclonal antibody on an electrospray emitter, while electrospray high voltage was applied to the digestion mixture through the emitter. Tandem mass spectrometry data was acquired over the course of enzyme digestion, generating similar information compared to standard peptide mapping experiments in much less time. We demonstrated that this fast protein sequencing method provided sufficient sequence information for bovine serum albumin and two commercially available monoclonal antibodies, mouse IgG1 MOPC21 and humanized IgG1 NISTmAb. For two monoclonal antibodies, we obtained sequence coverage of 90.5–95.1% for the heavy chains and 98.6–99.1% for the light chains. We found that on-emitter digestion by protease XIII generated peptides of various lengths during the digestion process, which was critical for achieving sufficient sequence coverage. Moreover, we discovered that the enzyme-to-substrate ratio was an important parameter that affects protein sequence coverage. Due to its highly automatable and efficient design, our method offers a major advantage over N-terminal Edman sequencing and traditional peptide mapping methods in the identification of protein sequence, and is capable of meeting an ever-increasing demand for monoclonal antibody sequence confirmation in the biopharmaceutical industry.
Introduction
Over the past two decades, more than 80 monoclonal antibodies have successfully been used as therapeutics for the treatment of various human diseases.Citation1-Citation3 As our understanding of targeted therapies has grown and recombinant monoclonal antibody technology has matured, pharmaceutical companies have been discovering and developing monoclonal antibody therapeutics at an unprecedented rate.Citation4 This growth has generated a challenging demand for the characterization of therapeutic monoclonal antibodies, which is essential for patent protection, regulatory approval, and quality control.Citation5 The first step in characterizing monoclonal antibodies is to determine the identity of the molecule by confirming its protein sequence.
Several analytical techniques have been used to confirm the protein sequence of therapeutic monoclonal antibodies. One such technique is N-terminal protein sequencing by Edman degradation, which has been used in the pharmaceutical industry for decades to confirm monoclonal antibody identity.Citation6 Edman degradation is still considered the most reliable technology, although it does have several disadvantages. Sample preparation for Edman degradation is tedious and consumes significant amounts of chemical reagents. The sequencing step in this technology is highly automated, but the method is low-throughput and can usually only sequence one amino acid residue per hour.Citation7 The efficiency of Edman degradation after 50 residues is low, making it unsuitable for sequencing large molecules such as monoclonal antibodies, which have more than 1200 amino acid residues.Citation8
Other than N-terminal sequencing by Edman degradation, additional methods such as peptide mapping have become routine practice as orthogonal techniques for monoclonal antibody sequence confirmation. A common peptide mapping workflow contains protein denaturation, reduction, and alkylation of cysteine residues, proteolytic digestion, and liquid chromatography coupled with tandem mass spectrometry (LC-MS/MS) analysis.Citation9-Citation19 Due to the rapid advancement of liquid chromatography and mass spectrometry instrumentation, this peptide mapping method can now routinely generate high sequence coverage, and thus has become the most effective approach for confirming monoclonal antibody identity. However, the sample preparation in this approach can take substantial amounts of time, from about 80 min up to 16 h, followed by additional LC-MS data acquisition in an hour timescale, making it difficult to accommodate rapidly submitted requests for monoclonal antibody sequencing.Citation20 Research efforts towards optimizing peptide mapping technology have been reported, such as the recent development of an on-line digestion system to reduce analysis time.Citation21,Citation22,
Considering the limitations of existing protein sequencing methods for sequence confirmation, we developed an effective and efficient method for sequencing recombinant monoclonal antibodies using a novel digestion-on-emitter technology to parallelize the protein digestion time with mass spectrometry data acquisition time. We have demonstrated that our method can denature, reduce, digest, and sequence a monoclonal antibody in less than an hour. The sequencing method provided high sequence coverage (>90% coverage of heavy and light chains) for tested commercially available monoclonal antibodies of mouse IgG1 MOPC21 and humanized IgG1 NISTmAb, demonstrating a simple and fast approach for confirming the amino acid sequence of proteins. Compared to the conventional LC-MS peptide mapping approach, which is the standard for extended characterization of monoclonal antibody, including protein sequence confirmation, post-translational modification (PTM) analysis, disulfide mapping, carbohydrate profiling, and charge- and sequence-based variants analysis, our fast protein sequencing (FPS) method is better suited to the current environment, where fast protein sequence confirmation is needed to fulfill the demand for quality control testing of an ever-increasing number of in-house produced monoclonal antibody-based therapeutic proteins (more than 1000 proteins per year) to support downstream drug development.
Results
Fast protein sequencing method
After protein was denatured, reduced, and desalted (see Materials and Methods), the sample was transferred to a sample plate on the Advion TriVersa NanoMate®, which was mounted on a Thermo Orbitrap mass spectrometer system.Citation23 Protease XIII was then added at the desired enzyme to substrate ratio (w/w). The enzyme and protein were mixed by pipetting up and down. The TriVersa NanoMate® infusion mode was triggered immediately afterward. The infusion mandrel first retrieved an infusion tip, then drew the sample. The infusion tip was then engaged to the electrospray ionization (ESI) chip. Subsequently, nanospray ESI and Orbitrap data acquisition were triggered. Tandem mass spectrometry data was acquired for 30 min. The total time for sample preparation and data acquisition was approximately 1 h.
Sequencing bovine serum albumin by FPS
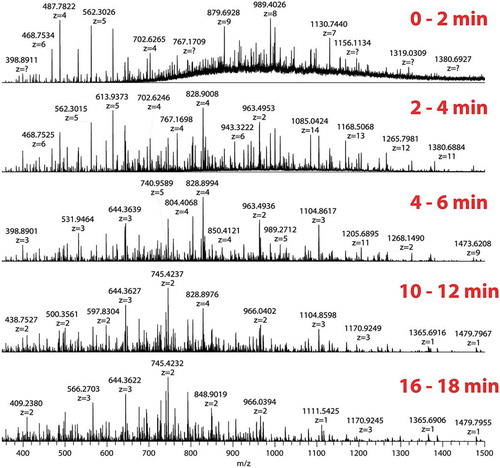
As bovine serum albumin (BSA) is a protein standard for evaluating LC-MS/MS systems, in the initial stage of method development we treated BSA with protease XIII using various weight ratios of enzyme to substrate (E/S) to provide the proof-of-principle. shows the full MS spectra of protease XIII digestion of BSA at different time points (E/S ratio = 1:5). Each panel in shows the spectrum averaged over 2 min subsequently. As can be seen from the figure, during the first 2 min of the digestion, most of the peptides that were generated possessed a charge state above +4, many of which were unresolved due to overlapping species from m/z 700 to m/z 1400. From 2 to 4 min, these very long peptides were then cleaved into relatively shorter peptides, with the highest mass around 15 kDa. The averaged spectrum from 4 to 6 min shows that the enzyme digestion now has generated smaller peptides with charge states ranging from +2 to +5. After 10 min, peptides with a charge state less than +3 became dominant.
Figure 1. Sequencing of BSA by FPS.
Full MS spectra of protease XIII digestion of BSA at various time points (E/S ratio 1:5). Each panel shows the spectrum averaged over 2 min.
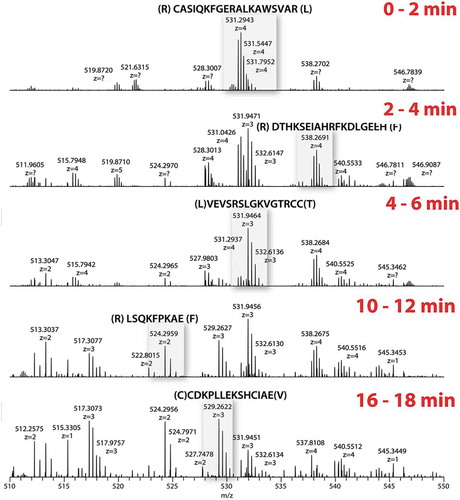
As mass spectrometry data were acquired throughout the entire digestion with protease XIII, we questioned whether new peptides were being generated over time. displays the mass spectrum over the m/z 500–550 range to provide a zoomed view of peptides generated during the digestion. In the spectrum of 0 to 2 min, peptide CASIQKFGERALKAWSVAR (m/z 531, z = 4) is the most abundant species. From 2 to 4 min, several other peptides appeared in the spectrum, with peptide VEVSRSLGKVGTRCC becoming the new base peak (m/z 532, z = 3). The following spectra of 4–6, 10–12, and 16–18 min continually showed the appearance of varying sets of peptides. It should be noted that the high resolution provided by the Orbitrap mass analyzer unambiguously supported the peptide identification from such a complex peptide mixture.
Figure 2. On-emitter protease XIII digestion of BSA.
Expanded view (m/z 500–550) of spectrum averaged over 2 min. Different sets of peptides were generated along the digestion.
Our novel experimental design and the unique enzyme cleavage pattern of protease XIII enabled us to obtain a similar level of protein sequence coverage as LC-MS/MS peptide mapping experiments. Of the many experimental conditions that we explored, we found that the enzyme-to-substrate ratio is the most important factor for achieving satisfactory sequence coverage. shows the resulting sequence coverage of BSA by applying our FPS method, using 1:1, 1:5, and 1:10 E/S ratios. The experiment in which a 1:5 weight ratio of enzyme to substrate was used produced 95.4% BSA sequence coverage, which is higher than the sequence coverage of 88.7% using 1:1 E/S ratio, and 91.3% using 1:10 E/S ratio. This suggests that it is necessary to optimize the enzyme-to-substrate ratio, and thus the protease XIII on-emitter digestion rate, to achieve good sequence coverage. When the enzyme-to-substrate ratio is unsuitably high, the correspondingly high digestion rate will not allow sufficient time for larger peptides to be analyzed by the mass spectrometer, and sequence coverage will be compromised. Particularly, in our method, the ~20 s that elapses between the step of enzyme and substrate mixing to the step of data acquisition is unavoidable, due to mechanical movements such as tip pickup, sample pickup, and engagement onto the spray nozzle. This 20-s period is trivial for commonly used proteases such as trypsin or Asp-N; however, because of the fast digestion with protease XIII, a considerable amount of sequence information could be lost. On the other hand, a low E/S ratio would need long digestion time and thus long data acquisition time, and therefore cannot accommodate our FPS approach, as we intend to limit the parallel digestion and data acquisition process to 30 min.
Figure 3. Enzyme to substrate ratio is an important factor of FPS method.
Sequence coverage maps of BSA at different enzyme to substrate ratios. Amino acid sequence highlighted in red is the signal peptide, and amino acid sequences identified by FPS method are highlighted and underlined in green.
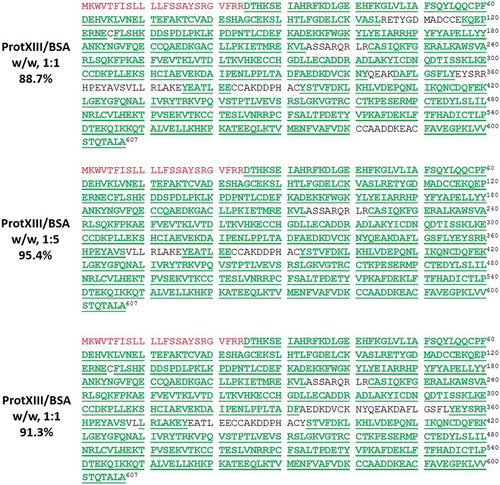
A full list of identified peptides with high confidence (false discovery rate (FDR) 1%) from protease XIII digestion of BSA at 1:5 E/S ratio is summarized in Supplemental Table S1. The data generated at different E/S digestion ratios were searched against the protein sequence provided by the commercial vendor, which contained an N-terminal signal peptide (highlighted in red in ). However, as shown in Supplemental Table S1, this signal peptide was not identified in this method, and the corresponding region in the protein sequence chain was not covered (). We confirmed that the N-terminal signal peptide in BSA had been removed during the manufacturing process. This method thus provides an efficient way for protein sequence confirmation by achieving high sequence coverage and is effective in identifying when a protein sequence is not matched as expected.
Sequencing mouse IgG1 MOPC21 and humanized IgG1 NISTmAB monoclonal antibodies by FPS
After demonstrating the effectiveness and efficiency of our method using BSA, we used our FPS method to sequence two monoclonal antibodies, mouse IgG1 MOPC21 and humanized IgG1 NISTmAb. Because we learned from our BSA experiments that the enzyme-to-substrate ratio is critical, we first compared the digestion patterns of MOPC21 using 1:1 and 1:5 E/S ratios (). In the 1:5 E/S ratio spectrum, we observed large sections of antibody (highlighted region) in the first 2 min, and, in the 10–12 min averaged spectrum, there was still a substantial amount of highly charged species shown, signifying large peptides. However, when an E/S ratio of 1:1 was used, peaks with charge states less than 4 dominated the averaged spectrum over the first 2 min, while the averaged spectrum from 10 to 12 min contains mainly singly and doubly charged smaller peptides.
Figure 4. Sequencing of IgG1 MOPC21 by FPS.
The application of FPS on a mouse monoclonal antibody IgG1 MOPC21 requires optimization on enzyme to substrate ratio. Each panel shows a spectrum averaged over 2 min.
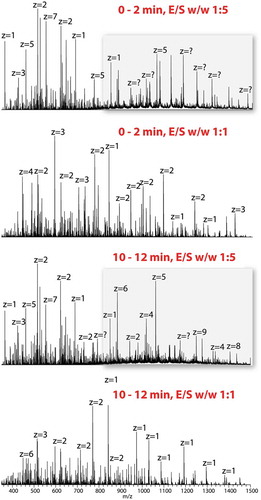
The data shown in demonstrates that the protein digestion rate at the E/S ratio of 1:1 for MOPC 21 might be high, resulting in some larger peptides that would not be analyzed by the mass spectrometer. In the case of IgG1 MOPC21, an E/S ratio of 1:5 elucidates more sequence information than E/S ratios of 1:1 and 1:10 (not shown). The sequence coverage of MOPC21 heavy chain and light chain were 87.4% and 99.1%, respectively, which are higher than the sequence coverage we obtained with E/S ratios of 1:1 (86.7% and 96.7% for heavy chain and light chain, respectively) and 1:10 (71.3% and 98.1% for heavy chain and light chain, respectively).
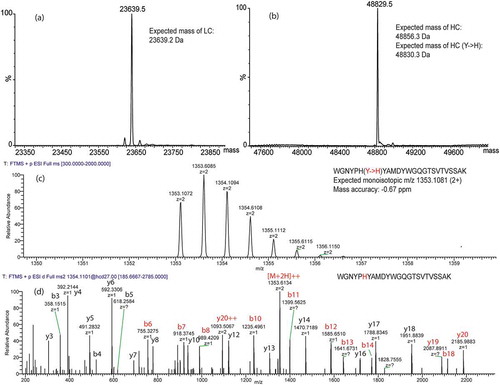
The sequence coverage we obtained with an E/S ratio of 1:5 is shown in . However, we noted that there was no coverage in the complementarity-determining region 3 (CDR3) of MOPC 21 heavy chain in different E/S ratios, which raised a concern about the fidelity of the heavy chain sequence. To confirm the sequence of MOPC 21 monoclonal antibody, intact mass analysis under reduced and deglycosylated conditions and tryptic peptide mapping of reduced and alkylated MOPC21 were performed. As shown in , the experimental mass of the light chain matched well with the expected mass (), but there was 26 Da difference between the experimental mass and expected mass of the heavy chain (). In the tryptic peptide mapping, tryptic peptides mainly generated from the CDR3 of the heavy chain were examined. There was one tryptic peptide that was not found, but a point mutation from an amino acid residue Tyr to His in this tryptic peptide was discovered and confirmed by the MS/MS spectrum (,d). The experimental mass matched well with the expected mass of the heavy chain with the substitution Tyr for His (). The sequence coverage of MOPC21 heavy chain was improved to 90.5% after amino acid substitution and the CDR3 was mostly covered (). The sequence coverage maps of heavy chain, heavy chain with point mutation, and light chain of MOPC 21 are shown in Supplemental Figure S1. This further exemplifies the effectiveness of this method to detect small changes (i.e., amino acid substitution) in the protein sequence.
Figure 5. Sequence coverage of IgG1 MOPC21 using FPS method (E/S ratio 1:5).
Sequence coverage map of heavy chain of IgG1 MOPC21 with expected sequence (upper).Sequence coverage map of heavy chain of IgG1 MOPC21 with point mutation (Tyr to His, highlighted in red) in the CDR3 (middle). Sequence coverage map of light chain of IgG1 MOPC21 with expected sequence (bottom). Amino acid sequences identified by FPS method are highlighted and underlined in green, and glycosylation motif (NST) in heavy chain is highlighted in red.
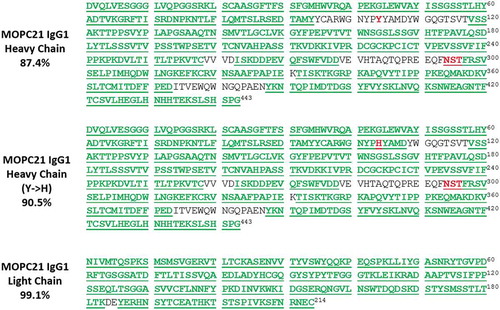
Figure 6. Intact mass analysis of reduced and deglycosylated MOPC 21 and tryptic peptide mapping of reduced and alkylated MOPC21.
Deconvoluted mass spectra of light chain (a) and deglycosylated heavy chain (b) of MOPC 21. MS1 (c) and MS/MS (d) spectra of a tryptic peptide in the CDR3 of heavy chain with a point mutation of Tyr to His. Note that fragment ions containing the mutant amino acid residue in the MS/MS spectrum are highlighted in red.
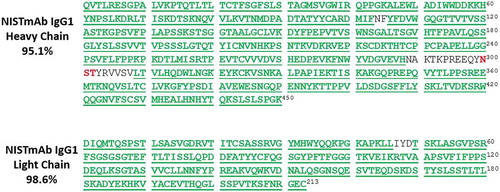
For humanized IgG NISTmAb, an E/S ratio of 1:5 also elucidates more sequence information than E/S ratios of 1:1 and 1:10. The sequence coverages of NISTmAb heavy chain and light chain obtained with an E/S ratio of 1:5 were 95.1% and 98.6%, respectively (). For this FPS method, we did not identify Fc domain glycosylation in our database search because of the poor quality of MS/MS spectra of glycopeptides; therefore, there was no coverage around the consensus sequence (marked in red) of N-glycosylation in the heavy chain CH2 constant domain. Since the sequence motif and glycosylation site in this region of antibodies are well understood, the sequence coverage of the heavy chain would likely be higher if we take glycosylation into consideration. Full lists of identified peptides with high confidence (FDR 1%) from protease XIII digestions of MOPC21 (corrected sequence) and NISTmAb at 1:5 E/S ratio were summarized in Supplemental Table S2 and S3, respectively.
Figure 7. Sequence coverage of humanized IgG1 NISTmAb using FPS method (E/S ratio 1:5).
Sequence coverage maps of heavy chain and light chain of IgG1 NISTmAb. Amino acid sequences identified by FPS method are highlighted and underlined in green, and glycosylation motif (NST) in heavy chain is highlighted in red.
Cleavage preference of protease XIII
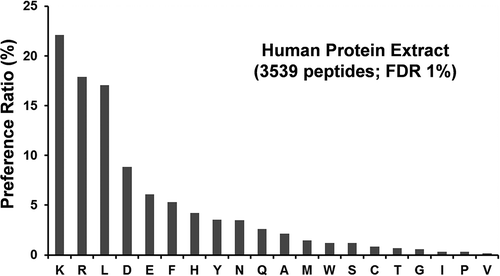
Cleavage preference of a protease is determined based on the ratio of the number of a particular amino acid as the site of cleavage to the total number of cleaved amino acids in the protein sequences. shows the cleavage preferences of protease XIII on human protein extracts, and Supplemental Table S4 shows a full list of identified peptides with high confidence (FDR 1%) from protease XIII digestion of human protein extract. For the statistical analysis of 3539 peptides in this study, we observed a stronger preference of protease XIII to cleave at the C-terminal of two basic amino acid residues (lysine and arginine residues) and one neutral amino acid residue (leucine residue) compared to other amino acid residues. Our observation is similar to that reported by Zhang et al.Citation24 We observed a surprisingly lower preference of protease XIII to cleave at the C-terminal of isoleucine compared with leucine (Ile 0.3% vs. Leu 17% in terms of preference ratio), given that the amino acid abundance of leucine is only twice as much as that of isoleucine.Citation25 Poston et al. developed a set of orthogonal biochemical protocols to experimentally determine the identity of Ile or Leu residue isomer for de novo sequencing of monoclonal antibodies based on the selectivity that leucine aminopeptidase shows for N-terminal Leu residue and the cleavage preference for C-terminal Leu by chymotrypsin. A logistic regression model was designed to calculate a statistical possibility for the identity of Leu at an ambiguous site in monoclonal antibodies by combing the germline frequencies of Leu or isoLeu at an ambiguous site with the experimentally determined identity of Leu or isoLeu at that site. It has been demonstrated that the developed method can generate a probability for an Xle (Leu or Ile) site in a monoclonal antibody with 96% accuracy.Citation26 This finding in our study regarding the relative specificity of protease XIII on 20 amino acid residues suggests that protease XIII could be considered as a potential leucine-specific protease to differentiate Leu from Ile residue in the protein de novo sequencing. Future work will be focused on the development of a mathematic model incorporating the FPS results of protease XIII digestion to predict the statistical probability of Leu or isoLeu at an ambiguous site in monoclonal antibody in a more efficient way.
Figure 8. Protease XIII cleavage preference.
The protease XIII cleavage preference for each amino acid residue is calculated as n1/n2, where n1 is the number of each cleaved residue, and n2 is the total number of all cleaved residues identified in the protease XIII digestion of human protein extracts. The false discovery rate (FDR) was set to 1% for peptide identification.
Discussion
Compared to the traditional bottom-up protein sequencing approach, our FPS method offers several unique advantages. The sample preparation and instrument operation procedures are simple to follow, and protein reduction and desalting take only 20–30 min. As digestion occurred on the spray emitter, we did not observe significant amounts of disulfide bond reforming after reduction, so there was no need for an alkylation step. Furthermore, most of the efficiency of our FPS method results from the fast digestion rate by protease XIII, the novel design of having the digestion occur on a spray emitter, and the acquisition of the mass spectrometry data in parallel to digestion. As a result, we substantially reduced the duration of digestion and mass spectrometry data acquisition from 8 to 20 hours to less than 30 min. Because the protein digestion is monitored in real-time, it offers a unique view on regions along the protein amino acid sequence that are most susceptible to enzyme digestion. Although our FPS method could be implemented on any nanospray infusion setup, using the direct infusion mode of Advion TriVersa NanoMate® greatly simplified our workflow, enhanced the level of automation, and strengthened the robustness of our approach. In this study, a workflow with a 30-min data acquisition method was developed. However, it is possible to achieve the same sequence coverage in even a shorter period. As shown in , peptides with +1 to +3 charge states were dominant during the period of 16–18 min. Further digestion reduced the charge states of +2 and +3 to +1 (data not shown), for which peptides do not yield useful MS/MS spectra for sequencing, and therefore cannot improve sequence coverage. The same case is also shown in the 1:1 E/S ratio 10–12-min spectrum of , with singly charged species already appearing at high abundance.
Compared with commonly used proteases such as trypsin or Asp-N, protease XIII showed low specificity (). Non-specific cleavage is essential for the production of a substantial number of overlapping peptides, which is critical for obtaining good sequence coverage. As there is no LC separation, the vast number of peptides generated during the digestion may lead to a crowded spectrum, which makes the isolation of precursor ions a challenging task. Therefore, it is essential to combine the TriVersa NanoMate® with high-resolution mass spectrometry for confident peptide identification from crowded spectra when using this technique. For example, in , in the first 2 min, a + 4 charge state peptide CASIQKFGERALKAWSVAR was the base peak in the expanded m/z range. Two minutes later, a + 3 charge state peptide VEVSRSLGKVGTRCC appeared just next to the peptide CASIQKFGERALKAWSVAR. The m/z values of these two peptides are very similar. With a standard precursor isolation width, these two peptides would be co-isolated, and thus a mixed higher collision energy dissociation (HCD) MS/MS spectrum could be generated. We were initially concerned about the possibility of a mixed spectrum interfering with peptide identification. However, during the experiment, we found that usually the mass spectrometer was able to isolate the precursor while its vicinity is relatively free of contaminant ions. Using the same example presented in , when the digestion continued from 4 to 6 minutes, the +4 charge state peptide CASIQKFGERALKAWSVAR was almost fully digested and the +3 charge state peptide VEVSRSLGKVGTRCC became the base peak. Thus, the +3 charge state peptide can be isolated with high purity, generating a clean MS/MS spectrum for the peptide identification.
To obtain the best results from our FPS method, the E/S ratio for the protease XIII digestion must be optimized. Future work may be directed to investigating the relationship between the physical and chemical properties of the protein and the optimized E/S ratio. As recombinant monoclonal antibodies contain substantially conserved conformation and amino acid sequence, the optimized E/S ratios of 1:5 in our work on mouse IgG1 MOPC21 and humanized IgG1 NISTmAb, respectively, could be used to guide the sequencing of other IgG molecules using the FPS method. Besides E/S ratio, pH and temperature can also alter the digestion rate by affecting the enzymatic activity. In our experiments, the digestion/electrospray buffer was 0.1% formic acid in Milli-Q water, and the digestion occurred on the infusion tip, which was engaged to the spray nozzle. The nozzle is a few millimeters away from the mass spectrometer ion transfer tube, which was heated at 350°C. It has been reported by several groups that an optimized digestion condition for protease XIII after a hydrogen/deuterium exchange experiment was pH 2.3–2.5 at 0°C for 2 min, which shows that protease XIII has a high tolerance for pH and can still be active at a pH as low as 2–3.Citation23,Citation27 Although protease XIII is generally categorized as a non-specific protease, we showed that this enzyme prefers to cleave on the C-terminal side of basic amino acids and, interestingly, leucine amino acid residue (). This facilitates the generation of peptides that may become highly charged under positive ESI mode, enhancing ionization efficiency and benefiting the following MS/MS fragmentation.Citation23,Citation27 This also provides a protease-specificity-based approach for the distinction of leucine from isoleucine in protein de novo sequencing.
The FPS method that we developed is easily automatable, highly efficient, and effective for protein sequence confirmation. We have shown that the FPS method enables us to denature, reduce, digest, and sequence a monoclonal antibody in less than 1 h. Furthermore, coupling a commercially available automated liquid handling workstation for sample preparation with subsequent parallel digestion and acquisition by Nanomate-mass spectrometer would advance the current semi-automated platform to improve the method throughput, which could help meet the demands of an ever-increasing number of samples for in-house protein identity quality control testing of monoclonal antibody-based therapeutic proteins. Our novel design includes: (1) the use of a non-specific protease, protease XIII, (2) real-time digestion on the spray emitter in parallel to mass spectrometry data acquisition, (3) innovative use of the NanoMate coupled with Orbitrap for protein sequencing, (4) discovery of the practical value of temporal peptide separation during protease XIII digestion, and (5) discovery of a potential application of this non-specific protease for Leu and Ile differentiation in the de novo sequencing of proteins. Our FPS method sequences a protein much faster than alternative technologies, including N-terminal Edman sequencing and LC-MS/MS peptide mapping methods, and therefore has the highest potential to accommodate the increasing demands from the biopharmaceutical industry for sequence confirmation of monoclonal antibodies.
We note that, although this method offers an alternative, fast way of sample analysis to confirm the protein sequence of monoclonal antibody, it has several limitations for an extended characterization, such as PTM analysis. Firstly, the protease XIII is a non-specific protease, generating native peptides and post-translationally modified peptides with variable lengths, which will undoubtfully increase the difficulty and inaccuracy of relative quantitation of PTMs. Secondly, the efficiency of this method for protein sequencing lies in the simultaneous protein digestion and mass spectrometry data acquisition, which would enable us to monitor the digestion process of protein in real time. However, this would also generate the targeted peptides being detected continuously in a defined time window. It is unlikely to extract a well-shaped EIC peak for peak area integration for quantitation similar to what we usually do in the traditional peptide mapping method. Thirdly, since there is no LC separation before the mass spectrometry analysis, detection of a low abundance modified peptide is likely suppressed by the co-ionized high abundance native peptides, rendering the PTM or even sequence variants analysis unreliable. For some particular PTM analysis such as deamidation, native and deamidated peptides differing by only a mass difference of +0.98 Da could be co-isolated for MS/MS fragmentation, and differentiating one from the other in a mixed MS/MS spectrum would be challenging. Despite these deficiencies, the development of this innovative method enables the confirmation of protein sequences at an increased speed to meet the biopharmaceutical industry’s needs for the selection and validation of lead candidates.
Materials and methods
Materials
Standard protein BSA, humanized IgG1 NISTmAb and IgG1 Kappa murine myeloma (Clone Number MOPC 21) monoclonal antibodies, and protease from Aspergillus Saitoi (Type XIII) were purchased from Sigma (St. Louis, MO, USA). Amino acid sequences of BSA, NISTmAb and MOPC 21 were provided by vendors. Tris (2-carboxyethyl) phosphine hydrochloride (TCEP-HCl) and glacial acetic acid were purchased from Thermo Scientific (Newington, NH). Milli-Q Water was obtained from Millipore Milli-Q Advantage A10 Water Purification System (Billerica, MA, USA). Trifluoroacetic Acid (TFA) and formic acid (FA) were purchased from Thermo Scientific (Newington, NH). Acetonitrile (Optima LC/MS) was purchased from Fisher Scientific (Suwanee, GA). MS-compatible human protein extract prepared from human K562 cells was purchased from Promega (Madison, WI, USA). NanoSep 10K filters were purchased from Pall Life Sciences (Ann Arbor, MI).
Protein and protease XIII preparation
A 1 µg/µL BSA stock solution was made with Milli-Q water. BSA stock solution (100 µg) was mixed with 1 µL of 1 M acetic acid and 2 µL of 0.5 M TCEP-HCl (final pH was 3). The mixture was incubated for 10 min at 80°C. The reduced sample was desalted with a NanoSep 10K filter for 12 min and resuspended in 100 µL 0.1% formic acid in Milli-Q water.
MOPC 21 was supplied as a solution with a concentration of 1.0 mg/mL in 0.02 M Tris-buffered saline, pH 8.0 and buffer-exchanged into Milli-Q water with a NanoSep 10K filter. NISTmAb was supplied as a concentration of 10 mg/mL in 12.5 mmol/L L-histidine, 12.5 mmol/L L-histidine HCl (pH 6.0) and used directly. Each monoclonal antibody (100 µg) was reduced and desalted as described above. A 10 µg/µL protease XIII stock solution was made with Milli-Q water.
Direct infusion mass spectrometry analysis of proteins
The fast protein sequencing of BSA, IgG1 MOPC 21 and NISTmAb was performed using a Q-Exactive hybrid mass spectrometer (Thermo Fisher Scientific, San Jose, CA, USA) with a TriVersa NanoMate® (Advion Biosciences, Ithaca, USA) mounted in front. The TriVersa NanoMate was operated in the infusion mode. The TriVersa NanoMate was triggered once the protein and protease XIII were mixed. The infusion mandrel retrieved an infusion tip from the infusion tip tray and moved to the Eppendorf plate (Protein LowBind MTP 384/V-bottom, Eppendorf, Edison, NJ, USA) to aspirate 15 μL of sample (~15 µg). The infusion mandrel then engaged the infusion tip to the chip, and a positive voltage (1.4 kV) was applied on the carbon-coated infusion tip while the mass spectrometer sample orifice remained at 0 kV. The intense electrostatic field between the sample in the infusion tip and the grounded outside surface of the spray nozzle on the nano ESI chip generated the electrospray. The vacuum inside the mass spectrometer forced the positive ions into the mass spectrometer. Mass spectrometry analysis was completed in 30 min using a method consisting of one high-resolution full MS (resolution of 70,000 at m/z 200) acquired in the orbitrap, followed by 10 data-dependent HCD scans acquired in orbitrap (resolution of 17,500 at m/z 200). The raw data were searched against a protein database containing BSA, IgG1 MOPC21 or IgG1 NISTmAb sequence with SEQUEST embedded into Proteome Discoverer 1.4 (Thermo Scientific). The search parameters used were as follows: 10 ppm tolerance for precursor ion masses, 0.02 Da tolerance for fragment ion masses analyzed by Orbitrap. No enzyme was specified during the database search. The FDR was determined by using the target-decoy strategy and was set to 1% for peptide identification.Citation28
Peptide mapping of reduced and alkylated MOPC 21
Tryptic mapping of reduced and alkylated MOPC 21 was performed to confirm the antibody sequence. One hundred micrograms of MOPC 21 was denatured and reduced in a solution containing 5 mM acetic acid and 5 mM TCEP-HCl by heating at 80°C for 10 min. To prevent protein precipitation, 78 µL of 8 M urea was added to the denatured and reduced sample. The sample was then alkylated with 3 μL of 0.25 M iodoacetamide, diluted with 257 µL of 50 mM Tris-HCl, pH 7.5, and digested with 10 µL of 1 μg/μL of trypsin at an enzyme-to-substrate ratio of 1:20 (w/w) at 37ºC in darkness for 4 h. The digestion was stopped by the addition of 7 μL of 10% TFA. The resulting tryptic peptides were then separated by reversed-phase ultra-performance liquid chromatography (UPLC) followed by on-line mass spectrometry analysis to determine the peptide masses and confirm peptide sequences. Briefly, an aliquot of ~8 μg of digested protein was injected onto a Waters BEH130 C18 column with column temperature set at 40°C and a solvent flow rate of 0.25 mL/minute. Mobile phase A was water containing 0.05% TFA, and mobile phase B was acetonitrile containing 0.045% TFA. The column was initially equilibrated with 99.9% mobile phase A. Post sample injection, the gradient began with a 5 min hold at 0.1% mobile phase B, followed by a linear increase to 35% mobile phase B over 75 min for optimal peptide separation. MS and MS/MS experiments were conducted on a Q-Exactive hybrid mass spectrometer with HCD employed for peptide fragmentation for MS/MS experiments.
Intact mass analysis of reduced and deglycosylated MOPC 21
Intact mass measurement of the deglycosylated and reduced MOPC 21 was performed to confirm whether the experimental molecular weight of the isolated heavy chain and light chain matched the expected molecular weight based on the amino acid sequence of MOPC 21. MOPC 21 was diluted to 0.5 µg/µL in Milli-Q water, then treated with PNGase F (1 IUB milliunit per 5 µg of protein) at 37°C for 4 h to completely remove the glycan chains from each heavy chain constant region. The deglycosylated MOPC 21 was then reduced with 10 mM TCEP at 50°C for 30 min to separate heavy and light chains for mass analysis. The sample (~2 µg) was injected onto a Waters ACQUITY UPLC BEH300 C4 column (1.7 µm, 2.1 mm × 50 mm) equilibrated with 99% of mobile phase A (0.1% formic acid in water) and 1% of mobile phase B (0.1% formic acid in acetonitrile) prior to sample injection. The column temperature was maintained at 80°C and flow rate was set at 0.25 mL/min. The protein was eluted by a linear gradient from 1% to 70% mobile phase over the course of 25 min and analyzed by Waters Xevo G2S TOF mass spectrometer for mass measurement. The ESI-TOF mass spectra were deconvoluted using a Maximum Entropy algorithm from MassLynx V4.1.
Nano-liquid chromatography mass spectrometry analysis of in-solution protease XIII digest of human protein extract
Human protein extract solution (100 µg) was mixed with 5 mM dithiothreitol and incubated at 37°C for 30 min. The reduced samples were then digested with protease XIII (1:1 w/w enzyme: substrate ratio) at room temperature for 10 min. For peptide separation and identification, a peptide mixture generated by protease XIII digestion was loaded onto a reverse phase trap column (2 cm × 75 µm, 5 µm) and then eluted to the C18-reversed-phase analytical column (15 cm × 75 µm, 3 µm) for the separation. Buffer A (0.1% formic acid in water) was used for equilibration of chromatographic columns, and buffer B (0.1% formic acid in acetonitrile), with a linear gradient from 5% to 40% B at a flow rate of 300 nL/min within 2 h, was utilized for mixture separation. The peptides were subjected to a nano-electrospray ionization followed by HCD MS/MS in a Q-Exactive Plus hybrid mass spectrometer coupled to Easy nLC (Thermo Fisher Scientific). The mass spectrometer was operated in positive-ion detection mode. A Full MS scan was acquired in the Orbitrap mass analyzer over an m/z range of 400–2000 at a resolution of 70,000 (at m/z 200). The 10 most abundant ion peaks with charge state ≥2 were fragmented in the HCD collision cell with normalized collision energy of 27% for each full scan cycle, and tandem mass spectrum was acquired in the Orbitrap mass analyzer with a resolution of 17,000 (at m/z 200). The automatic gain control targets were set to 1.0E+06 for full MS scan and 1.0E+05 for MS/MS scan. The underfill ratio was defined as 0.1%, and the maximum allowed ion accumulation times were 50 ms for full MS scans and 100 ms for tandem mass spectrum. The dynamic exclusion was set to 15 s. Database search of protease XIII digested human protein extract LC-MS/MS raw data was performed using SEQUEST embedded into Proteome Discoverer 1.4 (Thermo Fisher Scientific) against the UniProt human protein database. The search parameters used were as follows: 10 ppm tolerance for precursor ion masses, 0.02 Da tolerance for fragment ion masses analyzed by Orbitrap. No enzyme was specified during the database search. Methionine oxidation (+16 Da) was set as a variable modification. The FDR was determined by using the target-decoy strategy and was set to 1% for peptide identification.Citation28
Abbreviations
| BSA | = | bovine serum albumin |
| CDR | = | complementarity-determining region |
| ESI | = | electrospray ionization |
| E/S | = | enzyme to substrate |
| FDR | = | false discovery rate |
| FPS | = | fast protein sequencing |
| FA | = | formic acid |
| HCD | = | higher collision energy dissociation |
| LC-MS/MS | = | liquid chromatography tandem mass spectrometry |
| PTM | = | post-translational modification |
| TFA | = | Trifluoroacetic Acid |
| TCEP-HCl | = | Tris (2-carboxyethyl) phosphine hydrochloride |
| UPLC | = | reversed-phase ultra-performance liquid chromatography |
Supplemental Material
Download Zip (594.6 KB)Acknowledgments
This study was sponsored by Regeneron Pharmaceuticals Inc. The authors would like to thank Ashley Roberts and Katherine Pochini of Scientific Writing Group for their assistance in drafting and polishing the manuscript.
Supplementary material
Supplemental data for this article can be accessed on the publisher’s website.
Additional information
Funding
References
- Ecker DM, Jones SD, Levine HL. The therapeutic monoclonal antibody market. MAbs. 2015;7:9–14. doi:10.4161/19420862.2015.989042.
- Strohl WR. Current progress in innovative engineered antibodies. Protein Cell. 2018;9:86–120. doi:10.1007/s13238-017-0457-8.
- Carter PJ, Lazar GA. Next generation antibody drugs: pursuit of the ‘high-hanging fruit’. Nat Rev Drug Discov. 2018;17:197–223. doi:10.1038/nrd.2017.227.
- Kaplon H, Reichert JM. Antibodies to watch in 2019. MAbs. 2019;11:219–38. doi:10.1080/19420862.2018.1556465.
- Martinez LJ. FDA overview: an overview of the drug approval process. Res Initiat Treat Action. 2002;8:11–17.
- Edman P. A method for the determination of amino acid sequence in peptides. Arch Biochem. 1949;22:475.
- Henzel W, Watanabe C, Stults J. Protein identification: the origins of peptide mass fingerprinting. J Am Soc Mass Spectrom. 2003;14:931–42. doi:10.1016/S1044-0305(03)00214-9.
- Berg JM, Tymoczko JL, Stryer L. Biochemistry 5th. New York (NY): W H Freeman; 2002. Section 4.2, Amino Acid Sequences Can Be Determined by Automated Edman Degradation.
- Bondarenko PV, Second TP, Zabrouskov V, Makarov AA, Zhang Z. Mass measurement and top-down HPLC/MS analysis of intact monoclonal antibodies on a hybrid linear quadrupole ion trap–orbitrap mass spectrometer. J Am Soc Mass Spectrom. 2009;20:1415–24. doi:10.1016/j.jasms.2009.03.020.
- Bourell JH, Clauser KP, Kelley R, Carter P, Stults JT. Electrospray ionization mass spectrometry of recombinantly engineered antibody fragments. Anal Chem. 1994;66:2088–95. doi:10.1021/ac00085a026.
- Zhang W, Marzilli LA, Rouse JC, Czupryn MJ. Complete disulfide bond assignment of a recombinant immunoglobulin G4 monoclonal antibody. Anal Biochem. 2002;311:1–9.
- Kroon DJ, Freedy J, Burinsky DJ, Sharma B. Rapid profiling of carbohydrate glycoforms in monoclonal antibodies using MALDI/TOF mass spectrometry. J Pharm Biomed Anal. 1995;13:1049–54.
- Gibson BW, Biemann K. Strategy for the mass spectrometric verification and correction of the primary structures of proteins deduced from their DNA sequences. Proc Natl Acad Sci USA. 1984;81:1956–60. doi:10.1073/pnas.81.7.1956.
- Chelius D, Rehder DS, Bondarenko PV. Identification and characterization of deamidation sites in the conserved regions of human immunoglobulin gamma antibodies. Anal Chem. 2005;77:6004–11. doi:10.1021/ac050672d.
- Kelleher NL. Top-down proteomics. Anal Chem. 2004;76:197A–203A.
- Mao Y, Valeja SG, Rouse JC, Hendrickson CL, Marshall AG. Top-down structure analysis of an intact monoclonal antibody by electron capture dissociation-Fourier transform ion cyclotron resonance-mass spectrometry. Anal Chem. 2013;85:4239–46. doi:10.1021/ac303525n.
- Tsybin YO, Fornelli L, Stoermer C, Luebeck M, Parra J, Nallet S, Wurm FM, Hartmer R. Structural analysis of intact monoclonal antibodies by electron transfer dissociation mass spectrometry. Anal Chem. 2011;83:8919–27. doi:10.1021/ac201293m.
- Fornelli L, Damoc E, Thomas PM, Kelleher NL, Aizikov K, Denisov E, Makarov A, Tsybin YO. Analysis of intact monoclonal antibody IgG1 by electron transfer dissociation orbitrap FTMS. Mol Cell Proteomics. 2012;11:1758–67. doi:10.1074/mcp.M112.019620.
- Barnes CAS, Lim A. Application of mass spectrometry for the structural characterization of recombinant protein pharmaceuticals. Mass Spectrom Rev. 2007;26:370–88. doi:10.1002/mas.20129.
- Ren D, Pipes GD, Liu D, Shih L, Nichols AC, Treuheit MJ, Brems DN, Bondarenko PV. An imporved trpsin digestion method minimizes digestion-induced modifications on proteins. Anal Biochem. 2009;392:12–21. doi:10.1016/j.ab.2009.05.018.
- López-Ferrer D, Petritis K, Lourette NM, Clowers B, Hixson KK, Heibeck T, Prior DC, Paša-Tolić L, Camp DG, Belov ME, et al. Fast on–line digestion system for protein characterization. Anal Chem. 2008;80:8930–36. doi:10.1021/ac800927v.
- Yuan H, Zhou Y, Xia S, Zhang L, Zhang X, Wu Q, Liang Z, Zhang Y. Integrated platform for proteome profiling with combination of microreversed phase based protein and peptide separation via online solvent exchange and protein digestion. Anal Chem. 2012;84:5124–32. doi:10.1021/ac3006796.
- Lu A, Waanders LF, Almeida R, Li G, Allen M, Cox J, Olsen JV, Bonaldi T, Mann M. Nanoelectrospray peptide mapping revisited: composite survey spectra allow high dynamic range protein characterization without LCMS on an orbitrap mass spectrometer. Int J Mass Spectrom. 2007;268:158–67. doi:10.1016/j.ijms.2007.08.007.
- Zhang HM, Kazazic S, Schaub TM, Tipton JD, Emmett MR, Marshall AG. Enhanced digestion efficiency, peptide ionization efficiency, and sequence resolution for protein hydrogen/deuterium exchange monitored by FT-ICR mass spectrometry. Anal Chem. 2008;80:9034–41. doi:10.1021/ac801417d.
- Switzar L, Giera M, Niessen WMA. Protein digestion: an overview of the available techniques and recent developments. J Proteome Res. 2013;12:1067–77. doi:10.1021/pr301201x.
- Poston CN, Higgs RE, You J, Gelfanova V, Hale JE, Knierman MD, Siegel R, Gutierrez JA. A quantitative tool to distinguish isobaric leucine and isoleucine residues for mass spectrometry-based de novo monoclonal antibody sequencing. J Am Soc Mass Spectrom. 2014;25:1228–36. doi:10.1007/s13361-014-0892-1.
- Cravello L, Lascoux D, Forest E. Use of different proteases working in acidic conditions to improve sequence coverage and resolution in hydrogen/deuterium exchange of large proteins. Rapid Commun Mass Spectrom. 2003;17:2387–93. doi:10.1002/rcm.1207.
- Elias JE, Haas W, Faherty BK, Gygi SP. Comparative evaluation of mass spectrometry platforms used in large-scale proteomics investigations. Nat Methods. 2005;2:667–75. doi:10.1038/nmeth785.