
ABSTRACT
Monoclonal antibodies play an increasingly important role for the development of new drugs across multiple therapy areas. The term ‘developability’ encompasses the feasibility of molecules to successfully progress from discovery to development via evaluation of their physicochemical properties. These properties include the tendency for self-interaction and aggregation, thermal stability, colloidal stability, and optimization of their properties through sequence engineering. Selection of the best antibody molecule based on biological function, efficacy, safety, and developability allows for a streamlined and successful CMC phase. An efficient and practical high-throughput developability workflow (100 s-1,000 s of molecules) implemented during early antibody generation and screening is crucial to select the best lead candidates. This involves careful assessment of critical developability parameters, combined with binding affinity and biological properties evaluation using small amounts of purified material (<1 mg), as well as an efficient data management and database system. Herein, a panel of 152 various human or humanized monoclonal antibodies was analyzed in biophysical property assays. Correlations between assays for different sets of properties were established. We demonstrated in two case studies that physicochemical properties and key assay endpoints correlate with key downstream process parameters. The workflow allows the elimination of antibodies with suboptimal properties and a rank ordering of molecules for further evaluation early in the candidate selection process. This enables any further engineering for problematic sequence attributes without affecting program timelines.
Introduction
Therapeutic monoclonal antibodies (mAbs) represent one of the fastest-growing segments in the pharmaceutical market. Antibody therapeutics enter clinical studies, and are being approved, in record numbers; the commercial pipeline is robust, with over 570 antibody therapeutics at various phases of clinical trials, including 62 in late-stage clinical studies and 13 antibody therapeutics approved in the European Union or United States during 2018.Citation1 Currently, there are more than eighty (80) monoclonal antibodies approved by the US Food and Drug Administration. Antibodies are used in a broad range of disease areas, including cancer, autoimmune diseases, inflammation, neurological, cardiovascular, and infectious diseases. It is anticipated that mAbs will remain an important part of human health improvement for years to come.Citation2
Approximately nine out of every 10 drug candidates fail to win approval, i.e.,, 90% of drug candidates will fail during clinical development; possibly over 99% if preclinical stages of development are also included.Citation3 This failure rate has huge implications for the overall cost of drug development. The underlying contributing reasons behind drug failure during development remain poorly understood. In 2004, Kola and LandisCitation4 published analyses that have shed some light on the subject, suggesting a collection of different causes behind drug attrition, which include insufficient efficacy, suboptimal bioavailability and pharmacology, safety and toxicology concerns, or stability and quality issues with the drug product.
Although mAbs are typically selected for high affinity, potency, specificity, Fc-modulated functionality, and optimal pharmacokinetics, too often lead antibody molecules have unsuitable biophysical properties. These suboptimal characteristics can make it very difficult to streamline and accelerate the manufacturing process because investments must be made in non-platform downstream processes to move the molecule forward into development. In addition, preferred routes of administration might not be achievable if the molecules cannot sustain high concentration because of increased aggregation or viscosity. These factors consequently lead to substantial challenges in developing a drug product for subcutaneous injection.Citation5,Citation6 This is due in part to the fact that the majority of drug candidates are initially screened and selected based on affinity and functionality. Less attention is paid to other biophysical properties, such as expression yield, protein aggregation, chemical stability (e.g., susceptibility to degradation through oxidation, deamidation), thermal stability, ability to be formulated and stored at the desired concentration, and risk of immunogenicity, which should form part of a comprehensive developability risk assessment. Problems typically involve poor expression, poor colloidal, or solubility properties, cross-reactivity to unwanted protein species, or poor pharmacokinetic profiles. Therefore, the concept of developability used to define the suitability of a candidate to be developed as a successful drug, and the ability to screen for optimal behavior at the early stages of antibody candidate discovery are crucial. In the past decade, numerous reports have examined the developability of biologics, in particular mAbs.Citation7–Citation10
To achieve maximum impact during the early stages of the antibody molecule generation and selection process (often referred to as the screening funnel), methodologies must involve the use of in silico analysis (computational methods) and leverage the use of high throughput (HT) assays and tools. HT assays used for antibody molecule characterization in discovery are often similar to assays used in the pre-formulation and formulation process development space. These assays are constantly assessed and optimized for their suitability as predictive tools for key downstream parameters, such as storage stability, viral inactivation, chromatographic yield, ultrafiltration/diafiltration (UF/DF) performance, stability in syringe, and potential in high-concentration preparations for subcutaneous injection.
A variety of in silico predictive tools have been developed in recent years to predict aggregation risk in biologic molecules. Such tools have utilized several approaches, including semi-empirical methodologies to link the experimental observation of aggregation to protein physicochemical properties, such as prediction of aggregation by the SAP score.Citation11–Citation16 Similarly, the identification of chemical modifications in complementarity-determining regions (CDRs) of therapeutic antibodies is a critical activity early in the discovery and development process. Knowledge around protein motifs in the antibody CDR, which increase the risk of occurrence of specific post-translational modifications (PTMs), is being acquired.Citation17,Citation18 While potential chemical liabilities can be identified based on the antibody primary sequence, these require experimental confirmation to determine the degree of actual modification. Machine learning methods (e.g., random forest) to predict the hydrophobic chromatography (HIC) retention time of a given antibody sequence were applied to develop predictive models.Citation19,Citation20 Progress is being made toward establishing correlations between biophysical assays and computationally predictive behavior for downstream and manufacturing endpoints using data gathered for a large number of antibody molecules. In 2017, Jain et al. reported the production and characterization using a dozen biophysical property assays of a panel of 137 monoclonal antibodies currently in advanced clinical stages.Citation9 The authors formatted the mAbs as human IgG1/kappa and were able to define clusters of antibodies based on their biophysical properties, which established that clinical success is associated with fewer developability flags.
Collectively, across the biotechnology and pharmaceutical industries, machine learning algorithms are in development and could be useful for initial sequence assessment and prioritization. Very large numbers of sequences (10,000–100,000 s) and associated analytical datasets are likely needed to arrive at models that could reduce the amount of hands-on experimentation. High-throughput empirical testing of molecules during the discovery stage remains crucial to ensure only the best molecules are progressed through the optimization and selection process.
Here, we describe an integrated, HT developability and data management workflow, which was implemented at the start of antibody lead discovery campaign in the early stages of candidate screening and selection in the discovery space. The workflow accelerates candidate selection, reduces risks in the development, and ensures that only robust antibody molecules are progressed to development activities. For this study, we selected and evaluated a panel of 152 human or humanized mAbs (as IgG1 or IgG4 isotypes and kappa or lambda light chains) against different antigens representing multiple human germline V-genes (human kappa light chain subgroups I, III, and IV, human lambda subgroup I, and human heavy chain subgroups I and III).Citation21 CDR sequence attributes containing various potential chemical liabilities (e.g., deamidation, isomerization, oxidation sites), charged or hydrophobic surface patches, various lengths of CDR (VH CDR3 ranging from 7 to 17 amino acids), and isoelectric points (pI) ranging from 6.3 to 9.0 were represented in the panel. The antibodies originated from immunization in BALB/c or transgenic human mice (followed by humanization and/or reformatting to selected human IgG1 or IgG4 backbone), human B cell derived from human donors, or synthetic human libraries.Citation22,Citation23
For reference, shows the correspondence of assays used during HT developability assessment and well-established analytical assays that are part of a formal manufacturability assessment. There are several degradation pathways that could alter the physicochemical properties and overall profile of an antibody candidate. Early assessment of critical molecule and sequence attributes, such as colloidal properties (aggregation, self-interaction, hydrophobicity, viscosity), fragmentation/clipping, PTMs, charge (pI), thermostability, and crucial biological attributes (affinity, functional activity, specificity, stability in plasma, half-life in humans), is critical for the selection of molecules with enhanced drugability. This work requires the use of HT assays since it can be performed using small amounts of material (100 μgs) on a large number of candidate sequences (100 s-1,000 s).
Table 1. Critical molecule properties and analytical assays used during sequence selection and developability assessment
To help prioritize future drug candidates for development, we sought to provide information about molecule properties and correlations between assays. We present correlations between various HT biophysical assays and with key downstream parameters. While the purpose and scope of this work was not to generate and optimize quantitative structure–property relationship (QSPR) and quantitative structure–activity relationship (QSAR) model predictions, or machine learning techniques to create predictive models with correlation to experimental data as was recently reported by Kizhedath et al.,Citation57 we investigated possible sequence-based in silico predictive approaches for HIC as it is a priority 1 assay and surface properties were hypothesized to contribute.
Case studies for a selected number of molecules that showed pronounced suboptimal features in our developability screening workflow are presented to highlight the predictive nature of these assays for manufacturability endpoints, such as long-term stability in formulation buffer and viscosity at high protein concentrations. While the HT biophysical analyses presented here show meaningful correlations between properties, a larger and more diverse dataset than what is presented here will be needed to make solid correlation estimates between these assays and downstream process parameters and endpoints.Citation58–Citation64
Results
Antibody sequence selection workflow and drug discovery process
MAbs are derived from multiple sources, such as immunization of rodents followed by humanization, human transgenic mouse platforms expressing human antibodies, or synthetic human antibody libraries displayed on the surface of yeast, mammalian cells, or phage. Antibodies can also be isolated from immunized mouse B cells or human B cells isolated from human patients (). The different origins could potentially lead to differences in germline sequence usage, functional diversity (epitope, specificity), and biophysical properties that need to be assessed and tracked during screening, optimization, and characterization. Antibody sequences are typically analyzed in silico to evaluate sequence diversity, functional cladding, and sequence liabilities (e.g., pI, PTMs, charged, or hydrophobic patches in the CDR). When these occur, PTMs may affect biological activity, lead to immunogenic responses, or affect stability and quality of the material, representing initial product critical quality attributes (pCQAs) revealed during the discovery phase and confirmed and characterized during the subsequent development phases. These attributes would result in substantially increased manufacturing and analytical characterization support, causing delays in progress toward clinical studies.
Figure 1. Drug discovery, sequence selection, and developability workflow
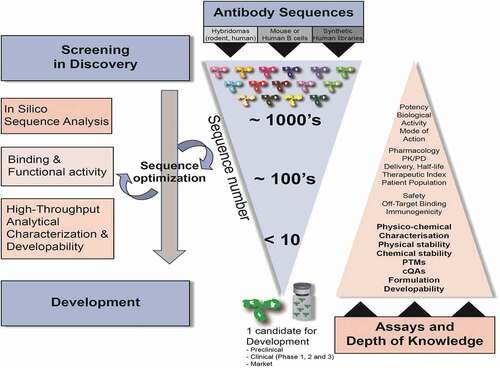
The integrated, streamlined screening, and developability workflow employed in discovery, and described herein, can typically be completed within a few weeks. At early stages of evaluation, the aim is to screen many antibody sequences (100–1,000 s) expressed transiently in Chinese hamster ovary cells (CHO-Expi from Life Technologies), purified in small amounts (100 s μgs – ~1 mg) via an automated protein A chromatography platform (Tecan Freedom Evo 150), and characterized by several assays. HT characterization involves a defined set of functional tests, including binding by surface plasmon resonance (SPR) methods and functional assays. The biophysical and analytical characterization phase is initiated as soon as binding and activity data of candidates meet the minimum requirements defined in the target candidate profile. The analytical characterization assays we selected are deemed to be predictive of downstream endpoints.
In , key stages of antibody drug discovery are shown with the number of candidates tested during the screening and selection process. To ensure that a wide spectrum of candidates is evaluated, antibody sequence, functional epitope diversity, and biophysical attributes are considered during ranking. Circular arrows indicate that the analytical characterization is an iterative process to be repeated during sequence engineering (e.g., mutagenesis to remove a PTM or disruption a hydrophobic or charged patch that could lead to low solubility and/or high aggregation). Newly engineered molecules are reanalyzed with the same analytical characterization scheme to ensure improved biophysical properties and correction of the previously identified suboptimal feature(s). This selection process is iterated until a reduced number of sequences (typically <10) is selected in discovery, leading to the initiation of stable cell line development in the Bioprocess area. Each candidate receives a developability risk label based on the following parameters: 1) affinity to the target protein and potential toxicology species (e.g., non-human primate (NHP) species) using SPR; 2) functional activity/potency in various in vitro functional assays with engineered cell lines or primary assays; 3) binding specificity (absence of nonspecific binding and binding to homologous proteins that present sequence or structural homologies with the target of interest); 4) sequence and epitope diversity (in silico assessment and experimental binning experiments); 5) assessment of colloidal properties (aggregation, protein-protein self-interaction); 6) hydrophobicity and solubility assessment; 7) thermostability and conformational stability; 8) chemical stability via assessment of sequence liabilities (modification of solvent-exposed residues) in CDR regions (e.g., deamidation, isomerization, oxidation, N-glycosylation sites); 9) susceptibility to proteolysis, fragmentation, and stability in platform formulation buffers (unstressed and stressed conditions such as increased temperature, frozen storage, freeze/thaw cycles, pH jump); 10) pI assessment (calculated and experimental); 11) titer in transient CHO expression [low (<20 mg/L) vs ballpark levels >100 mg/L]; and 12) purification experience (material loss during purification, filtration, concentration, visual observation of turbidity, flocculence upon buffer exchange or dialysis).
High-throughput developability assessment of a panel of 152 monoclonal antibodies
A selected panel of human or humanized IgG1/kappa, IgG1/lambda, or IgG4 S228P/kappa antibodies obtained from various origins was expressed transiently in small (8 ml) scale in a CHO-Expi expression system. Antibodies were purified using a single purification step (protein A chromatography), buffer exchanged or dialyzed in sodium acetate pH 5.5 buffer and subjected to HT physicochemical characterization assessment, typically carried out using 50–100 ug of purified material. These assays are prioritized. A higher priority (priority 1) is given to assays that identify unacceptable properties. Priority 1 assays include ultra-high pressure size-exclusion chromatography (UP-SEC) (aggregation), CE-SDS (purity, clipping), differential scanning fluorimetry (DSF)/nano-DSF (melting temperature and temperature of aggregation onset (Tagg)), HIC (increased hydrophobicity and “stickiness” to matrix or column), and intact mass (IM) by mass spectrometry (sequence confirmation). Priority 2 assays include analysis by reverse phase (HP-RP), affinity-capture self-interaction nanoparticle spectroscopy (AC-SINS), low pH hold (exposure to low pH ~3.5 UP-SEC reading), and capillary isoelectric focusing (cIEF). Affinity determination of the molecules is carried out throughout the screening phase so that only molecules with the desired binding and functional activity are assessed for their biophysical properties.
Critical molecule properties, analytical assays during sequence selection and developability assessment
A number of biophysical assays, such as size-exclusion chromatography (UP-SEC), AC-SINS, HIC, thermostability (Tm/Tagg) are relatively straightforward to implement, high-throughput, and extraordinarily robust, allowing one to gain insights into overall physicochemical properties, colloidal stability, and thermostability of mAbs. UP-SEC is the standard method for protein aggregate analysis. Due to the difficulty in producing large amounts of purified materials early in the candidate selection process, it becomes challenging to truly capture the long-term stability properties of a mAb, particularly the solubility and viscosity behavior upon storage at high concentrations. To this point, methods with the greatest impact are in silico predictionsCitation11,Citation12,Citation58,Citation60,Citation61 and HT surrogate analytical assays, as these approaches are predictive of aggregation and tendency for self-interaction, which can be rapidly executed requiring very small amounts of protein. AC-SINS is capable of screening large panels of antibodies for their propensity to self-associate.Citation34–Citation36 AC-SINS is based on concentrating mAbs from dilute solutions around gold nanoparticles pre-coated with polyclonal capture (e.g., anti-Fc) antibodies. Interactions between immobilized mAbs lead to reduced inter-particle distances and increased plasmon wavelengths (wavelengths of maximum absorbance), which can be readily measured by optical means in a high-throughput, 384-well format. To be viable as a potential candidate, proteins must remain stable during long-term storage, shipping/shear agitation, in-use handling, freeze-thaw, temperature excursion, and must meet the minimal target product profile defined for the drug. Typically, the solution stability of at least 2 years at 5 °C storage is desired.Citation55
Hydrophobicity is important because it may relate to self-interaction, aggregation propensity, and protein stability, making it useful to predict potential downstream risks. HIC is able to separate protein species based on their hydrophobicity under non-denaturing conditions (unlike HP-RP, which requires harsh denaturing conditions, such as solvents and typically high temperature (~70°C-80°C)).Citation62 In addition, increased retention on HIC columns and high hydrophobicity of certain CDRs have been linked to off-target binding and poor pharmacokinetic (PK) properties.Citation52
The thermostability of antibodies also plays a major role in eliminating molecules with suboptimal conformation from further evaluation or protein engineering. Methods such as DSF, nano-DSF (unlike DSF, this method is not dependent on the interaction between the protein and fluorescent dye), or differential scanning calorimetry, which measures onset (Tonset) and midpoint (Tm) temperatures of protein thermal unfolding transitions, can provide a rapid means to rank candidates. The putative connection between protein conformational stability assessed by Tm, Tagg, and Tonset measurements are thought to be potentially predictive or could be an indication of long-term stability, which can also be experimentally approached by measuring aggregation rates at high temperature (40°C) to predict stability at 5°C and 25°C under long-term conditions.Citation33
Data management workflow for high-throughput antibody selection and optimization
Antibody discovery at Merck is supported by various technologies (hybridoma, B-cell, yeast, and phage display) that lead to sequence diversity and varying properties (affinity, potency, biophysical properties) that need to be tracked throughout the discovery and selection process. An integrated HT data management system is a key component, as it allows tracking of all data along the discovery process and facilitates the identification of the most promising antibody molecules. illustrates the integrated data management system we adopted internally to capture and leverage large volumes of complex data (e.g., molecular characteristics, high-throughput screening, preclinical attributes) to enable data-driven antibody candidate optimization and selection.
Figure 2. High-Throughput Analytical Characterization, Developability, and Data Management System
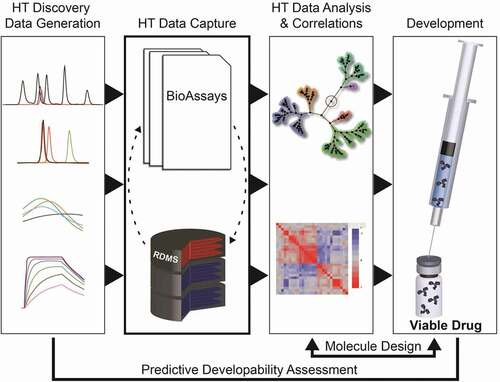
A streamlined HT analytical characterization workflow generates a large amount of associated physicochemical characterization data that must be recorded, processed, managed, and analyzed. To overcome this challenge, we generated a data management and visualization workflow that enables the quick automated upload of HT analytical data. This data management system was developed in house as a combination of an internal relational database system and off-the shelf solutions, such as Perkin Elmer Bioassay (https://www.perkinelmer.com/product/e-notebook-enotebook)Citation65 for HT data capture and TIBCO Spotfire for data visualization (https://www.tibco.com/).Citation66 Data is easily managed in a common interface that enables the use of TIBCO Spotfire’s full functionality for managing acquired datasets, identifying relationships, isolating outliers, and spotting trends and patterns. Integration with TIBCO Spotfire helps streamline the candidate selection workflows and drive better decision making when screening through a large dataset associated to many candidate molecules.
All types of assay information, including expression and purification data, analytical assays (UP-SEC, HP-RP, Tm/Tagg, CE-SDS, and Intact Mass), and functional read-outs (binding and functional assay data) can be exported using this workflow. In Spotfire, the data can be viewed together for ranking of molecules, but it also enables a deep dive into the data for a given sample of interest (). These tables are then used to rank candidate molecules against each other to enable the selection of final sequences for further investigation.
High-throughput developability assessment of a panel of 152 monoclonal antibodies
The relevant analytical characterization data acquired for all 152 molecules was plotted using the JMP software suite (https://www.jmp.com)Citation67 and compiled in of the supplemental data section. Antibodies were numbered as mAb1-152 in the supplemental data section and throughout the text and figures. The dataset is composed of 72 IgG1 and 80 IgG4 antibody molecules from different mAb generation campaigns.
Distribution plots of the biophysical properties for key analytical assays for the 152 antibodies are shown in . The assays studied include titer measured by Octet using protein A tips, aggregation by UP-SEC, purity by HP-RP and CE-SDS, thermostability, and temperature of aggregation formation onset measured by nano-DSF, hydrophobicity by HIC and UP-SEC, self-interaction by AC-SINS and charge variant analysis by cIEF. Overall, molecules in the tested panel exhibited a wide range of properties. Transient expression levels in CHO-Expi ranged from 10 to 900 mg/L, monomeric antibody peak by UP-SEC from 50% to 99.8%, purity by HP-RP from 35-100%, main antibody peak by CE-SDS from 65-100%, Tonset from 45-66°C, Tm1 from 54-76°C, Tagg from 50-95°C, HIC retention time from 20 to 55 minutes, retention time by UP-SEC from 2.3 to 3.5 minutes, and maximum wavelength absorption (λmax) from 520 to 575 nm by AC-SINS (in acetate pH 5.5 or in phosphate-buffered saline (PBS) 1X pH 7.4 buffers). The percentage of main antibody peak by UP-SEC upon low pH hold also had a wide range from 75-100% main peak and pI ranged from 6.3 to 9.5. Measured parameters and properties, such as pI and Tm/Tagg, are known to be noticeably different between antibodies of the IgG1 and IgG4 backbones. The decreased conformational stability of the human IgG4 subclass compared to IgG1 has been previously described by others.Citation68,Citation69 These differences amongst the 152 antibodies we evaluated will be discussed in later sections and figures.
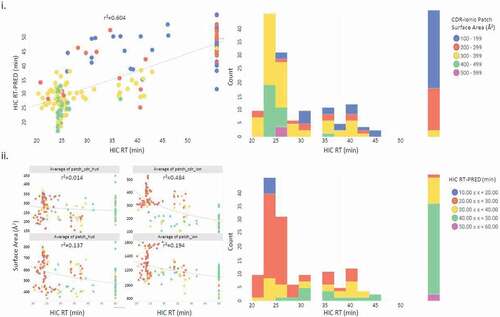
Figure 3. a Distribution plots of physicochemical properties of 152 monoclonal antibodies from multiple biophysical assays. The box and whisker plot to the right of each panel indicates the distribution of the properties which were evaluated. The box runs from the 1 st to the 3rd quartile, with the center line at the median. Whiskers extend to the farthest points from the box not more than 1.5 interquartile ranges from the box. A 95% confidence diamond is given for the mean. The red bracket outside the box marks the shortest regions that includes 50% of the observations. b Correlation clustered colored map of Spearman correlations (ρ). Negative correlations between assays (−1 to 0) are shown in a blue rectangle. Positive correlations (−1 to 0) are shown in a red triangle. c Protein property descriptors and HIC predicted retention times (HIC RT-PRED) vs. HIC RT for the 152 tested sequences. HIC RT expressed in minutes is the x-axis throughout. Antibodies that did not elute were set to the maximum of 50 min. Pearson correlation r2 for HIC RT vs the indicated descriptor is reported on each scatter plot. i) The upper panel plots HIC RT-PRED colored by patch_cdr_ion and its associated binned histogram. ii) The average sum of the ensemble surface area patches for the whole Fab (patch), and CDR (patch_cdr) for each of hydrophobic (hyd) and ionic (ion) on the homology model are indicated and colored by the HIC RT-PRED as derived from the QSPR-4pt model equation as is its associated histogram
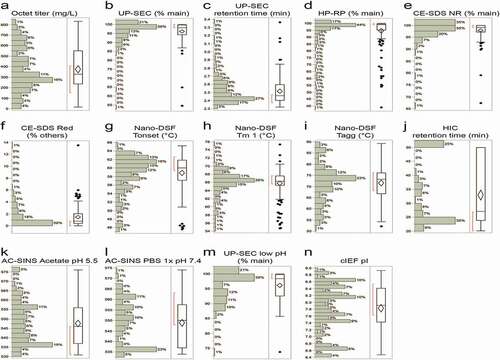
Figure 3. (Continued)
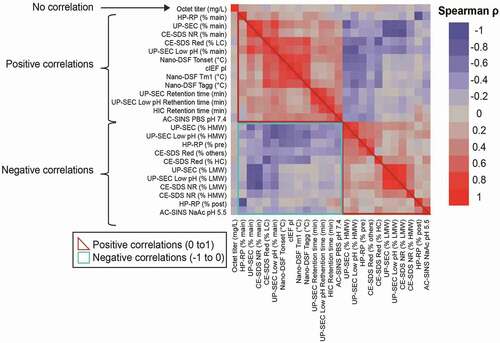
Figure 3. (Continued)
To investigate the relationship between the data obtained from the various analytical assays mentioned previously, assay results were subjected to a multivariate analysis using the JMP statistical analysis software package 13.0.0. Both Pearson and Spearman correlation coefficients were calculated to further understand the type and degree of relationship. The Pearson correlation coefficient is a measure of the linear correlation between two variables, while the Spearman correlation evaluates the monotonic relationship between two continuous or ordinal variables based on the ranked values for each variable rather than the raw data. A correlation heatmap was generated for each assay endpoint (titer, % of main peak by UP-SEC after protein A purification or after low pH stress, UP-SEC RT and HIC RT, Tonset, Tm1, Tagg, pI measured by cIEF, self-interaction by AC-SINS in acetate and PBS 1x, purity by HP-RP, and CE-SDS reduced and non-reduced). These are clustered according to the strength of the correlation and are shown in . Correlation coefficients that approach “1” indicate the presence of a strong positive relationship (red), those that approach “0” suggest weak to lack of correlation, while those that approach “-1” suggest a strong inverse or negative relationship (blue).
The positive correlations (Spearman ρ > 0 in red triangle in ) that were observed can be sub-divided into two categories: 1) positive correlations associated with assays that assess overall sample purity, such as UP-SEC (e.g., % main peak after protein A purification or low pH stress), CE-SDS non-reduced (% main peak) and HP-RP (% main peak), where the % of main peak for each of these assays increase in parallel as expected; and 2) positive correlations for assays that point to different molecule attributes (e.g., retention time on columns after protein A purification (UP-SEC or HIC) or after low pH stress (UP-SEC), charge by cIEF (pI), thermostability properties (Tonset, Tm1, Tagg) and that were not necessarily expected to occur. Negative correlations (Spearman ρ < 0, in blue box in ) were observed between % of main peak and % of high molecular weight (HMW) and low molecular weight (LMW) species by UP-SEC, % of main peak, pre- and post-main peak by HP-RP, % of main species, LMW and HMW by CE-SDS under non-reducing conditions, and % of main species, HC, LC, and other species by CE-SDS under reducing conditions, and λmax by AC-SINS in PBS pH 7.4 acetate pH 5.5 buffer. These negative correlations point to assay read-outs that evaluate diverse molecule properties (clipped forms, aggregation, hydrophobic species, and/or self-interactions) and were not expected to trend in the same direction.
shows some of the assay read-outs with the strongest correlations (i.e., Spearman correlations > 0.50 and p < .001 for each). Of note, several assay read-outs, such as pI and Tonset, RT by UP-SEC after low pH stress and RT by HIC, Tagg and Tm1, Tm1, and Tonset, % of main peak by UP-SEC after low pH stress and Tonset, show ρ > 0.7. A strong correlation (Spearman ρ between 0.54 and 0.76) between pI and higher thermostability (Tonset, Tm1, Tagg) and resistance to the formation of HMW upon low pH stress also emerged. The data also show that antibodies with higher pIs tend to have higher thermostability, with observed Spearman correlation coefficients of 0.50–0.75. Pearson’s correlation coefficients and associated p-values are shown in .
Table 2. Spearman correlations (ρ > 0.5) for selected analytical characterization read-outs with p-values <0.0001. Pearson coefficients and associated p-values are also shown. P-values test null hypothesis that the correlation coefficient = 0
With the goal of producing a model capable of predicting HIC retention times, the calculated 3D homology models were assessed across various calculated surface properties. All antigen-binding fragment (Fab) sequences were modeled, and hydrophobic and ionic surface areas were calculated. In single-variable analysis with respect to HIC retention times, we found the highest degree of correlation with the ensemble average of the total ionic patch surface area proximal to the CDR, which yielded a Pearson coefficient of r2 = 0.483 ().
To further explore the applicability of the surface properties, a partial least squares (PLS) regression model was generated and examined. The 4-point QSPR proved to be the most highly correlated (r2 = 0.604 and leave-one-out cross validation x2 = 0.579). The resulting 4pt-QSPR equation for HIC was:
HICRT-PRED = 42.23687 – 0.02859 * avg_patch_cdr_ion + 0.12656 * avg_patch_cdr_hyd – 0.02909 * avg_patch_hyd
- 0.00949 * avg_patch_ion
Breaking out ionic surface areas into its constituent positive and negative charge areas yielded a slight increase in Pearson correlation up to r2 = 0.614. Indeed, we were able to generate PLS models with r2 values as high as 0.68, but they all seemed to plateau at a similar cross-validation x-square of 0.58. We opted against over-fitting in favor of the simpler model.
Additionally, the equation remained predictive when applied to the independent test set of 106 mAb sequences described by Jain et al.Citation9 (r2 = 0.58).
Applying the equation in a binary classification model using a cut off of 30 min, the equation was able to correctly classify good elutes (≤30 min) with 78% accuracy and poor eluters (>30 min) at 94% accuracy.
Since human IgG1 and IgG4 mAbs are known to have different properties (e.g., thermostability),Citation68,Citation69 we investigated differences between these isotypes beyond what is reported in the literature. Selected analytical characterization endpoints such as UP-SEC (% main), UP-SEC after low pH (% HMW), Tonset measured by nano-DSF, pI measured by cIEF and λmax shift measured by AC-SINS (in acetate pH 5.5) were plotted using the graph builder tool from the JMP software suite (). For each assay, each data point in these plots was color-coded as described in the figure legend. The analysis revealed that IgG4 s harbor overall poorer physicochemical properties than IgG1 s, including increased propensity to aggregate upon purification via protein A chromatography and upon exposure to low pH, lower Tonset and increased tendency for self-interaction, and lower pIs (-).
Figure 4. Distribution plots of selected physicochemical properties for panel 152 monoclonal antibodies segregated in IgG1 s and IgG4 s. a-% of main peak by UP-SEC after protein A purification b- % of main peak by UP-SEC after low pH stress, c- Tonset by nano DSF, λmax shift by AC-SINS in acetate pH 5.5, e- pI by cIEF. Color of the dots in Figure 4 a-e indicates different molecules properties: green color indicates % of mean peak by UP-SEC >95%, Tonset >65°C, λmax by AC-SINS <540 nm, (pI>7.5) f- dendrogram of properties for mAb panel segregated by isotype (IgG1 s and IgG4 s) g- Dendrogram highlighting three mAb clusters (Cluster 1, 2, and 3). 100% of IgG1s are found in cluster 3, while IgG4 s are found in clusters 1 and 2
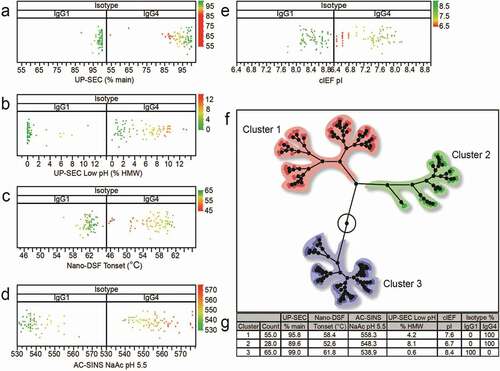
In more detail, the majority of human IgG1 s exhibit <2% HMW formation, while human IgG4 s exhibit a bell curve distribution, with the bulk showing 2-10% HMW (). This trend, seen as HWM formation upon a single protein A purification, is similar after low pH stress treatment (). The data suggests higher thermostability and resistance to aggregation for IgG1 s, with >90% of the mAbs having a Tm onset of 60°C and up, while IgG4 s have lower Tm onsets spanning 46–62°C (). Further supporting the trend, analysis by AC-SINS in acetate pH 5.5 shows that λmax of IgG1 s is between 530 and 550 nm for 92% of the mAbs and 540–575 nm for close to 100% of IgG4 s, suggesting a higher tendency for self-interaction for IgG4 ().
hile titer did not show a significant correlation with other assays, it is interesting to note that, for only 6% of the molecules, the highest titers trended with several assays, such as Tonset/Tm/Tagg, RT on UP-SEC and HIC columns, λmax by AC-SINS, and lower HMW formation upon low pH stress. For a greater percentage of molecules (>20%), higher titers in transient CHO expression systems (>200 mg/L) only trended with thermostability endpoints such higher Tonset (>60°C), Tm (>66°C), and Tagg (>70°C). Titers have previously been reported to correlate with overall thermostability of molecules.Citation70,Citation71 While expression levels in transient transfection in CHO cells and in the final selected stable CHO clone will likely vary, it is well accepted that titers by transient transfection might provide useful information regarding the overall molecule sequence-specific and biophysical traits, such as overall colloidal properties, and susceptibility to undesirable PTMs (e.g., clipping).Citation70,Citation71 Analysis of a greater number of mAbs having higher diversity in primary sequence and biophysical attributes and closer assessment of the impact of different codon optimization strategies will likely help to refine these correlations.
To further investigate the hierarchical relationship between the various assay read-outs, the data was plotted in a dendrogram (). The antibody panel segregated in three clusters (Cluster 1, 2, and 3). Cluster 1 contained 55% of the mAbs, while 28% are found in Cluster 2 and 65% in Cluster 3. Cluster 3 (IgG1 s) shows better overall properties compared with Cluster 1 and Cluster 2 (IgG4 s). The properties include higher % of main peak by UP-SEC upon protein A purification and low pH stress, higher Tonset, lower λmax by AC-SINS in acetate pH 5.5, and higher pI, as mentioned previously.
We then further examined correlations between assays after segregating the data for the IgG1 s and the IgG4 s. Significant correlations with Spearman coefficient greater than 0.5 emerged and are shown in . Correlations with Spearman coefficients >0.5 and low p-values (<0.001) were discovered between 19 assay read-outs for IgG4 s, but only 6 assay read-outs for IgG1 s. The most notable correlations with Spearman coefficients >0.70 for the IgG4 s we found were between AC-SINS in PBS pH 7.4 and Tagg, % main peak by SEC after low pH and % main peak by SEC after protein A purification, AC-SINS in PBS pH 7.4 and Tonset, Tagg and Tm1, Tagg and Tonset, and pI and AC-SINS in PBS pH 7.4. Correlations with Spearman ρ between 0.50 and 0.70 that were not anticipated emerged for IgG4 s. These correlations included an association between pI by cIEF and Tagg, % of main peak by UP-SEC after low pH stress and Tm1, AC-SINS in PBS pH 7.4 and in acetate pH 5.5, AC-SINS in acetate and Tonset and other correlations shown in . We noted that pI shows a strong correlation (ρ > 0.5) with Tm1, Tagg, and AC-SINS (PBS pH 7.4) for IgG4 s but not for IgG1 s, which we hypothesize could be due to IgG4 s having lower pIs than IgG1 s and higher pIs being associated with overall better physicochemical properties.
Table 3. Spearman correlations (ρ > 0.5) for selected analytical characterization read-outs with p-values <0.0001 separated by isotype (IgG1 and IgG4). Pearson coefficients and associated p-values are also shown. P-values test null hypothesis that the correlation coefficient = 0
For IgG1 s, fewer correlations with p values > .5 were observed, as compared with IgG4 s, but a few strong correlations emerged (ρ between 0.62 and 0.96). The data show strong correlations (ρ > 0.8) between RT by UP-SEC after protein A purification and low pH stress, Tm1, and Tonset, RT by HIC and RT by SEC after protein A purification, and between RT by HIC and RT by SEC after low pH treatment. All Spearman and Pearson correlations associated with the entire mAb panel irrespective of their isotypes are shown in supplemental . All Spearman and Pearson correlations for IgG1 and IgG4 are presented in supplemental and , respectively.
Table 4. Experimental and predicted HIC retention times for selected mAbs. Included are the 4 contributing properties which compose the 4-Pt QSPR equation resulting in the predicted retention times. r2 values for each column vs. HIC RT are displayed in the final row
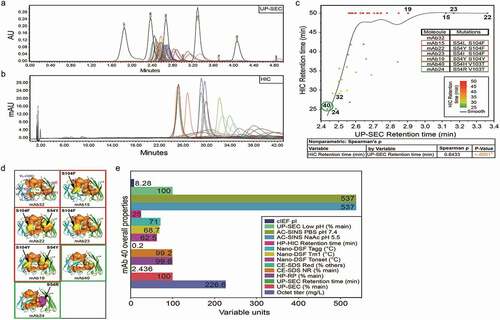
shows a comparative HT analysis of a subset of human mAbs of the IgG1 and lambda light chain subclass (mAbs 12–58). Having undergone affinity maturation, these antibodies bind the same target, but exhibit different affinity, functional activity, and are highly divergent in their CDR sequences. The variants with improved affinities had mutations at position 54 in VH-CDR2 and at position 103 and 104 in VH-CDR3. lists selected affinity-matured variants that showed a 2-15-fold increase in affinity relative to the original antibody (mAb32) and the corresponding mutations. also shows the UP-SEC profile of these molecules and the chromatograms overlaid with the molecular weight markers (Waters BEH200 SEC protein standard mix). These antibodies exhibit various retention times and several migrate with a higher retention time, indicative of nonspecific interactions with the UP-SEC resin, possibly a result of exposed hydrophobic amino acid substitutions introduced during affinity maturation. Molecules with an increased number of hydrophilic substitutions on the CDR surface (mAb40 and mAb24) exhibit a comparable RT by UP-SEC and HIC relative to mAb32, while those containing more hydrophobic substitutions show a shifted retention by UP-SEC and stronger binding and retention to the UP-SEC and HIC columns (mAb15, mAb22, mAb23, and mAb19) ( and ). To date, details of the relationship between “stickiness” of molecules to HIC and UP-SEC columns has not been widely reported.
Figure 5. UP-SEC, HIC, and molecular surface analysis of a family of affinity matured antibodies. a- UP-SEC, b- HIC, c- Plot of retention times (RT) by UP-SEC vs. HIC,d- Surface patch analysis using homology models of affinity matured mutants (mAb32,15,22,23,19,40, and 24) e- Overall biophysical properties (UP-SEC, HP-RP, CE-SDS, Tm/Tagg, HIC, SINS, low pH hold UP-SEC, cIEF) for mAb 40
Based on this experimental data, these 4 variants were the most hydrophobic molecules, consistent with the increase in hydrophobic substitution on the surface of the molecule. Measuring the hydrophobicity of a molecule by HIC chromatography has been reported to be potentially predictive of depressed colloidal properties, inability to achieve high concentrations, and a possible indication of increased risk of nonspecific and off-target binding, which could lead to poor PK and unexpected toxicity.Citation29,Citation30
To further explain the effects of these mutations on the antibody surface, we examined the homology models for the wildtype (WT) (mAb32) and the double mutants (mAb15, mAb22, mAb23, mAb19, mAb40, and mAb24). Since mAb15, mAb22, mAb23, and mAb19 introduce an additional hydrophobic patch (yellow) in close spatial proximity to an existing hydrophobic patch (brown) present in the WT, we hypothesized that the increase in patch size was the likely cause of the increased UP-SEC and HIC retention times for these molecules (). To support this hypothesis, we initially examined simple homology models (data not shown). However, no clear relationship between hydrophobic patch size and retention time could be observed. In fact, the highest correlation with this subset of mAbs was with the total size of the negatively charged patch surface area proximal to the CDR (patch_cdr_neg) (r2 = 0.903). This correlation proved to be spurious when ensembles for this subset were examined (r2 = 0.010). This precipitous drop underscores the need to avoid using single static models to calculate properties for dynamic systems.
For the selected subset of mAbs, the use of ensemble averages yielded a maximum correlation with the ionic patch surface area (patch_ion) (r2 = 0.213) (). This ensemble-based correlation increased significantly when both hydrophobic and ionic surface patch size was considered through the use of the derived 4pt-QSPR equation (r2 = 0.793). The high degree of predictivity suggests that retention times are due to multiple factors, including surface hydrophobicity and ionic properties. Complete values for all mAbs are available in supplemental Table 5. Among the affinity-matured versions, mAb40 is the preferred variant from an affinity and potency standpoint (data not shown), as well as having the lowest predicted HIC retention time. It has a 15-fold affinity increase relative to WT, an optimal pI of 8.24, and exhibits the best profile in all analytical assays that inform on colloidal properties, such as aggregation level after protein A purification and low pH hold, Tm and Tagg by nano-DSF, wavelength of maximum absorbance by AC-SINS, and retention time to UP-SEC and HIC columns ().
Case study 1: mAb A (humanized IgG4/kappa) and its engineered variants
MAb A is a hinge-stabilized (S228P) IgG4 and kappa subtype. The parental antibody, derived from BALB/c mouse immunization, exhibited high sequence homology to human heavy chain germline V-gene subgroup III and human kappa light chain germline V-genes subgroups III and IV, which served as the framework sequences for humanization. Two humanized variable heavy (VH) chain variants (VH1 and VH2) and four humanized variable light (VL) chain variants (VL1 and VL2 based on human kappa subgroup IV; VL3 and VL4 based on human kappa subgroup III) were paired in all combinations. Multiple mouse/human chimeric (mAb75-77) and humanized variants (mAb78-111) were also designed to address a solvent-exposed methionine in VH-CDR2 at position 64 predicted to oxidize (mAb75-111). A total of 36 antibodies was evaluated side by side, including the mouse parental and methionine corrected variants, in biophysical assays and binding by SPR to both human and non-human (NHP) target. Molecules substituted with leucine (M64 L) and valine (M64 V) to correct the predicted Met oxidation did not affect SPR binding attributes and had no measurable or significant impact to biophysical characteristics. All humanized variants had low-calculated pIs (range 6.4–6.7) and exhibited a consistent, yet acceptable, loss in binding to target antigen (2–3 fold) relative to the mouse/human chimera. Affinity of all humanized variants to target antigen was similar (data not shown).
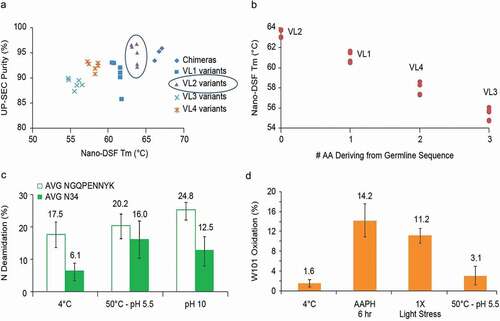
Biophysical attributes correlated with specific VL germline gene usage, whereas usage of humanized VH design had little or no impact on the properties. Higher Tm/Tagg and antibody purity by UP-SEC correlated to the VL chains (). Since little fragmentation was observed, losses in UP-SEC purity were presumed to be due to HMW aggregation. Sequence analysis revealed that humanized variants clustered by VL, and the order of preference based on biophysical properties is chimera (mouse VL) ~ VL2 > VL1 > VL4 > VL3, where the original chimera and VL2 variants had the highest Tm and purity by UP-SEC. Moreover, M64 V and M64 L substitutions introduced in VH1 and VH2 had no effect on % of monomeric peak by UP-SEC or Tm. Additionally, as the number of mouse parental back mutations increased, a concomitant drop of 2-3°C in Tm can be observed. shows the impact on Tm for the various humanized VL variants subgroup (VL1-VL4). The group of VL2 variants, which differs by 1 amino acid in the framework regions to the human kappa subgroup IV germline sequence, had the best Tm values and UP-SEC purities relative to other VL variants having a greater number of mouse residues. Taking into consideration Tm, purity by UP-SEC, and sequence identity to the nearest germline, humanized mAb A variants were ranked in the following order VH1 > VH2 and VL2 > VL1> VL4 > VL3.
Figure 6. Case Study mAb A and humanized variants
Additional testing of the VH1/VL2, VH1 M56 V/VL2, and VH1 M56 L/VL2 variants confirmed desired activity and functional characteristics (data not shown). The two Met56 engineered candidates were selected for further developability analysis, requiring a large amount of material and the standard platform purification approach used in downstream development.
Antibody purified by Protein A affinity is held for 1 hour at pH 3.5, then pH adjusted to pH 7 prior to an anion exchange chromatography (AEX) clean-up step. White precipitate formed for all molecules during the pH adjustment step leading to >20% protein loss and a 2% increase in soluble aggregation after low pH hold to pH 7.0 adjustment (data not shown). The variants were indistinguishable in terms of biophysical and physicochemical properties (monomer purity by UP-SEC after purification steps, after 5 freeze/thaw cycles and purity by HPLC-RP, CE-SDS, pI, charge variants distribution by cIEF) (data not shown). When subjected to forced degradation studies, additional modifications were identified at N34 in VL CDR1 and W101 in VH CDR3. Both molecules deamidated at N34 up to an average of 12.5% at pH 10 (25°C) and 16.0% at pH 5.5 (50°C). Since these two variants differed by one amino acid in the VH CDR2 and had similar deamidation levels, it was believed that the sequence difference had no impact on VL CDR1 N34 deamidation, and, therefore, the measured values were averaged (). Oxidation at W101 was detected at 11.2% and 14.2% under 1X light and 1 M 2,2ʹ-azobis(2-amidinopropane) dihydrochloride (AAPH) stress, respectively, and is reported in .
The precipitation observed during the pH adjustment step presented a developability risk. Along with the low pI attribute (pI~6.3–6.4), it was hypothesized that the low pI of the two variants may be contributing to this phenomenon. Moreover, the low pI presented a potential risk to downstream operations and could affect host cell protein (HCP) and viral protein clearance if interactions to the IEX resins were incurred. To obtain molecules with optimal properties, we created new variants and screened for higher pI (pI ~7.2–7.5). Human kappa light chain germline subgroup I was selected as the new framework for humanization to achieve higher pI without mutating other variable domain residues. These light chains were paired with the VH1 M64 V variant on both human IgG4 and mutated IgG1 backbones for reduced effector function. Four new humanized VL variants (VL5-8) were created on both isotypes. These higher pI variants (mAb107-110 (IgG4) and mAb103-106 (mutated IgG1)) were compared with the lower pI variant VH2 M64 V/VL2 (mAb87 (IgG4) and mAb 102 (mutated IgG1)) by selected biophysical screening assays described in supplemental (UP-SEC, Tonset, Tm, Tagg, CE-SDS, HP-RP, AC-SINS, and cIEF). Molecules with the VL6 and VL8 light chains, despite raising the pI to ~8.84 for the mutated IgG1 and to ~7.45 for the IgG4 molecules, did not show improved properties compared to lower pI variants (mAb87 and mAb102) (). The remainder of the analysis focused on molecules with the preferred IgG4 isotype.
Figure 7. Case study Humanized mAb A incorporating variants with higher isoelectric point
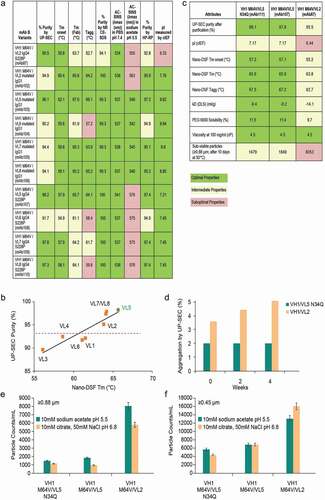
The selected characteristics demonstrated again that the humanized framework used in the variable light chain affected several attributes, such as aggregation, purity by UP-SEC, and Tm/Tonset/Tagg. The resulting preferred light chain from a physicochemical standpoint was VL5 > VL7 = VL8 > VL6. VH1 M64 V/VL5 variant (mAb107) showed an improvement compared to the original lead molecule VH1 M64 V/VL2 (mAb87) in several properties, e.g., higher Tonset (57.9°C vs 55.8°C), higher Tm (65.7°C vs 63.7°C), higher Tagg (64.1°C vs 62.7°C), higher percentage of monomer by UP-SEC (98.2% vs 95.5%), increased purity by HP-RP (97.4% vs 92.8%) and by CE-SDS (100% vs 94.1% of variants retained target antigen binding with the pI ranging from 7.45 to 8.85, as measured by cIEF), as well as an improved pI as measured by cIEF (7.21 vs 6.33). A better profile was not observed for the higher pI VH1 M64 V/VL5 molecules compared to lower pI molecules in the AC-SINS assay in both sodium acetate pH 5.5 and PBS pH 7.4 formulations. Binding to human and NHP targets as well as functional activity in bioassays was similar for the VH1/VL5-8 antibodies. Similar to the finding for VL1-4, a strong correlation between UP-SEC purity and Tm was also observed for this set of improved humanized variants (), further confirming that VL5 was the superior variant. The IgG4 isotype was selected for the preferred variant VL5 (pI 7.2).
To gain additional insights into the predictive nature of the biophysical attributes of molecules detected during the screening phase, selected manufacturability endpoints, such as purification recovery, diffusion interaction parameter (kD) (measures intermolecular weak interactions), viscosity at high concentrations (at 100 mg/ml), solubility to PEG 6000, sub-visible particle formation after 10 days at 50°C, and stability upon 4-week storage at 40°C, were studied. Large-scale production of the pI variants VH1 M64 V/VL5 (mAb107) and VH1 M64 V/VL5 N34Q (mAb111) variants and the lower pI VH1 M64 V/VL2 (mAb87) variant was needed to obtain larger amounts of purified protein.
Antibodies were purified with Protein A followed by 1-hour low pH hold and an AEX step as previously described. Negatively charged species, such as DNA, HCP, and virus, are expected to bind to the resin and the mAb is expected to be in the flow-through. Purified antibodies were dialyzed in 20 mM sodium acetate pH 5.5 buffer for subsequent analysis. Improved thermostability was indeed confirmed in both large-scale and HT small-scale preparations for the higher pI variant (mAb111). The molecule exhibited higher Tonset (57.2°C vs 55.2°C), higher Tm Fab (65.9°C vs 63.8°C), and higher Tagg (67.5°C vs 62.7°C), which correlates with a higher percentage of monomeric antibody by UP-SEC analysis.
A 10% improvement in recovery of the higher pI variants is attributed to reduced binding to the AEX flow through polishing resin (Supplementary ). An HT slurry plate method evaluated the platform fit of the Poros HQ AEX step with respect to yields and aggregates clearance of the three candidates. While the higher pI variants also showed some binding to the AEX resin, they provided a reasonable platform fit (i.e., >70% protein recovery post AEX step), with no need for significant process modification. Of note, improvement was observed in nearly every downstream process development attribute (). Other improvements included higher PEG 6000 solubility (11.4–11.5% vs 9.7%), suggesting a decreased propensity of the folded protein to precipitate, and a less negative kD (−9.2 and −9.4 vs −14.1 ml/g), suggesting a reduction in weak attractive interactions for the higher pI variants.
We conducted short-term accelerated stability studies at 20 mg/ml at 40°C for up to 4 weeks comparing VH1 M64 V/VL5 N34Q (mAb111) and VH1 M64 V/VL2 (mAb87) (). In the VL5 variant (mAb111), UP-SEC aggregation in 20 mM sodium acetate pH 5.5 buffer only increased by roughly 0.6% after one month 40°C storage, whereas the VL2 variant (mAb87) increased by 1.5%. Guava EasyCyte 5HT™ flow cytometer (GFC) was used to gain insight into the formation of subvisible particles in the lower pI (VH1 M64 V/VL2) and higher pI variants (VH1 M64 V/VL5 and VH1 M64 V/VL5 N34Q) of mAb A. One of the distinct advantages of using GFC during the formulation development stage is its ability to perform particle counting (from ≥0.22 microns to ≥10 microns) on an HT platform with less than 100 μL sample volumes.Citation72 illustrates particle counting results, in ≥0.45 μm and ≥0.88 μm ranges, of the lower pI (VH1 M64 V/VL2) and higher pI variants (VH1 M64 V/VL5 and VH1 M64 V/VL5 N34Q) in a formulation matrix (10 mM acetate buffer at pH 5.5 and 10 mM citrate, 50 mM NaCl at pH 6.8) after the formulations were subjected to a thermal stress (10 days at 50°C). Compared to the VH1 M64 V/VL2 variant, the VH1 M64 V/VL5 variants showed considerably less particle counts in both ≥0.45 μm and ≥0.88 μm particle ranges in two different formulations, suggesting VL5 variants (high pI) have less aggregation propensity than that of VL2 variant (low pI) under tested formulation conditions.
Viscosity was found to be similar for both variants in sodium acetate pH 5.5 (~4.3 vs 4.5 cP for VL2 and VL5 variants, respectively, at 100 mg/ml) () and correlated well with the AC-SINS values in both sodium acetate and PBS pH 7.4 obtained during the screening phase (). This supports the finding that the HT biophysical dataset presented in and b was predictive of several manufacturability endpoints shown in , , , and correctly directed the engineering of an optimized antibody molecule with higher pI, improved stability, and better fit to downstream process development platforms. These improved properties will avert multiple risks affecting both process and formulation criteria (, , ).
Case study 2: Humanized mAb B (IgG1/kappa)
Humanized mAb B, an IgG1 and kappa subtype, was selected as a candidate for a drug program for its functional activity, affinity, specificity, and physicochemical and biophysical properties. The parental antibody, derived from BALB/c mouse immunization, exhibited high sequence homology to human heavy chain germline subgroup I and human kappa germline subgroup I, which were selected as the frameworks for humanization. The antibody demonstrated favorable physicochemical properties, such as a pI of 8.85, a Tonset of 73.88°C, high percentage of monomer by UPLC-SEC upon purification, and stability after 5 freeze thaw cycles at −80°C, except for the 15% oxidation under 1x light exposure at W104 in VH-CDR3. This oxidation was associated with a > 6% increase in HMW formation and reduction in binding affinity to the target by SPR (data not shown). Substitutions were made to eliminate this sequence liability and potential pCQA. MAb B (mAb74) with 10 mutations at the W104 site (W104Y (mAb73), W104 V (mAb70), W104 S (mAb64), W104A (mAb69), W104 T (mAb65), W104 L (mAb71), W104 G (mAb68), W104 N (mAb66), W104Q (mAb67), and W104 F (mAb72)) were analyzed in our HT screening workflow ( in supplemental section). For the remainder of this case study, mAb B WT (mAb74) molecule will be referred to as W104 and mAb B W104 mutants as W104X (X containing the mutation introduced at the W104 site).
Generally, the biophysical attributes of the molecules were similar across the WT and all W104X variants (purity measured by UP-SEC- and RP-UPLC >98%; Tonset ~61.8°C–63.9°C, Tm ~68.5°C-69.5°C, cIEF, and CE-SDS profiles) with the key exception of AC-SINS. W104 N, W104, W104Y, W104Q had the lowest λmax by AC-SINS in both PBS pH 7.4 and sodium acetate pH 5.5 showed the best colloidal properties in this assay. W104A, W104 F, W104 V, W104 G showed an increased λmax in both buffers, indicative of possible suboptimal colloidal properties. W104 and W104X variants exhibited slightly different RT on HIC column ( in supplemental section). These differentiated properties seen by AC-SINS were tabulated together with data obtained from additional assays (measurement of Rh by dynamic light scattering (DLS) at 2 mg/ml and binding to the human target by SPR) (). The same W104X variants (W104A, W104 F, W104 V, W104 G) showed both an increase and unusually large hydrodynamic radii (~9-15 nm) in both PBS and sodium acetate buffer outside the normal distribution for antibodies (typically ~5-6 nm). W104 F was the only mutant that maintained a similar affinity to its target (KD ~4.5E-10 M) as W104 (KD ~3E-10 M).
Figure 8. Case study Humanized mAb B: Analytical characterization and homology model
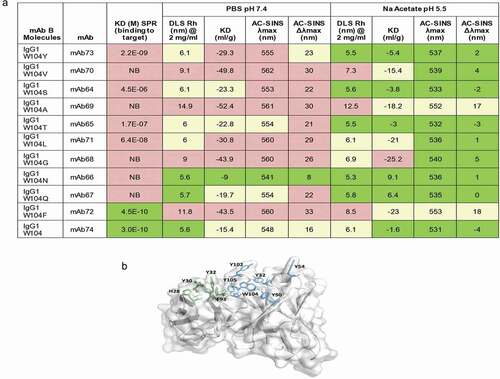
To assess the prediction value of the results seen during the screening phase, W104 and W104X variants were scaled up to allow manufacturability evaluation, such as viscosity measurements, kD assessment by DLS, and solubility to PEG 6000. In agreement to AC-SINS and Rh measurements performed during screening, significant differences in maximum absorption wavelengths (λmax) were observed also by AC-SINS using purified materials from larger scale cell cultures, confirming a potential self-association issue for W104 F in PBS pH 7.4. W104 and W104 F had λmax of 548 nm and 564 nm, respectively, which is a significant difference of 16 nm. PBS buffer alone had a λmax of 535 nm. Typically, a difference in λmax (∆λmax) between buffer and the test article ≥15 nm implies high self-interaction. Maximum absorbance shifts were lower in lower pH formulation, such as sodium acetate pH 5.5 for the W104 F variant, but showed a similar trend as in PBS pH 7.4. Hydrodynamic radius (Rh), which depends on the size, shape, homogeneity of molecules in solution, and KD measured by DLS were found to be dramatically higher for mutant W104 F versus W104 in both buffers evaluated (PBS pH 7.4 and sodium acetate pH 5.5). Rh at 2 mg/ml was 5.6 and 6.1 nm for W104, which is a typical range for mAbs, and showed an increase to 8.5 nm and 10.2 nm for the W104 F mutant in acetate and PBS formulations, respectively. This indicates that, even at low concentrations, the hydrodynamic radius of W104 F increased to a large value outside the normal distribution for antibodies. This was also confirmed by highly negative kD values measured by DLS for the W104 F mutant (−44 ml/g in PBS pH 7.4 and −23 mg/g in sodium acetate pH 5.5) ().
Analysis of W104 and selected W104X variants by HIC showed that the molecules exhibited slightly different retention times on the column (24.2–29.5 min). W104 showed the most pronounced hydrophobicity, slightly elevated over the hydrophobicity of W104Y and W104 F variants (Supplemental ). Affinity by BIAcore showed that only W104 F maintained an affinity similar to that of W104, while the remainder of the substitutions (G, T, S, A, L, V, N, Q) that showed some modest improved hydrophobicity profile on the HIC column compared to W104 showed a significant decrease in affinity. Examination of the putative antigen-binding site shows that 15 aromatic residues are present in the CDR loops, accounting for roughly 25% of the total composition of the loops, higher than the average prevalence.Citation73 A homology model of W104 () shows that 10 residues composed of 7 tyrosine, 1 phenylalanine (Phe), 1 histidine, and 1 tryptophan in the CDR are solvent exposed (). The ability of tyrosine to participate in both electrostatic and van der Waals’ interactions, along with the stabilizing role of other aromatic residues in protein–protein interfaces, is well known.Citation74,Citation75 We hypothesize that the high representation of aromatic residues in W104 and the Phe-Phe stacking geometries observed in other proteins may make W104 F more amenable to self-interaction relative to the bulkier indole ring of tryptophan.
Figure 9. Case study Humanized mAb B: correlating HT predictive self-association methods with CMC endpoints for W104 and selected W104X variants formulated in PBS pH 7.4
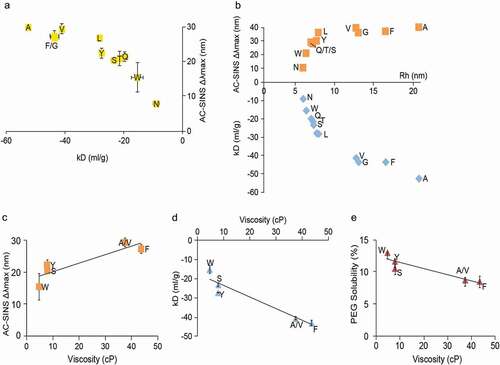
Additional developability studies were conducted on W104 and W104X variants, including W104 F, to shed light on factors contributing to the propensity of the W104 F mutant to self-interact. In and , self-association attributes are tabulated for both W104 and W104X variants. As shown, Rh and kD measured by DLS are dramatically higher for W104 F relative to WT in both buffers evaluated. Along with high self-interaction and viscosity, this further increased the risk for downstream process and formulation activities, since lower formulation pH alone (sodium acetate pH 5.5) was not able to mitigate high viscosity arising from self-interactions (data not shown).
Noticeable correlations were seen between different self-association methods (e.g., AC-SINS and Rh measurements) during the screening phase and assays used to assess manufacturability endpoints (viscosity, kD by DLS, solubility to PEG 6000) across W104 and W104X mutants. show correlation plots for molecules formulated in PBS pH 7.4. Given the depressed colloidal properties observed with W014 F and some of the other W104X mutants, these mutants were also evaluated for their solubility to PEG 6000 as an additional confirmation of the impact of the introduced mutation on their colloidal properties. AC-SINS and kD, are compared in , compares kD vs Rh (by DLS) and AC-SINS, compares AC-SINS vs. viscosity, compares kD vs viscosity, and compares PEG 6000 solubility with viscosity kD vs. viscosity, with viscosity measured at 100 mg/ml concentration. W104X variants that had the most elevated λmax by AC-SINS also showed the most negative kD (−52.4 ml/g for W104A and −43.5 ml/g for W104 F) and increased Rh by DLS (up to 14.9 nm for W104A and 11.8 nm for W104 F) (). These plots revealed a reasonable relationship between AC-SINS, λ max, kD, Rh, which also expanded further to viscosity and PEG 6000 solubility. W104X variants (W104 F, W104 V, W104A), which had higher λmax values by AC-SINS, not only showed the most negative kD and increased Rh, but also exhibited the highest viscosity at 100 mg/ml in PBS pH 7.4 (elevated to 40–50 cP) and the lowest solubility in PEG 6000 (~8% compared to 13% for W104) having overall the most depressed colloidal properties among the W104 panel.
A careful risk assessment was warranted for W104 F. We performed an analysis of W104 oxidation under unstressed and stressed conditions. The overall oxidation of W104 was moderate at <1% after expression and purification, <1% after 50°C incubation during a one-week stability study in 20 mM sodium acetate pH 5.5 buffer (data not shown) and climbed to 18.1% upon exposure to 1X light stress. This suggested that this liability may be acceptable from a Chemistry, Manufacturing, and Controls (CMC) developability perspective and could be addressed during formulation development. Importantly, following chemical and light stress (data not shown), W104 maintained BIAcore binding affinity (KD) and capacity. When weighed against the dramatic self-association that occurs in the W104 F mutant in both PBS and lower formulation pH (sodium acetate pH 5.5), which would be problematic for platform filtration, mixing, and UF/DF processes, the moderate light or chemical induced oxidation occurring at W104 is a lower risk. Therefore, the uncorrected W104 molecule was selected as the drug program candidate. In this example, HT screening assays efficiently predicted depressed colloidal properties for a variant that was further characterized and confirmed by manufacturability assays, which, using larger amounts of material, led to the deprioritization of the suboptimal molecule for development.
Discussion
Early-stage assays that evaluate mAb drug-like properties in discovery at the onset of antibody sequence generation serve as valuable tools for the selection of lead candidates. Early-stage biophysical assays, including self-association and nonspecificity evaluation, are powerful tools that can aid in the selection of molecules with optimal physicochemical and biophysical properties. This would save development costs and accelerate timeline toward first-in-human clinical initiation, eventually leading to the development of best-in-class drugs (efficacy, route of administration, half-life, dosage regimen).
Implementing developability at this screening stage will ensure that a smaller number of molecules that meet the best combination of biological activity, biophysical properties, sequence, and epitope diversity are progressed to the next stages of development.
Our HT analytical characterization of a panel of 152 human or humanized antibodies support the idea that physicochemical properties that are examined during the initial stages of candidate selection can be predictive of key downstream processes in development and clinical manufacturing, as shown with the two case studies we presented.
Several assays used in discovery were assessed for their suitability as predictive tools for downstream parameters. Many of the HT biophysical assays have counterparts in downstream development that require larger amounts of material and provide a closer read on specific properties (e.g., AC-SINS expected to correlate with protein–protein interaction (kD assessed by DLS) and viscosity measurements at high concentration (with syringeability as process feature)). Temperature of aggregation onset is predictive of real-time stability (at 4°C and accelerated temperature) and stability under stressed conditions (40°C). We identified correlations showing that aggregate formation upon low pH hold (at pH 3.5) are linked with Tonset, Tm1, and Tagg, as well as with AC-SINS, and it can provide useful information for downstream endpoints such as viscosity at high concentrations (100 mg/ml concentration and above). Molecules that show the highest Tm and Tagg also show the best colloidal properties (aggregation resistance during low pH hold, less self-interactions as detected by AC-SINS, and less hydrophobicity as demonstrated by retention times using UP-SEC and HIC). Tm/Tagg assessment by nano-DSF can be predictive of purification parameters, such as loss during binding, filtration, buffer exchange by dialysis, UF/DF, recovery, aggregation, storage, and accelerated stability. Low pH stability is predictive of viral inactivation features and allows researchers to obtain some insights into colloidal properties of the molecule. Machine learning efforts on a much larger dataset would help further solidify correlations.
In their report, Jain et al.Citation9 expressed 137 antibodies (on human IgG1 backbone) in that reached advanced clinical stages, including 48 approved that are approved for therapeutic use, in HEK293 cells and analyzed these in 12 different biophysical property assays: self-interaction by AC-SINS and clone self-interaction by biolayer interferometry; binding to poly-specificity reagent (PSR) and to baculovirus particle (BVP); cross-interaction chromatography (CIC); ELISA with a panel of commonly used antigens; expression titer in HEK293 cells; Fab melting temperature (Tm); HIC; salt-gradient affinity-capture (SGAC) self-interaction nanoparticle spectroscopy; standup monolayer adsorption chromatography (SMAC); and the percentage of monomeric species assessed by UP-SEC in the context of an accelerated stability (AS) study (up to 30 days at 40°C). The authors identified five clusters of assays based on biophysical property values of the antibodies: group 1, as the largest cluster, represents protein-binding assays (PSR, CSI, AC-SINS, CIC), group 2 includes assays that evaluate hydrophobic interactions (SGAC-SINS, SMAC, HIC), group 3 are assays that involve ELISA plate binding (ELISA and BVP), group 4 provides information on long-term aggregation propensity (AS), and group 5 are related to thermodynamic stability (HEK293 titer and Tm).
Assays that are common between our studies and Jain’s group are Tm (Fab), AC-SINS, HIC, and titer assessment. Both groups also describe the percentage of monomeric antibody species by UP-SEC, but the experiments were done under different experimental conditions. We report the percentage of monomeric antibody under two conditions (after protein A purification step and buffer exchange and after incubation at low pH (pH 3.5) for 30 minutes), while Jain et al. report data after 30 days at 40°C. Assessment of Tonset, Tagg, pI by cIEF, retention times on UP-SEC column, HP-RP purity was done only in our study. Jain et al. performed the analysis by PSR, SCI, ELISA binding to multiantigen and BVP, which we did not perform in our studies.
The strongest findings in our studies () involve unique assay and experimental conditions (e.g., pI by cIEF/Tonset, RT by HIC/RT by UP-SEC, Tm1/Tagg, Tm1/Tonset, percentage of monomeric species after low pH by UP-SEC/Tonset, pI by cIEF/percentage of monomeric species after low pH by UP-SEC, etc.). The results we present here are novel and complementary to Jain et al.’s results since we only evaluated one assay from their group 1 (AC-SINS) and group 2 (HIC), and none from their group 3. The one correlation we saw that is not readily apparent in the Jain et al. study is the correlation between Tonset, Tm1 (listed as Tm in Jain et al.) and aggregation propensity, as measured by Tagg and percentage of monomeric antibody after protein A chromatography and low pH incubation.
When developed as therapeutics, human IgG1 molecules have better biophysical properties (higher Tm, Tagg, better colloidal properties) than human IgG4.Citation68,Citation69 Our analysis on the panel of 152 mAbs confirmed and further expanded the published findings across several HT assays (aggregation formation upon low pH stress, AC-SINS, Tm/Tagg). Since the mAbs that were examined on human IgG1 and IgG4 backbones had different variable domains for most of the molecules, a pairwise comparison of mAbs with identical variable domain sequences on IgG1 and IgG4 would be needed to confirm the conclusions.
In Case study 1, we observe that engineering a molecule with higher pI through humanization improved several attributes, including Tm/Tagg, aggregation levels on release and during accelerated stability, solubility, purification yield, and lower particle formation. The differences in Tm/Tagg correlated well with aggregation propensity during expression and accelerated stability, as well as particle formation. A modest improvement in interaction parameter kD was observed for the high pI variants, but acceptable values in kD and low AC-SINS for all (low and high pI) variants correlated well with low viscosities at 100 mg/ml. VL CDR1 deamidation was also successfully corrected. A better molecule with lower developability risk was successfully achieved through efforts that revolved around improving aggregation propensity.
In Case study 2, attempted correction of a VH CDR3 tryptophan oxidation site created significant self-association issues, although the correction did not significantly affect other developability attributes, including target antigen affinity and aggregation propensity. For these correction variants, predictive self-association assays such as AC-SINS, kD and Rh by DLS, and even PEG solubility, correctly predicted high viscosities up to 100 mg/ml and all attributes correlated with each other. Developability risk was weighed between oxidation and self-association, and we deemed the tryptophan oxidation to be a much lower developability risk and more easily mitigated during process and formulation activities. Remarkably, W104X variant self-association was highly significant and dramatically attenuated through the mutagenesis of a single CDR residue. This led us to hypothesize that significant self-association behavior is a highly specific interaction event. Similar to Case Study 1, a better molecule with lower developability risk was successfully achieved by improving self-association behavior.
Criteria and quality attributes identified during the developability screening phase via in silico predictive and HT experiment analysis are typically confirmed and additional criteria are addressed in the manufacturing phase. Our discovery stage HT screening and developability workflow utilize materials expressed and purified from transient transfection in CHO-EXPI cells. The final assessment and downstream process fit analysis will utilize stable CHO manufacturing cell lines.
Without a doubt, a tight integration of discovery screening, in silico prediction, sequence optimization, and selection via HT analytical methods, HT data management system, and developability and process development activities are crucial to ensure a streamlined and fast progression of a molecule with good properties to the clinic. In addition, the inclusion of this assessment in discovery provides a platform to incorporate knowledge about product into development activities. Typically, the initial identification of a product’s quality attributes and degradation pathways that are critical occurs in discovery during the initial stages of developability assessment.Citation76,Citation77 The pCQAs identified in discovery are not intended to set specifications for development and manufacturing. Developability can be considered as an extension of Quality by design guidance, providing a bridge between “product knowledge” and “product understanding”, addressing the influence of product characteristics in manufacturing and clinical outcome, and helping expand the design space for a drug candidate.Citation77,Citation78
Potency and differentiation of the biology are critical drivers for a successful drug in the marketplace; therefore, these aspects must be considered when ranking and selecting candidates for progression to development. Inclusion of developability in the selection criteria made in discovery is in line with downstream development, clinical manufacturing needs, and aim to reduce the rate of failure during development, allowing for a streamlined and faster path from discovery to manufacturing, commercialization, and, ultimately, the clinic. From the developability side, it should be emphasized that, while molecules are ranked based on their overall physicochemical and biophysical properties, some properties are considered to be high impact attributes (attributes related to thermostability, colloidal properties, stability, pI, and frequently encountered PTMs, such as oxidation, deamidation, and isomerization), and others are more secondary attributes (charge distribution, hydrophobic variants, less frequent PTMs such as glycation), which typically are easier to mitigate in the bioprocess arena through formulation process development. An assessment against absolute values and strict cutoff for acceptability criteria is useful and often applied, but cannot frequently be readily utilized, as the overall data package needs to be examined in the context of the indication. For example, high viscosity may hinder high-concentration subcutaneous (SC) liquid formulation, but a very potent molecule that can be given at a low dose where intravenous (IV) injections are possible may still have a place in the market. As a result, biologics molecule ranking needs to be based on a fully integrated set of parameters as described here, as well as consideration of the medical indication in the clinic and route of administration. Incorporation of these multiple key considerations at an early stage of discovery research coupled with sequence-based or in silico predictive approaches and tools will allow the selection and rapid progression of best-in-class antibody therapeutics to the clinic.Citation79-Citation81Interestingly, the observed correlations with single in silico descriptors proved to be weak in general and highly sensitive to subtle changes in structure preparation. When multiple descriptors were combined via PLS, the model became significantly more robust to these changes and predictive over a wider array of mAbs including novel structures. Overall, a predictive r2 of greater than 0.6 using a small number of components is an extremely promising start given the relatively small size of our sample pool. However, we did not set out to create a model that could precisely predict the HIC retention time of a given mAb sequence. While this may be a long-term goal, the more prescient concern would be the ability to provide a binary classification of promising candidates vs. likely failures. In this context, the model was able to perform exceedingly well, correctly classifying compounds as “good” vs “bad” eluter with about 82% accuracy. Machine learning, or other more complex models, were considered to be premature given the size of our dataset. Indeed, initial attempts at their use yielded poor correlation and weak signals (data not shown). While we will continue to investigate its utility as our dataset grows, we found that PLS regression and QSPR modeling provided simple equations that were relevant, interpretable, and portable.
Materials and methods
Expression and Purification (gene synthesis, transfection, titer estimation, protein A purification)
Transient transfections were done in TubeSpin® bioreactors (TPP Techno Plastic Products AG) using the ExpiCHO Expression System (Thermo Fisher Scientific, Waltham, MA) for the protein production in this study according to the manufacturer’s protocol. Briefly, the cells were grown and maintained in ExpiCHO Expression Medium (Thermo Fisher Scientific) and seeded in 10 mls of media at 6x10^6 cells/mL on the day of transfection. Complexes were formed with 8 ug of DNA and 32 ul of Expifectamine in OptiPRO™ SFM and incubated for 1 min followed by addition to the cells. The transfected cultures were grown at 37°C, 5% CO2, 80% humidity, and 300 rpm rotation in a Multitron incubator (Infors HT, Basel, Switzerland) and then shifted to 32°C 24 hr post-transfection and were fed with feed and enhancer on days 1 and 5. The cultures were harvested on day 7, the cells were pelleted by centrifugation, and the supernatant was passed through a 0.2 micron filter. The protein titers were determined using a ForteBio Octet (Molecular Devices, LLC. San Jose, CA) with Protein A sensors and a purified mAb to generate the standard curve.
The clarified cell culture supernatants were loaded onto Tecan Freedom EVO 200 (Tecan Life Sciences, Männedorf, Switzerland) for antibody purification utilizing miniature columns manufactured by Repligen (Waltham, MA) and packed with MabSelect™ SuRe™ LX (GE Healthcare Life Sciences, Pittsburgh PA). The antibodies were eluted with 20 mM sodium acetate at pH3.5 and immediately neutralized with 0.333 M Tris, 1 M sodium acetate, pH 8.0 and buffer exchanged into 20 mM sodium acetate pH 5.5.
Larger batches of humanized antibodies were generated from transiently transfected CHO-Expi cells lines and. Antibodies were purified from culture supernatant by affinity chromatography using a Protein A coupled resin (MabSelect™ SuRe™ (GE Healthcare Life Sciences, Pittsburgh PA)). The mAb was then incubated at pH 3.5 for 1 hour at room temperature by the addition of 1 M acetic acid. After 1 hour, the pH was adjusted to 7 using 1 M tris base and the mAb solution was filtered to remove particulates. The low conductivity mAb solution was then loaded on an AEX chromatographic support (Capto Q resin, GE Healthcare) equilibrated in 25 mM tris hydrochloric acid pH 7 buffer. Finally, the AEX flow through containing the mAb was dialyzed into the formulation buffer consisting of 20 mM sodium acetate pH 5.5. This purification scheme is similar to the platform purification scheme used in downstream development areas.
Size-exclusion chromatography HPLC
To determine aggregation by UP-SEC, 5 μg of purified antibody was injected onto a BEH200 (Waters Acquity BEH200 SEC, 1.7 μm, 4.6 × 150 mm) size exclusion column that was equilibrated with 100 mM sodium phosphate, 200 mM sodium chloride, 0.02% sodium azide pH 7, at 0.5 mL/minute using a Waters H-Class UPLC. Chromatograms were collected at both 215 and 280 nm wavelengths, and integration of the absorption at 280 nm (wavelength) trace was performed using EMPOWER 2 (Waters).
Hydrophobic chromatography
To determine the hydrophobicity of a given mAb using HIC, 50 ug of sample at 0.5–1 mg/ml was mixed 1/1 (v/v) with a 100 mM sodium phosphate, 2 M ammonium sulfate pH 7.0 buffer solution. Prepared samples were subsequently filtered through a 0.22 um PVDF membrane prior to loading 60 ul on a Dionex Pro Pac HIC-10 column equilibrated in 100 mM sodium phosphate, 1 M ammonium sulfate pH 7.0 (mobile phase A). The samples were eluted using an inverted gradient from mobile phase A to 100 mM sodium phosphate pH 7.0 (mobile phase B). The elution was followed by recording the A280 nm as a function of time, the data was then exported and analyzed using the Empower software. The retention time of each sample was compared to a reference and is characteristic of the mAb hydrophobicity with longer elution times correlating with higher degree of hydrophobicity.
Reverse phase chromatography
To determine purity using reverse phase high-performance liquid chromatography, 15 μg of purified antibody was loaded onto a POROS R2/10 2.1 × 30 mm column (Applied Biosystems) and equilibrated with 30% acetonitrile, 0.2% trifluoroacetic acid at 70°C and 2 mL/min. Samples were eluted with a linear gradient from 30-58% acetonitrile in 0.2% trifluoroacetic acid over 5 minutes. Chromatograms were collected at both 215 and 280 nm wavelengths, and integration of the A280 nm trace was performed using Chemstation Rev. B.04.01 (Agilent).
Tonset/Tm/Tagg measurements by nano-DSF
Nano-DSF is a method for measuring ultra-high-resolution protein stability using intrinsic tryptophan or tyrosine fluorescence. All nano-DSF studies were performed using the Nanotemper Prometheus NT.48 instrument. Samples (~10 μL at 0.5–1 mg/mL) were loaded by capillarity into standard grade nano-DSF capillaries, placed on the Prometheus capillary holder and subjected to a temperature ramping of 1°C/minute from 20°C to 94.8°C. Up to 48 samples were analyzed in parallel and assessed for stability in 3 seconds at the respective temperature.
The melting point (Tm) onset (°C) and Tm (°C) values indicate the structural stability of the samples and were obtained by monitoring the intrinsic tryptophan and tyrosine fluorescence at the emission wavelengths of 330 nm and 350 nm. To generate an unfolding curve, the ratio of the fluorescence intensities (F350 nm/F330 nm) was plotted vs. temperature or time. The thermal stability of a sample was described by the thermal unfolding transition midpoint Tm (°C), at which half of the protein population is unfolded. The Tm corresponds to the inflection point of the unfolding curve and was determined via the derivative of the curve.
The aggregation point Tagg (°C) is representative of the colloidal stability of the samples and was obtained by monitoring the back-reflection of near ultraviolet (UV) light using back reflection optics. The back-reflection optics use of near UV light scattering by protein aggregates, and thus only non-scattered light reaches the detector. The reduction of back reflected light is therefore a direct measure for aggregation in the sample.
Sodium dodecyl sulfate capillary electrophoresis
Five µL of each sample at 1 mg/mL were mixed in a 96-well plate with 35 µL of loading buffer (HT Protein Express Sample Buffer) (Perkin Elmer, Waltham, MA) containing either 50 mM iodoacetamide or 50 mM dithiothreitol. The plate was incubated at 70°C for 20 minutes and 75 µL of water was added to each well. Each sample was analyzed on a LabChip GXII (Perkin Elmer) using an HT Protein Express Chip (Perkin Elmer). Electropherograms were collected by measuring the fluorescence of the sample over time and integrated using the LabChip GX software V4.1.1619.0 SP1 (Perkin Elmer, Waltham, MA).
Affinity-capture self-interaction nanoparticle spectroscopy
The AC-SINS assay measures protein self-interaction by capturing the mAb on the surface of a gold colloid that displays surface resonance oscillations in frequency with visible light. As the immobilized antibodies self-interact, the colloids aggregate, changing the oscillation frequency to absorb at a longer wavelength. Gold nanoparticles were incubated overnight with an 80/20 (v/v) capture antibody/non-capture antibody mixture. The coated gold nanoparticles were then spun down and resuspended into the conjugation buffers (20 mM sodium acetate pH 5.5 and PBS 1x pH 7.4) to a final volume of 50 ul. The samples were diluted to 0.05 mg/ml into the conjugation buffers and 45 ul of each dilution was loaded onto a 384-well plate. Five ul of previously prepared gold nanoparticles were then added to each well of the plate including mAbs and buffer controls. The plate was then covered with an aluminum lid, incubated at room temperature for 2 hours, and quickly spun down at 3000 rpm prior to reading the absorbance spectra of each well from 450 to 650 nm using a plate reader. Each sample spectra was recorded and analyzed for red-shifting of the maximum of absorption peak compared to buffers and mAb controls, the red-shifting and its strength is indicative of the self-interaction propensity of the tested mAb sample.
Assessment of aggregation and self-interaction by dynamic light scattering
All DLS studies were performed at 25°C on the undiluted samples in glass bottom 96-well plates using a DynaPro Plate Reader II (Wyatt, Santa Barbara, CA). Twenty (20) acquisitions (5 seconds each) per well were averaged and the hydrodynamic radius (Rh), % polydispersity, and % mass was modeled using Dynamics version 7.1.9.3 (Wyatt Technology) to assess aggregation.
For the determination of self-interaction, the diffusion interaction parameter (kD) was determined by DLS. High-concentration samples were diluted with the buffers of interest (20 mM sodium acetate pH 5.5 and 10 mM histidine hydrogen chloride pH 6.5) to obtain a concentration of 20 mg/mL, filtered through 0.22 µm filters, and diluted in filtered buffers (with desired pH and ionic strength) to obtain lower concentration samples (2, 5, 10, 15, and 20 mg/mL), which were then added to the microplate. The kD was determined by a linear fit of the measured (mutual) diffusion coefficients as a function of concentration.
PEG 6000 solubility measurement
To determine the PEG 6000 solubility of a given protein, samples were dialyzed and diluted to 2 mg/mL with the filtered buffers of interest (20 mM sodium acetate pH 5.5 and 10 mM histidine hydrogen chloride pH 6.5). The PEG 6000 concentration screens (0 to 40% w/v) were generated using the Andrew robot (Alliance, Geneva, Switzerland) by diluting a 40% w/v PEG 6000 stock solution in buffers of interest with stock solutions of the corresponding buffers. Ten (10) µL of the 2 mg/mL samples were loaded into a half-well UV microplate (Corning, Corning, NY) pre-loaded with 90 µL of the previously prepared PEG 6000 concentration screen solutions, mixed, and incubated 1 hour at room temperature prior to reading the plate using an EPOCH/2 Microplate reader from BioTek (Winooski, VT) measuring the optical densitometry at 320 nm wavelength. The optical density at 280 nm (OD280) can also be used to analyze the filtered samples. The value reported was the PEG 6000 concentration at the midpoint at which half of the protein population was precipitated and was determined via the derivative of the precipitation curve.
Viscosity assessment
This method accurately measures dynamic viscosities of antibody and protein formulations for a range of concentrations and viscosities (1–80 cP). Samples were evaluated for viscosity in 3 different formulations (10 mM sodium acetate pH 5.5, 10 mm histidine-HCl pH 6.5, and 1x PBS pH 7.4) and within a 10–200 mg/ml concentration range. The prepared samples were then filtered using a 0.2 um PVDF membrane prior to loading 60 ul into glass vials. The vials were quickly spun down and placed into the VROC initium (Rheosense, San Ramon, CA) sample vial tray. Forty-eight (48) ul of the sample were then injected into the instrument cell where the viscosity of the solution was measured between 1 and 80 cP at 25°C. Viscosity values were then plotted as a function of protein concentration. Each reported viscosity value was the average of 10 measurements.
Assessment of aggregation formation after low pH hold
In this method, the samples from small-scale purification were quickly buffer exchanged using a 96-well Zeba Spin desalting plate prior to lowering the pH to 3.5 using 2 M acetic acid. The plate was then covered using a Roche light cycler foil and incubated for 30 min at room temperature prior to adjusting the pH of the solution to 5 using 1 M TRIS base. The samples were then spun down quickly at 3000 rpm prior to injecting 5–10 ug on a Waters BEH200 SEC column equilibrated in 100 mM sodium phosphate, 200 mM sodium chloride, 0.02% sodium azide pH 7 using a Waters UPLC system to assess the sample purity by UP-SEC.
Oxidation by Azobis(2-amidinopropane) dihydrochloride
Antibody at 1–2 mg/mL was incubated in 1 mM AAPH at 40°C for 6 hours protected from light, buffer exchanged into 20 mM sodium acetate, pH 5.5 and stored at −80°C until analysis.
Light stress
Antibody at 1–2 mg/mL was placed in a reusable quartz cuvette, exposed to 1x light (200 W-h/m2 ultraviolet and 1200 k-lux visible light) at 25°C. and stored at −80°C until analysis.
Assessment of isoelectric point and charge variants by cIEF
To determine the pI by cIEF, samples were diluted to 0.2 mg/mL in buffer containing 0.35% methyl cellulose, 3 M urea, 1% Pharmalyte 3–10 (GE Healthcare), 0.5% Pharmalyte 5–8, 0.5% Pharmalyte 8–10, 0.5% pI marker 5.85 (ProteinSimple, San Jose, CA) and 0.5% pI marker 9.77. Samples were run on an iCE3 (ProteinSimple, San Jose, CA) using an FC-coated capillary focusing for 1 minute at 1500 V followed by 8 minutes at 3000 V. Data was exported into and integrated using Empower 2 (Waters).
Analysis of antibodies by LC−MS/MS peptide mapping
For peptide mapping by mass spectrometry, 100 μg of each sample was denatured with 30 µL of 8 M guanidine/1 M tris hydrochloride solution (15:1), reduced with 2 µL of 1 M dithiothreitol for 30 minutes at 60°C and alkylated with 5 µL of 1 M iodoacetamide for 45 minutes in dark. Before digestion, samples were buffer exchanged into 50 mM ammonium bicarbonate using 7 kDa molecular weight cut off ZEBA cartridges. Samples were digested with 2 µg of trypsin and chymotrypsin for 2 hours at 37°C. Digestion was quenched by the addition of 3 μL of 5 M hydrochloride to each sample. Data was acquired in a Dionex/QE plus MS using a linear gradient over 50 min from 2-36% acetonitrile in 0.1% formic acid. Samples were analyzed using PEAKS DB (Bioinformatics Solutions Inc.) for database searching as well as PepFinder (Thermo Fisher Scientific) and manual verification for the percent change assessment.
Analysis by SPR (BIAcore)
Binding kinetics of the mAbs to the target was determined by SPR on a BIAcore T200 or BIAcore 4000 (GE Healthcare). The running buffer, 10 mM HEPES, 150 mM NaCl, 0.05% v/v Surfactant P20, 3 mM EDTA, pH 7.4 (HBS-EP+, GE Healthcare) was used for immobilization and reagent dilutions. All binding kinetics were measured at 25°C.
For each injection cycle, mAbs were first captured in different flow cells with an anti-human Fc antibody (Human Antibody Capture Kit, GE Healthcare) immobilized to the sensor chip (Series S CM5, GE Healthcare). Reference flow cell with no captured mAb was also used. Serial dilutions of the target protein, ranging in concentration from 0.16 nM to 80 nM, and buffer blanks were injected in multiple cycles over the captured mAbs and reference surfaces for a 3-minute association followed by a 10-minute dissociation. The surfaces were regenerated with a 30 second injection of 3 M MgCl2 after each cycle.
Double-referenced titration data was globally fit to a 1:1 Langmuir binding model to determine the association rate constant, ka (M−1 s−1), and the dissociation rate constant, kd (s−1), using the BIAcore T200 Evaluation Software version 2.0 or BIAcore 4000 Evaluation Software version 1.1 (GE Healthcare). The equilibrium dissociation constant was calculated as KD (M) = kd/ka.
Subvisible particle assessment following 10 days incubation at 50°C by flow cytometry
A Guava EasyCyte 5HT™ flow cytometer (GFC) used in this study was purchased from EMD Millipore Corp (Billerica, MA). Briefly, the plate carrying the protein samples (160 µL of 1 mg/mL protein solution) was left undisturbed at 5°C overnight for degassing and minimizing potential interference from micro air bubbles that might have been trapped in the solution during the sample preparation. The data were collected for 250 s to allow an analyzed sample volume of 60 μL, unless the particle counts hit the 200,000 count limit of this instrument before 250 s and the instrument automatically ended the data collection and moved onto the next sample. The number of measured particles is limited by the analyzed sample volume (60 μl) or 200,000 counts. The number of reported particles in particles/mL is proportional to the volume multiplication factor and measured volume. The instrument performance was confirmed with Easy Check Kit (EMD Millipore Corp) before sample analysis. The sample plate was gently hand-mixed prior to be loaded on the GFC instrument and was assayed without using the GFC mixer in order to avoid potentially altering protein aggregate populations and generating air bubbles.
Antibody homology model generation
Homology models of the Fab region for all sequences were created using the Antibody Modeler application in MOE Citation2019.0102.Citation82 A homology search was performed for each sequence in order to identify optimal templates. Each of the 6 CDRs, as well as for the variable framework and constant regions of both the light and heavy chains, was scored and provided a template. These 8 contributors yielded a chimeric template that possessed identity with the candidate sequence ranging between a minimum of 78% to a maximum of 100%, with a median of 98% and 93% for VL and VH, respectively. For each antibody, the 5 best models produced, regardless of template origin, were retained for use in the calculation of ensemble properties. Models were minimized with the Amber14:EHT forcefield in MOE Citation2019.0102.Citation82
Homology ensemble model property calculations
Surface property patches, consisting of both hydrophobic and ionic patches, were identified with the protein properties application in MOE Citation2019.0102.Citation82 Hydrophobic patches were considered if they exceeded 50Å2 using a lipophilicity cutoff of 0.9 as determined by mapping atomic SLogP to the protein surface. Average surface areas were computed for all surface property patches obtained for the model ensemble. The top-scoring model for each antibody was used to calculate an averaged LowModeMDCitation83,Citation84 sample-based patch surface area calculations. The sample mode was used and a pH range of 6.5 to 7.5 with 50 conformations calculated over the range. The framework was restrained to be within 0.25 Å of the initial model. Ensemble averages were calculated for each surface property. The QSAR Model application in MOE Citation2019.0102Citation82 was used to determine the PLS model. The model was generated using all 152 tested mAbs and validated using leave-one-out cross validation. Final testing of the model was preformed using a novel independent data set consisting of 106 mAb sequences as described by Jain et al.Citation9
Abbreviations
| Å | = | Angstrom |
| AAPH | = | 2,2ʹ-Azobis(2-amidinopropane) dihydrochloride |
| AC-SINS | = | Affinity-capture self-interaction nanoparticle spectrometry |
| AEX | = | Anion exchange chromatography |
| Asn | = | Asparagine |
| BVP | = | baculovirus particle |
| CDR | = | Complementary-Determining Region |
| CE-SDS | = | Sodium dodecyl sulfate capillary electrophoresis |
| CHO | = | Chinese Hamster Ovary |
| CIC | = | cross-interaction chromatography |
| cIEF | = | Capillary isoelectric focusing |
| CMC | = | Chemistry, Manufacturing, and Controls |
| Cp | = | Centipoise |
| CSI-BLI | = | clone self-interaction by biolayer interferometry |
| DLS | = | Dynamic light scattering |
| DSF | = | Differential scanning fluorimetry |
| Gln | = | Glutamine |
| HCP | = | Host cell proteins |
| HIC | = | Hydrophobic chromatography |
| HIC | = | RT-PRED Hydrophobic chromatography predicted retention time |
| His | = | Histidine |
| HMW | = | High molecular weight |
| HP- RP | = | High pressure Reverse phase chromatography |
| HT | = | High-Throughput |
| IEX | = | Ion-exchange chromatography |
| IgG1 | = | human immunoglobulin of IgG1 subclass |
| IgG4 | = | human immunoglobulin of IgG4 subclass |
| IM | = | Intact Mass |
| IV | = | Intravenous |
| KD | = | Binding affinity constant |
| kD | = | Diffusion interaction parameter |
| LC-MS | = | Liquid chromatography- mass spectrometry |
| M | = | molar |
| mAb | = | Monoclonal antibody |
| Met | = | Methionine |
| NHP | = | Non-human primate |
| PBS | = | Phosphate-buffered saline |
| pCQA | = | Product Critical Quality Attribute |
| PEG | = | Polyethylene glycol |
| Phe | = | Phenylalanine |
| pI | = | Isoelectric point |
| PLS | = | Partial least squares |
| PTM | = | Post translational modifications |
| QSAR | = | Quantitative structure-activity relationship |
| QSPR | = | Quantitative structure-property relationship |
| Rh | = | Hydrodynamic radius |
| RT | = | retention time |
| SC | = | Subcutaneous |
| SGAC-SINS | = | Salt-gradient affinity-capture self-interaction nanoparticle spectroscopy |
| SMAC | = | Standup monolayer adsorption chromatography |
| SPR | = | Surface plasmon resonance |
| Tagg | = | Temperature of aggregation onset |
| Tonset | = | Onset of melting temperature |
| Tm | = | Thermal unfolding transition midpoint |
| Trp | = | Tryptophan |
| Tyr | = | Tyrosine |
| UF/DF | = | Ultrafiltration/Diafiltration |
| UP- SEC | = | Ultra pressure size exclusion chromatography |
| UV | = | Ultraviolet |
| VH | = | Variable domain of Heavy Chain |
| VL | = | Variable domain of Light Chain |
Declarations of Interest
During the execution of this work, all authors were employees of subsidiaries of Merck & Co., Inc., Kenilworth, NJ, USA and stock-holders of Merck & Co., Inc., Kenilworth, NJ, USA.
Supplemental Material
Download Zip (731.7 KB)Acknowledgments
The authors would like to thank Daniel Holder from the Early Development Statistics group at MSD for help with the JMP analysis, acknowledge the contributions of all the members of the MSD South San Francisco Protein Sciences Department within Discovery Biologics, members of the MSD Biologics Process R&D and Sterile Formulation Sciences Departments within Pharmaceutical Sciences in Kenilworth, NJ, and Luat Nguyen from MSD Bioinformatics IT, South San Francisco.
Supplemental Material
Supplemental data for this article can be accessed on the publisher’s website.
References
- Kaplon H, Reichert JM. Antibodies to watch in 2019. MAbs. 2019;11:219–28. doi:https://doi.org/10.1080/19420862.2018.1556465.
- Goulet DR, Atkins WM. Considerations for the design of antibody-based therapeutics. J Pharm Sci. 2019.
- Fogel DB. Factors associated with clinical trials that fail and opportunities for improving the likelihood of success: A review. Contemp Clin Trials Commun. 2018;11:156–64. doi:https://doi.org/10.1016/j.conctc.2018.08.001.
- Kola I, Landis J. Can the pharmaceutical industry reduce attrition rates? Nat Rev Drug Discov. 2004;3:711–15. doi:https://doi.org/10.1038/nrd1470.
- Tomar DS, Singh SK, Li L, Broulidakis MP, Kumar S. In silico prediction of diffusion interaction parameter (kD), a key indicator of antibody solution behaviors. Pharm Res. 2018;35(10):193. doi: https://doi.org/10.1007/s11095-018-2466-6.
- Neergaard MS, Kalonia DS, Parshad H, Nielsen AD, Møller EH. Van de Weert M. Viscosity of high concentration protein formulations of monoclonal antibodies of the IgG1 and IgG4 subclass - Prediction of viscosity through protein-protein interaction measurements. Eur J Pharm Sci. 2013;49:400–10. doi:https://doi.org/10.1016/j.ejps.2013.04.019.
- Jarasch A, Koll H, Regula JT, Bader M, Papadimitriou A, Kettenberger H. Developability assessment during the selection of novel therapeutic antibodies. J Pharm Sci. 2015;104:1885–98. doi:https://doi.org/10.1002/jps.24430.
- Yang X, Xu W, Dukleska S, Benchaar S, Mengisen S, Antochshuk V, Cheung J, Mann L, Babadjanova Z, Rowand J, et al. Developability studies before initiation of process development: improving manufacturability of monoclonal antibodies. MAbs. 2013;5:787–94. doi:https://doi.org/10.4161/mabs.25269.
- Jain T, Sun T, Durand S, Hall A, Houston NR, Nett JH, Sharkey B, Bobrowicz B, Caffry I, Yu Y, et al. Biophysical properties of the clinical-stage antibody landscape. Proc Natl Acad Sci U S A. 2017;114:944–49. doi:https://doi.org/10.1073/pnas.1616408114.
- Xu Y, Wang D, Mason B, Rossomando T, Li N, Liu D, Cheung JK, Xu W, Raghava S, Katiyar A, et al. Structure, heterogeneity and developability assessment of therapeutic antibodies. MAbs. 2019;(11):239–64. doi:https://doi.org/10.1080/19420862.2018.1553476.
- Lauer TM, Agrawal NJ, Chennamsetty N, Egodage K, Helk B, Trout BL. Developability index: A rapid in silico tool for the screening of antibody aggregation propensity. J Pharm Sci. 2012;101:102–15. doi:https://doi.org/10.1002/jps.22758.
- Chennamsetty N, Voynov V, Kayser V, Helk B, Trout BL. Prediction of aggregation prone regions of therapeutic proteins. J Phys Chem B. 2010;114:6614–24. doi:https://doi.org/10.1021/jp911706q.
- Agrawal NJ, Helk B, Kumar S, Mody N, Sathish HA, Samra HS, Buck PM, Li L, Trout BL. Computational tool for the early screening of monoclonal antibodies for their viscosities. MAbs. 2016;8:43–48. doi:https://doi.org/10.1080/19420862.2015.1099773.
- Seeliger D, Schulz P, Litzenburger T, Spitz J, Hoerer S, Blech M, Enenkel B, Studts JM, Garidel P, Karow AR. Boosting antibody developability through rational sequence optimization. MAbs. 2015;7:505–15. doi:https://doi.org/10.1080/19420862.2015.1017695.
- Obrezanova O, Arnell A, De La Cuesta RG, Berthelot ME, Gallagher TRA, Zurdo J, Stallwood Y. Aggregation risk prediction for antibodies and its application to biotherapeutic development. MAbs. 2015;7:352–63. doi:https://doi.org/10.1080/19420862.2015.1007828.
- van der Kant R, Karow-Zwick AR, Van Durme J, Blech M, Gallardo R, Seeliger D, Aßfalg K, Baatsen P, Compernolle G, Gils A, et al. Prediction and reduction of the aggregation of monoclonal antibodies. J Mol Biol. 2017;429:1244–61. doi:https://doi.org/10.1016/j.jmb.2017.03.014.
- Lu X, Nobrega RP, Lynaugh H, Jain T, Barlow K, Boland T, Sivasubramanian A, Vásquez M, Xu Y. Deamidation and isomerization liability analysis of 131 clinical-stage antibodies. MAbs. 2019;11:45–57. doi:https://doi.org/10.1080/19420862.2018.1548233.
- Xu A, Kim HS, Estee S, Viajar S, Galush WJ, Gill A, Hötzel I, Lazar GA, McDonald P, Andersen N, et al. Susceptibility of antibody CDR residues to chemical modifications can be revealed prior to antibody humanization and aid in the lead selection process. Mol Pharm. 2018;15:4529–37. doi:https://doi.org/10.1021/acs.molpharmaceut.8b00536.
- Jain T, Boland T, Lilov A, Burnina I, Brown M, Xu Y, Vásquez M. Prediction of delayed retention of antibodies in hydrophobic interaction chromatography from sequence using machine learning. Bioinformatics. 2017;33:3758–66. doi:https://doi.org/10.1093/bioinformatics/btx519.
- Hanke AT, Klijn ME, Verhaert PDEM, van der Wielen LAM, Ottens M, Eppink MHM. van de Sandt EJAX. Prediction of protein retention times in hydrophobic interaction chromatography by robust statistical characterization of their atomic-level surface properties. Biotechnol Prog. 2016;32:372–81. doi:https://doi.org/10.1002/btpr.2219.
- Lefranc MP, Giudicelli V, Kaas Q, Duprat E, Jabado-Michaloud J, Scaviner D, Ginestoux C, Clément O, Chaume D, Lefranc G. IMGT, the international ImMunoGeneTics information system®. Nucleic Acids Res. 2005 Jan 1;33(Database issue):D593–7.
- Milstein C. The hybridoma revolution: an offshoot of basic research. BioEssays. 1999;21:966–73. doi:https://doi.org/10.1002/(SICI)1521-1878(199911)21:11<966::AID-BIES9>3.0.CO;2-Z.
- Lee EC, Owen M. The application of transgenic mice for therapeutic antibody discovery. Methods Mol Biol. 2012;901:137–48.
- Wang W. Protein aggregation and its inhibition in biopharmaceutics. Int J Pharm. 2005;289:1–30. doi:https://doi.org/10.1016/j.ijpharm.2004.11.014.
- Philo J, Arakawa T. Mechanisms of Protein Aggregation. Curr Pharm Biotechnol. 2009;10:348–51. doi:https://doi.org/10.2174/138920109788488932.
- Cromwell MEM, Hilario E, Jacobson F. Protein aggregation and bioprocessing. Aaps J. 2006 Sep 15;8(3):E572–9.
- Vlasak J, Ionescu R. Heterogeneity of monoclonal antibodies revealed by charge-sensitive methods. Curr Pharm Biotechnol. 2008;9:468–81. doi:https://doi.org/10.2174/138920108786786402.
- Liu H, Gaza-Bulseco G, Faldu D, Chumsae C, Sun J. Heterogeneity of monoclonal antibodies. J Pharm Sci. 2008;97:2426–47. doi:https://doi.org/10.1002/jps.21180.
- Hebditch M, Roche A, Curtis RA, Warwicker J. Models for antibody behavior in hydrophobic interaction chromatography and in self-association. J Pharm Sci. 2019;108:1434–41. doi:https://doi.org/10.1016/j.xphs.2018.11.035.
- Kelly RL, Sun T, Jain T, Caffry I, Yu Y, Cao Y, Lynaugh H, Brown M, Vásquez M, Dane Wittrup K, et al. High throughput cross-interaction measures for human IgG1 antibodies correlate with clearance rates in mice. MAbs. 2015;7:770–77. doi:https://doi.org/10.1080/19420862.2015.1043503.
- Jacobitz AW, Dykstra AB, Spahr C, Agrawal NJ. Effects of buffer composition on site-specific glycation of lysine residues in monoclonal antibodies. J Pharm Sci. 2019 Jan;109(1):293–300. doi: https://doi.org/10.1016/j.xphs.2019.05.025. Epub 2019 May 29.
- Goyon A, Excoffier M, Janin-Bussat MC, Bobaly B, Fekete S, Guillarme D, Beck A. Determination of isoelectric points and relative charge variants of 23 therapeutic monoclonal antibodies. J Chromatogr B Anal Technol Biomed Life Sci. 2017;1065–1066:119–28. doi:https://doi.org/10.1016/j.jchromb.2017.09.033.
- Breitsprecher D, Glücklich N, Hawe A, Menzen T Comparison of nanoDSF and µDSC for thermal stability assessment during biopharmaceutical formulation development [Internet]. 2006 [cited 2020 Jan 27]; Available from: https://resources.nanotempertech.com/application-notes/application-note-nt-pr-006-dsc-nanodsf-comparison
- Estep P, Caffry I, Yu Y, Sun T, Cao Y, Lynaugh H, Jain T, Vásquez M, Tessier PM, Xu Y. An alternative assay to hydrophobic interaction chromatography for high-throughput characterization of monoclonal antibodies. MAbs. 2015;7:553–61. doi:https://doi.org/10.1080/19420862.2015.1016694.
- Liu Y, Caffry I, Wu J, Geng SB, Jain T, Sun T, Reid F, Cao Y, Estep P, Yu Y, et al. High-throughput screening for developability during early-stage antibody discovery using self-interaction nanoparticle spectroscopy. MAbs. 2014;6:483–92. doi:https://doi.org/10.4161/mabs.27431.
- Alam ME, Geng SB, Bender C, Ludwig SD, Linden L, Hoet R, Tessier PM. Biophysical and sequence-based methods for identifying monovalent and bivalent antibodies with high colloidal stability. Mol Pharm. 2018;15:150–63. doi:https://doi.org/10.1021/acs.molpharmaceut.7b00779.
- Tomar DS, Li L, Broulidakis MP, Luksha NG, Burns CT, Singh SK, Kumar S. In-silico prediction of concentration-dependent viscosity curves for monoclonal antibody solutions. MAbs. 2017;9:476–89. doi:https://doi.org/10.1080/19420862.2017.1285479.
- Dani B, Platz R, Tzannis ST. High concentration formulation feasibility of human immunoglobulin G for subcutaneous administration. J Pharm Sci. 2007;96:1504–17. doi:https://doi.org/10.1002/jps.20508.
- Hofmann M, Winzer M, Weber C, Gieseler H. Limitations of polyethylene glycol-induced precipitation as predictive tool for protein solubility during formulation development. J Pharm Pharmacol. 2018;70:648–54. doi:https://doi.org/10.1111/jphp.12699.
- Sankar K, Hoi KH, Yin Y, Ramachandran P, Andersen N, Hilderbrand A, McDonald P, Spiess C, Zhang Q. Prediction of methionine oxidation risk in monoclonal antibodies using a machine learning method. MAbs. 2018;10:1281–90. doi:https://doi.org/10.1080/19420862.2018.1518887.
- Robinson NE, Robinson AB. Prediction of protein deamidation rates from primary and three-dimensional structure. Proc Natl Acad Sci U S A. 2001;98:4367–72. doi:https://doi.org/10.1073/pnas.071066498.
- Hao P, Adav SS, Gallart-Palau X, Sze SK. Recent advances in mass spectrometric analysis of protein deamidation. Mass Spectrom Rev. 2017 Nov;36(6):677–92. Epub 2016 Jan 13. doi:https://doi.org/10.1002/mas.21491.
- Lechner A, Giorgetti J, Gahoual R, Beck A, Leize-Wagner E, François YN. Insights from capillary electrophoresis approaches for characterization of monoclonal antibodies and antibody drug conjugates in the period 2016–2018. J Chromatogr B Anal Technol Biomed Life Sci. 2019;1122–1123:1–17. doi:https://doi.org/10.1016/j.jchromb.2019.05.014.
- Giorgetti J, D’Atri V, Canonge J, Lechner A, Guillarme D, Colas O, Wagner-Rousset E, Beck A, Leize-Wagner E, François YN. Monoclonal antibody N-glycosylation profiling using capillary electrophoresis – mass spectrometry: assessment and method validation. Talanta. 2018;178:530–37. doi:https://doi.org/10.1016/j.talanta.2017.09.083.
- Azadi P, Heiss C. Mass spectrometry of N-linked glycans. Methods Mol Biol. 2009;534:37–51. doi:https://doi.org/10.1007/978-1-59745-022-5_3.
- Miyanabe K, Yamashita T, Abe Y, Akiba H, Takamatsu Y, Nakakido M, Hamakubo T, Ueda T, Caaveiro JMM, Tsumoto K. Tyrosine sulfation restricts the conformational ensemble of a flexible peptide, strengthening the binding affinity for an antibody. Biochemistry. 2018;57:4177–85. doi:https://doi.org/10.1021/acs.biochem.8b00592.
- Banks DD, Gadgil HS, Pipes GD, Bondarenko PV, Hobbs V, Scavezze JL, Kim J, Jiang XR, Mukku V, Dillon TM. Removal of cysteinylation from an unpaired sulfhydryl in the variable region of a recombinant monoclonal IgG1 antibody improves homogeneity, stability, and biological activity. J Pharm Sci. 2008;97:775–90. doi:https://doi.org/10.1002/jps.21014.
- Mason M, Sweeney B, Cain K, Stephens P, Sharfstein ST. Identifying bottlenecks in transient and stable production of recombinant monoclonal-antibody sequence variants in chinese hamster ovary cells. Biotechnol Prog. 2012;28:846–55. doi:https://doi.org/10.1002/btpr.1542.
- Benner SW, Welsh JP, Rauscher MA, Pollard JM. Prediction of lab and manufacturing scale chromatography performance using mini-columns and mechanistic modeling. J Chromatogr A. 2019;1593:54–62. doi:https://doi.org/10.1016/j.chroma.2019.01.063.
- He F, Woods CE, Trilisky E, Bower KM, Litowski JR, Kerwin BA, Becker GW, Narhi LO, Razinkov VI. Screening of monoclonal antibody formulations based on high-throughput thermostability and viscosity measurements: design of experiment and statistical analysis. J Pharm Sci. 2011;100:1330–40. doi:https://doi.org/10.1002/jps.22384.
- Alfthan K. Surface plasmon resonance biosensors as a tool in antibody engineering. In: biosensors and Bioelectronics. Elsevier Sci Ltd. 1998 Sep 15;13(6):653–63.
- Xu Y, Roach W, Sun T, Jain T, Prinz B, Yu TY, Torrey J, Thomas J, Bobrowicz P, Vásquez M, et al. Addressing polyspecificity of antibodies selected from an in vitro yeast presentation system: A FACS-based, high-throughput selection and analytical tool. Protein Eng Des Sel. 2013;26:663–70. doi:https://doi.org/10.1093/protein/gzt047.
- Hötzel I, Theil FP, Bernstein LJ, Prabhu S, Deng R, Quintana L, Lutman J, Sibia R, Chan P, Bumbaca D, et al. A strategy for risk mitigation of antibodies with fast clearance. MAbs. 2012;4:753–60. doi:https://doi.org/10.4161/mabs.22189.
- Schoch A, Kettenberger H, Mundigl O, Winter G, Engert J, Heinrich J, Emrich T. Charge-mediated influence of the antibody variable domain on FcRn-dependent pharmacokinetics. Proc Natl Acad Sci U S A. 2015;112:5997–6002. doi:https://doi.org/10.1073/pnas.1408766112.
- Beck A, Wurch T, Bailly C, Corvaia N. Strategies and challenges for the next generation of therapeutic antibodies. Nat Rev Immunol. 2010;10:345–52. doi:https://doi.org/10.1038/nri2747.
- Avery LB, Wade J, Wang M, Tam A, King A, Piche-Nicholas N, Kavosi MS, Penn S, Cirelli D, Kurz JC, et al. Establishing in vitro in vivo correlations to screen monoclonal antibodies for physicochemical properties related to favorable human pharmacokinetics. MAbs. 2018;10:244–55. doi:https://doi.org/10.1080/19420862.2017.1417718.
- Kizhedath A, Karlberg M, Glassey J. Cross-Interaction Chromatography-Based QSAR Model for Early-Stage Screening to Facilitate Enhanced Developability of Monoclonal Antibody Therapeutics. Biotechnol J. 2019 2019 Aug;14(8):e1800696. doi:https://doi.org/10.1002/biot.201800696. Epub 2019 Apr 17.Biotechnol J.
- Raybould MIJ, Marks C, Krawczyk K, Taddese B, Nowak J, Lewis AP, Bujotzek A, Shi J, Deane CM. Five computational developability guidelines for therapeutic antibody profiling. Proc Natl Acad Sci U S A. 2019;116:4025–30. doi:https://doi.org/10.1073/pnas.1810576116.
- Jia L, Sun Y. Protein asparagine deamidation prediction based on structures with machine learning methods. PLoS One. 2017 Jul 21;12(7):e0181347. doi:https://doi.org/10.1371/journal.pone.0181347. eCollection 2017.
- Shan L, Mody N, Sormani P, Rosenthal KL, Damschroder MM, Esfandiary R. Developability assessment of engineered monoclonal antibody variants with a complex self-association behavior using complementary analytical and in silico tools. Mol Pharm. 2018;15:5697–710.
- Tomar DS, Kumar S, Singh SK, Goswami S, Li L. Molecular basis of high viscosity in concentrated antibody solutions: strategies for high concentration drug product development. MAbs. 2016;8:216–28. doi:https://doi.org/10.1080/19420862.2015.1128606.
- Fekete S, Veuthey JL, Beck A, Guillarme D. Hydrophobic interaction chromatography for the characterization of monoclonal antibodies and related products. J Pharm Biomed Anal. 2016;130:3–18. doi:https://doi.org/10.1016/j.jpba.2016.04.004.
- Sharma VK, Patapoff TW, Kabakoff B, Pai S, Hilario E, Zhang B, Li C, Borisov O, Kelley RF, Chorny I, et al. In silico selection of therapeutic antibodies for development: viscosity, clearance, and chemical stability. Proc Natl Acad Sci U S A. 2014;111:18601–06. doi:https://doi.org/10.1073/pnas.1421779112.
- Thiagarajan G, Semple A, James JK, Cheung JK, Shameem M. A comparison of biophysical characterization techniques in predicting monoclonal antibody stability. MAbs. 2016;8:1088–97. doi:https://doi.org/10.1080/19420862.2016.1189048.
- E-Notebook. [software]. Waltham (MA (USA)): PerkinElmer, Inc.2019.
- TIBCO Spotfire. Version 10.3.2 [software]. Palo Alto (CA (USA)): TIBCO Software Inc. 2019.
- JMP Software Suite. Version 15 [software]. Cary (NC (USA)): SAS Institute Inc. 2019.
- Heads JT, Adams R, D’Hooghe LE, Page MJT, Humphreys DP, Popplewell AG, Lawson AD, Henry AJ. Relative stabilities of IgG1 and IgG4 Fab domains: influence of the light-heavy interchain disulfide bond architecture. Protein Sci. 2012;21:1315–22. doi:https://doi.org/10.1002/pro.2118.
- Neergaard MS, Nielsen AD, Parshad H, Van De Weert M. Stability of monoclonal antibodies at high-concentration: head-to-head comparison of the IgG1 and IgG4 subclass. J Pharm Sci. 2014;103:115–27. doi:https://doi.org/10.1002/jps.23788.
- Kowalski JM, Parekh RN, Wittrup KD. Secretion efficiency in Saccharomyces cerevisiae of bovine pancreatic trypsin inhibitor mutants lacking disulfide bonds is correlated with thermodynamic stability. Biochemistry. 1998;37:1264–73. doi:https://doi.org/10.1021/bi9722397.
- Schaefer JV, Plückthun A. Transfer of engineered biophysical properties between different antibody formats and expression systems. Protein Eng Des Sel. 2012;25:485–505. doi:https://doi.org/10.1093/protein/gzs039.
- Zhang L, Shi S, Antochshuk V. Closing the gap: counting and sizing of particles across submicron range by flow cytometry in therapeutic protein products. J Pharm Sci. 2017;106:3215–21. doi:https://doi.org/10.1016/j.xphs.2017.06.007.
- Mian IS, Bradwell AR, Olson AJ. Structure, function and properties of antibody binding sites. J Mol Biol. 1991;217:133–51. doi:https://doi.org/10.1016/0022-2836(91)90617-F.
- Samanta U, Pal D, Chakrabarti P. Packing of aromatic rings against tryptophan residues in proteins. Acta Crystallogr Sect D Biol Crystallogr. 1999;55:1421–27. doi:https://doi.org/10.1107/S090744499900726X.
- Makwana KM, Mahalakshmi R. Implications of aromatic-aromatic interactions: from protein structures to peptide models. Protein Sci. 2015;24:1920–33. doi:https://doi.org/10.1002/pro.2814.
- Reason AJ, Weiskopf A, Rathore A. Defining critical quality attributes for monoclonal antibody therapeutic products. BioPharm Int. 2014;27(7):34–43.
- Alt N, Zhang TY, Motchnik P, Taticek R, Quarmby V, Schlothauer T, Beck H, Emrich T, Harris RJ. Determination of critical quality attributes for monoclonal antibodies using quality by design principles. Biologicals. 2016;44:291–305. doi:https://doi.org/10.1016/j.biologicals.2016.06.005.
- Zurdo J, Arnell A, Obrezanova O, Smith N, R GDLC, Gallagher TRA, Michael R, Stallwood Y, Ekblad C, Abrahmsén L, et al. Early implementation of QbD in biopharmaceutical development: A practical example. Biomed Res Int. 2015;2015. doi:https://doi.org/10.1155/2015/605427.
- Saxena V, Panicucci R, Joshi Y, Garad S. Developability assessment in pharmaceutical industry: an integrated group approach for selecting developable candidates. J Pharm Sci. 2009;98:1962–79. doi:https://doi.org/10.1002/jps.21592.
- Ecker DM, Jones SD, Levine HL. The therapeutic monoclonal antibody market. MAbs. 2015;7:9–14. doi:https://doi.org/10.4161/19420862.2015.989042.
- Mirasol F Taking therapeutic antibodies to the next level [Internet]. BioPharm Int.2019 [cited 2020 Jan 27];:14–16. Available from: http://www.biopharminternational.com/taking-therapeutic-antibodies-next-level
- Molecular Operating Environment (MOE). Version 2019.0102 [software]. Montreal (Canada): Chemical Computing Group ULC. 2019.
- Maier JKX, Labute P. Assessment of fully automated antibody homology modeling protocols in molecular operating environment. Proteins Struct Funct Bioinforma. 2014;82:1599–610. doi:https://doi.org/10.1002/prot.24576.
- Labute P. LowModeMD - Implicit low-mode velocity filtering applied to conformational search of macrocycles and protein loops. J Chem Inf Model. 2010;50:792–800. doi:https://doi.org/10.1021/ci900508k.
- Hebditch M, Warwicker J. Web-based display of protein surface and pH-dependent properties for assessing the developability of biotherapeutics. Sci Rep. 2019;9:1969. doi:https://doi.org/10.1038/s41598-018-36950-8.