
ABSTRACT
Characterization of charge heterogeneity in monoclonal antibodies (mAbs) is needed during developability assessment and downstream development of drug candidates. Charge heterogeneity can come from post-translational modifications like deamidation, isomerization, and sialylation. Elucidation of charge variants with mass spectrometry (MS) has historically been challenging. Due to the nonvolatility and high ionic strength of conventional buffer systems, labor-intensive offline fractionation followed by MS analysis is routinely used. Here, we describe an alternative strategy that directly couples strong cation exchange (SCX) chromatography to high-resolution Orbitrap MS for online native MS analysis (SCX-MS). A combined pH and salt gradient was used for universal separation of mAbs from a wide range of pI values (6.38 ~ 9.2), including infliximab (Remicade®, chimeric IgG1/kappa), NISTmab (humanized IgG1/kappa) and trastuzumab (Herceptin®, humanized IgG1/kappa), without tailoring of chromatographic profiles. Liquid chromatography and MS parameters were optimized to achieve high-quality spectra and enhanced detection of low abundant species under high flow rate conditions. Genedata Expressionist, a vendor agnostic software, was used for data processing. This integrated strategy allows unbiased characterization of numerous charge variant species and low molecular weight fragments (<0.05%) without post-column flow splitting. The application was further expanded with middle-up approaches for subdomain analysis, which demonstrated the versatility of the strategy for analysis of various construct types. With our analysis of mAbs during developability assessment and forced degradation studies, which aimed at assessing potential critical quality attributes in antibody drug molecules, we provide, for the first time, direct visualization of molecular alterations of mAbs at intact level. Furthermore, strong correlation was observed between this novel MS approach and analysis by capillary isoelectric focusing.
Introduction
The rapid rise of antibody-based therapies has dramatically changed the treatment of diseases, as well as the pharmaceutical industry. In 2017, eight of the top 10 drugs by sales were monoclonal antibodies (mAbs).Citation1 MAbs are complex molecules that are amenable to a variety of enzymatic and chemical post-translational modifications (PTMs), including oxidation, glycation, deamidation of asparagine, C-terminal lysine truncation, N-terminal pyroglutamate formation, and complex glycosylations. Many of these modifications are considered critical quality attributes (CQAs) since they can affect drug efficacy and may induce immunogenicity.Citation2 These modifications are first identified at the discovery stage during antibody sequence selection, which is the context of this study, and are later confirmed during development. Due to their unique characteristics, regulatory agencies require close monitoring of CQAs during development and manufacturing to assess product quality.Citation3
Because PTMs often lead to alteration of the molecular surface charge distribution, they can be analyzed by charge sensitive methods. Capillary isoelectric focusing (cIEF) and cation exchange chromatography (CEX) are commonly used for the characterization of protein charge variants.Citation4-Citation7 Using a pH gradient and electric field, cIEF separates charge variants based on the intrinsic charge of the molecule. In CEX, either salt or pH gradients have been successfully applied for the characterization of charge variants.Citation8,Citation9 The salt gradient increases the ionic strength of the buffer condition while keeping the pH of the buffer constant. The pH gradient, on the other hand, augments the pH of buffer from low to high while maintaining the ionic strength of the buffer constant. In traditional charge variant analysis, peaks from ion chromatography are isolated for further offline MS characterization, including intact mass, peptide mapping, and glycan profiling, which are labor-intensive and time-consuming procedures.Citation5,Citation10 In addition, offline sample fractionation based on a UV chromatogram is biased toward UV-visible modifications and may overlook species that do not exhibit distinct UV peaks. Therefore, direct hyphenation of CEX to mass spectrometry (MS) is of great interest for unbiased, in-depth, and high throughput characterization of charge variants.
Traditional charge-based separation methods like CEX use nonvolatile buffer systems that are incompatible for direct coupling to MS. To circumvent this issue, several attempts have been made to implement the online hyphenation of two-dimensional liquid chromatography (2D LC) to MS.Citation11-Citation13 In this setup, CEX and reversed phase (RP) were used in first- and second-dimension LC, respectively. The separation of charge variant peaks is achieved with nonvolatile salts in the CEX dimension whereas RPLC offers online detection of individual charge variant species with the use of MS-compatible solvents. Although this method has been successfully used for characterizations and comparisons of several antibodies and biosimilars, only limited fractions of interests can be selected and eluted into the RP dimension for the MS analysis. Therefore, low abundant charge variants may be missed if they are invisible in the first dimension and are not selected for the detection in the second dimension. In addition, the proteins are denatured during the RP separation, which destroys the tertiary structure information and generates complex highly charged mass spectra.
With the exploration of volatile buffer systems, substantial progress was achieved toward the hyphenation of CEX and MS. Muneeruddin et al. successfully demonstrated the use of a salt gradient with increasing concentrations of ammonium acetate to characterize stressed interferon-β and pegylated proteins.Citation14,Citation15 Talebi et al. described the use of pH gradient by using ammonium hydroxide for the separation of the charge variants of three mAbs,Citation16 but, despite the use of 20% methanol to enhance ionization efficiency, the spectra were not successfully deconvoluted due to the low-resolution instrumentation and insufficient desolvation. Combining improved mass resolution and desolvation, Fussl et al. reported the characterization of mAb charge variants of different isoelectric point (pI) with a well-controlled pH gradient on a MabPac SCX-10 RS column.Citation17 The spectra quality was significantly improved compared to previous studies, but extensive pH gradient optimizations were needed for mAbs with different pI values. In 2017, Leblanc et al. used an ammonium formate and ammonium acetate-based pH and salt gradient for the characterization of IdeS-digested aged mAb.Citation18 With the implementation of a post-column splitter, the sensitivity was further improved by Yan et al. on a YMC-BioPro SCX column for the detection of minor variants.Citation19 This method has been applied to multiple mAbs with a wide range of pI values, but the instrumental setting is elaborate due to the inclusion of the post column splitter and nanospray source.
In this study, we describe an integrated platform that couples SCX chromatography to high-resolution Orbitrap MS for online native MS analysis. Both pH and salt gradients were used for universal separation of mAbs from a wide range of pI values (6.38 ~ 9.2) without chromatogram tailoring. In order to ensure efficient desolvation under high flow rate conditions, extensive optimizations of the LC and MS parameters were conducted to achieve high-quality spectra and enhanced detection of low abundant species. Genedata Expressionist, a vendor agnostic software, was used for data processing. This integrated strategy allows unbiased characterization of different charge variant species and low molecular weight (LMW) fragments (~0.05%) without post-column flow splitting. In comparison to native size-exclusion chromatography (SEC), better separation and detection of LMW species was also achieved. The application was further expanded with IdeS digestion for subdomain analysis. Analysis of trastuzumab (Herceptin®) stressed samples by SCX-MS revealed molecular alterations at the intact level for the first time. In addition, the charge variant profiles from cIEF and SCX-MS were in good agreement.
Results
The chromatographic and MS conditions for the hyphenation of SCX and MS were established using the NISTmAb, a universal standard reference material for mAbs, and further used in a generic method for the analysis of mAbs from a wide pI range.
Establishment of chromatographic conditions
Different mAbs may span a wide range of pI values, the situation is more complicated with varied extent of charge variants. To characterize charge heterogeneity of mAbs with different pI values, it is of great importance to establish a universal method which is applicable for all pH ranges of interest without meticulously tuning the gradient. The utilization of volatile salts can meet the need for online hyphenation of SCX to mass spectrometer. The relatively low buffering capacity of the MS-compatible buffers, however, limits the separation of minor charge variants from the main species and the delivery of equally good performance for antibodies with different pI values. Inspired by the recent publications,Citation18-Citation22 we envision that the use of a salt gradient along with the pH gradient would provide a synergistic effect, generating a universal method for improved charge variants separation of mAbs spanning a wide range of pI values. MabPac SCX-10 RS column was selected for the study due to its minimal buffering capacity against pH change, high resolution, good reproducibility, and high recovery rate. The broad applications of this column as reported in the literature (charge variant characterizations using MS compatible and MS incompatible buffers) also make it a suitable tool for comparison of the new SCX salt-pH gradient method we developed with historical results from established buffer systems.Citation17,Citation23-Citation25
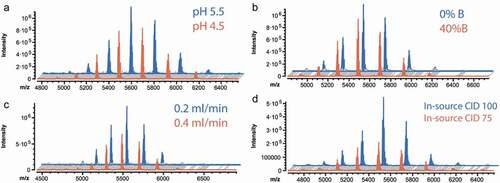
Antibodies may undergo modifications or degradation under high or low pH. The instability of protein modifications (e.g., hydrolysis of succinimide under alkaline pH) has also been reported by different groups.Citation26,Citation27 To maintain the mAbs in native states and prevent the loss of critical PTMs during analysis, pH 7.4 was chosen as the upper limit of buffer pH. Two lower limits of buffer pH (4.6 vs 5.6) were investigated in this work to understand which gradient profile provides better separation of the charge variants and maintains the native status of the antibodies, while generating the highest MS signal at the same time. As shown in , better performance with improved signal intensity was obtained when the gradient started at pH 5.6. The initial percent of buffer B is another important parameter that affects the starting pH, the native condition of mAbs and the analysis time. The use of high percent of buffer B to start the gradient may enhance the separation of minor species and shorten the analysis time. However, the native status of proteins can be disrupted resulting in decreased intensity of analytes. Our results showed better performance of the method when the gradient started at 0% B compared to 40% B ().
Figure 1. Optimization of starting pH (a), initial gradient (b), flow rate (c), source condition (d) to improve low abundant species detection
Optimizations for improved detection of minor species
The successful online hyphenation of SCX to MS not only requires efficient separation of charge variants but also the direct detection of different analytes, including high and low abundant species. An optimal desolvation condition is key for the successful transfer of ions into the MS instrument and to improve the sensitivity for the detection of low abundant species. In order to improve desolvation, we first optimized the flow rate to achieve high MS signal intensity. shows the MS obtained with a flow rate of 0.4 mL/min classically used in LC-MS runs,Citation17,Citation19,Citation25 which reveals an MS intensity of 7e5. The flow rate reduction to 0.2 mL/min provided 1.9-fold increase in the MS peak intensity. The improved signal intensity was attributed to better electrospray ionization efficiency at a lower flow rate, which agrees with previous study.Citation28 Flow rates lower than 0.2 mL/min were also investigated, but these did not provide improved sensitivity. The in-source collision-induced dissociation (CID) is another useful parameter for desolvation improvement and removal of adducts. Our results showed that 100 eV as in-source CID provided the best signal for NISTmAb. shows the comparison of two different energies, 75 vs 100 eV; in-source CID set at 100 eV showed significant signal improvement over 75 eV (2.1-fold increase). The effects of other source parameters (e.g., spray voltage, capillary temperature, sheath gas, Aux gas) on the desolvation were also investigated and optimized. The use of optimal parameters allowed the identification of various low abundant species, as discussed below.
Benchmark for mAbs with different pI values
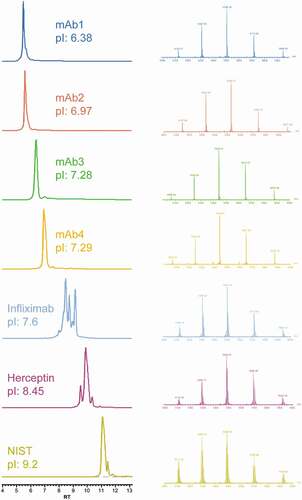
After optimization of the chromatographic and MS parameters, the new online SCX-MS method was tested for the separation of charge variants from mAbs with different pI values. A panel of seven therapeutic antibodies (four from internal sources and three commercial mAbs) with pI values ranging from 6.4 to 9.2 were evaluated. As shown in , peaks from charge variants were chromatographically separated without individual gradient optimization. In addition, even though three of the seven mAbs have pI values higher than the pH of buffer B, no partial elution or missing peaks were observed. The strategy of using combined pH and salt gradients enabled charge variant analysis by MS without any step-wise gradient change. The use of high-resolution and accurate mass data also allowed confident assignment of charge variant peaks from various antibodies with low mass deviation (Table S1).
Figure 2. Charge variants separation of seven mAbs (different pI) using the SCX-MS method (Left), and mass spectra of main species (Right)
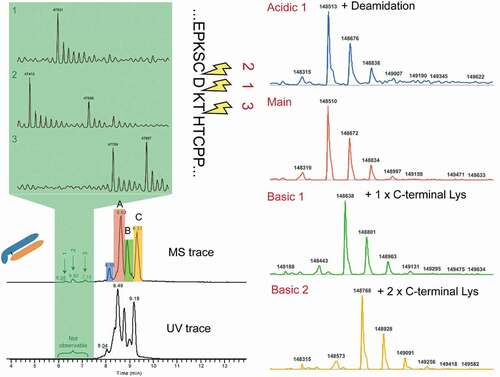
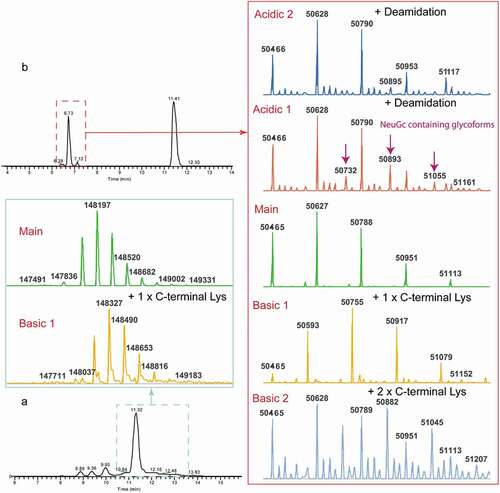
Infliximab (Remicade®) is a well-studied mAb that has nearly equal amount of lysine variants. It has been characterized by a variety of analytical techniques, including traditional capillary electrophoresis (CE) separation, CE-MS, and other SCX-MS method.Citation17,Citation29,Citation30 The analysis of infliximab by SCX-MS showed three main peaks with baseline resolution in addition to other low abundant peaks, indicating the presence of acidic and basic charge variants. We compared our infliximab charge variants profile with results reported in the literature, and, as shown in Figure S1, a comparable or higher resolution was achieved with our method. Notably, the experiment was conducted without gradient optimization or use of MS-incompatible additives. To further investigate the identity of the observed charge variant peaks, the base peak chromatogram of infliximab was averaged and deconvoluted. Deconvolution of each charge variant mass spectrum rendered multiple masses, corresponding to different glycan forms. To reduce the complexity, the most abundant glycoform was used as the representative of each charge variant. Based on the sequence-predicted MW, peak A was assigned to the main unmodified specie, while peak B and peak C correspond to one and two unprocessed Lys residues at the heavy chain (HC) C-terminus, respectively (). In addition to the major peaks corresponding to the lysine variants, a minor acidic variant that exhibited a mass increase of 3 Da relative to peak A was also identified. As expected, deamidation introduces a negative charge to the protein, which reduces its pI value and allows the separation of acidic species from the main peak.
Figure 3. Simultaneous identifications of charge variants and low molecular impurities in infliximab
Simultaneous monitoring of LMW species
In addition to the charge variants described above, other early-eluting LMW species were observed at 47415, 47530, 47659, 47759, and 47897 Da (, highlighted in green).
Based on their MW, these acidic variants were assigned to truncated forms of the mAb. Cleavage above the hinge region has been previously identified as a degradation hotspot for other mAbs but never reported for infliximab.Citation31,Citation32 Notably, no obvious peaks were identified in the UV trace due to their low abundance (0.05%~0.4%, Table S2). Without direct hyphenation of SCX to MS, these LWM species would have been missed. Due to their good ionization and desolvation, these peaks were easily identified by MS. This analysis exemplifies the use of the SCX-MS method for the sensitive and unbiased characterization of native intact charge variants and LMW impurities simultaneously.
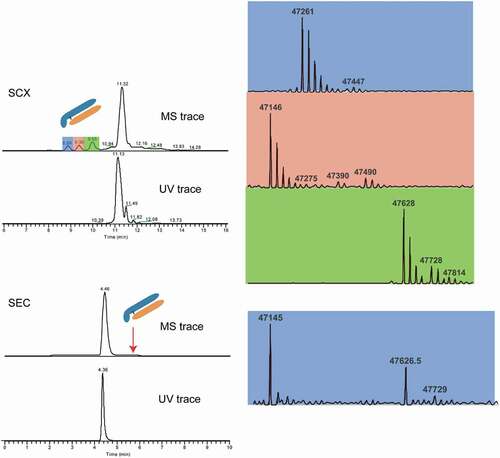
In addition to infliximab, mAb fragments were also observed for the NISTmAb, which have been previously reported in the literatureCitation19,Citation25 (). The masses attributed to these peaks are 47146, 47261, and 47628 Da. Based on the accurate mass, these molecules were matched to the protein fragmentation at similar cleavage sites as described above for infliximab. To evaluate the performance of SCX-MS for the detection of LMW impurities, NISTmAb was also subjected to SEC-MS analysis, a powerful technique routinely used for the assessment of product-related impurities (LMWs and HMWs). As shown in , only one peak corresponding to the main species of NISTmAb was observed in both UV and MS trace. However, the 3-dimensional visualization of the raw data file in Genedata ExpressionistCitation10,Citation33 enabled the visualization of two LMW species coeluting at 5.65 min (Figure S2). Spectra deconvolution of these two LMW species revealed peaks at 47145 and 47627 Da, corresponding to 2 of 3 peaks identified in SCX-MS analysis. In comparison to SEC-MS, SCX-MS allowed better chromatographic separation and enhanced detection of LMW species.
Figure 4. Detection of low molecular weight impurities in the NISTmAb (upper panel), and the comparison of the results obtained from native SEC-MS (lower panel)
The main and charge variant peaks for NISTmAb were also averaged and deconvoluted (). The main peak corresponds to the antibody with processed C-terminal lysine residues on both heavy chains. Due to the high resolution of our method, the different charge variants elute separately. Therefore, eight glycoforms were observed and successfully annotated. The basic peak was assigned as the antibody with one unprocessed heavy chain C-terminal lysine based on the delta mass of the selected glycoform to the main species.
Figure 5. Charge variants analysis of intact (a) and IdeS digested (b) NISTmAb
Ultrahigh chromatographic resolution with subdomain analysis
Characterization of mAbs has always been challenging due to their large size and complex PTM compositions. To further enhance the characterization of the NISTmAb, the sample was treated with FAbRICATOR® (IdeS) to cleave the molecule into subunits before analysis. IdeS treatment cleaves the HC in the hinge region to generate the Fc/2 and F(ab’)2 fragments, which minimizes the cumulative effect of multiple PTMs and improves the chromatographic separation. The reduced MW also enables better ionization efficiency and accurate assignment of MW. By using the same generic SCX-MS method, two well-separated groups were identified in the chromatogram, corresponding to the charge variants for F(ab’)2 and Fc, respectively (). The main peak of the first group of eluants resembles the glycosylation pattern of the intact molecule, with the masses confidently assigned as the Fc. Due to hydrophobic interactions, two Fc/2 remain associated under the native condition, which is in good agreement with previous publications.Citation18,Citation19 Notably, in addition to the Basic 1 charge variant species, three minor variants were also observed in the study. The deconvolution of the two acidic variant peaks revealed the masses that have minimal difference to the mass peaks from the main peak, which are likely caused by asparagine deamidation. Additional peaks at 51096, 51258, 51420, 51582 Da were observed in Acidic 2 peak which resembles the glycoform distribution in the main species (Figure S3). Based on the molecular information, a mass increase of ~307 Da was observed in comparison to G1 F, indicating the presence of NeuGc (G1FS). Since sialyations could induce potential immunogenicity, the detection and monitoring of this glycoform is of great importance for therapeutic development.Citation2,Citation34,Citation35 Surprisingly, NISTmAb carrying this modification at the intact level has only been reported once in the literature, despite the extensive efforts devoted to studying this molecule as a model antibody.Citation19 Apart from G1FS, three other NeuGc containing N-glycan forms were also observed in “Acidic 1” peak, like (Fuc)1(Hex)4(GlcNac)3(NeuGc) with mass of 50732. These glycoforms were present at low abundance, which only become visible when they are separated from the main species. One basic peak (Basic 2) was also uniquely identified after IdeS digestion, which corresponded to antibody with two unprocessed heavy chain C-terminal lysine.
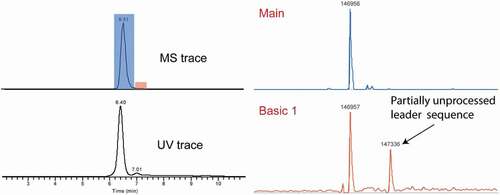
Other basic variants
The presence of partial leader sequence could potentially cause immunogenicity, as it does not exist in human endogenous IgG.Citation2 This modification has been reported in the literature using offline fractionation with WCX- or cIEF-based methods, but not in any of the online SCX-MS papers.Citation4,Citation36,Citation37 In this study, the high chromatographic selectivity of mAb3 revealed a basic peak after the main species. Deconvolution of the highlighted peak in red in rendered the peak with MW of 147336 Da, which is 379 Da higher than the main peak. This MW corresponds to the partial leader sequence (+GVHS) on the heavy chain. The presence of partial leader sequence was not only suggested at the intact level, but also confirmed via subunit analysis after IdeS digestion. As shown in Figure S4, a mass addition of 379 Da was identified in the F(ab’)2 fragment, which is consistent with the mass difference (addition of 4 amino acids from leader sequence) observed at the intact level. Apart from the peak at 96941 Da, a minor peak with MW of 96886 Da was also identified. The +324 Da shift was correlated with addition of 3 amino acid from leader sequence (+VHS), further confirming the expected amino acid sequences for the partially processed leader sequence.
Figure 6. Detection of partially unprocessed leader sequence in mAb 3
Stressed samples analysis during developability assessment
We also applied the SCX-MS method using the new pH-salt gradient to monitor molecular changes to the intact antibody under different stress conditions. Trastuzumab from six different stress conditions was characterized by online SCX-MS. The charge variant profiles acquired by cIEF method were used for the comparison. displays SCX chromatograms of the samples under different stressed conditions, and the percentage of different charge variant species are listed in . For the control sample, acidic variants represent 15.7% of the total UV area. The main peak eluting at 9.75 min accounts for 74.8% and the basic peaks make up for 9.5%. After incubating the sample under low pH for 1 day, the main peak decreases (74.6%), the acidic peak remains the same while the basic peak increases (9.6%) slightly. After incubation at low pH for 7 days, the percent of the main peaks was further reduced while the acidic peak also reduced.
Table 1. Percentage of charge variant species under different stress conditions
Figure 7. Comparison of charge variant separations under different stress conditions by SCX-MS (Left) and cIEF (Right)
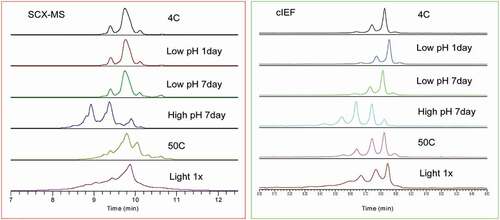
An opposite trend was observed when the sample was incubated under high pH for 7 days. A significant amount of the main peak was converted to the acidic species and the entire chromatogram shifted to the left. Under high temperature (50ºC) and light stress, the resolution between the acidic, main and basic species became elusive and charge variant peaks were not well separated from each other, most likely due to the cumulative effect of multiple PTMs. However, the high-resolution MS data enabled the identification of various charge variant species, as shown in and Figure S5-6.
Discussion
Here, we present an online SCX-MS method for charge variant analysis of mAbs with a wide range of pI values. Our study uses combined pH and salt gradients to enable the universal separation of charge variant peaks of different antibodies spanning a wide range of pI values. Ammonium acetate/ammonium bicarbonate buffers with pH 5.6–7.4 were used in the study, which provides several benefits. First, use of a volatile buffer system enables direct MS detection capability without extensive and tedious offline fractionation and buffer exchange procedures. Second, this approach allows the ultrasensitive and unbiased identification of charge variant species as well as LMW fragments despite their low abundance in the UV trace (0.05%~0.4%). Third, the tertiary structure of the antibodies can be preserved during the analysis. The characterization of antibodies in the native conditions shifts the charge envelope to higher m/z with lower noise level. The presence of fewer charge states for the deconvolution not only simplifies the deconvolution algorithm, but also reduces the possibility of overlapping charge envelope from different ion species. We combined the salt and pH gradients for enhanced separation despite the weak buffering capacities of the MS-compatible salts. This dual separation mechanism allows the elution and separation of charge variant species beyond the upper pH limit of the buffer system. It also allows the universal separation of charge variant peaks without optimizations based on the pI value of the antibody. This system was tested using seven different antibodies with pI values from 6.38 ~ 9.2, and good separation of charge variant were achieved for all of them. The elution profile of the charge variants was compared with standard charge variant characterization methods (CE and cIEF), and comparable results were obtained. However, the SCX method coupled to high resolution MS also provides MW information, which enables peak identifications. Good reproducibility between replicates was also demonstrated in both intact and subunit analysis (Figure S7).
The establishment of a sensitive MS detection method is the key to enabling online elucidation of charge variant peaks, especially the minor variant species that are present at low abundance. Under regular flow, an effective desolvation setting plays an important role in allowing large biomolecules to be transmitted efficiently into the mass spectrometer, and subsequently be detected accurately. In order to provide enough desolvation for efficient ion detection without diverting the flow, a number of LC and MS parameters were investigated to improve the signal intensities of the analytes while maintaining the molecules in native conditions. After a series of effective optimizations, the signal intensity was significantly improved, which enabled the systematic characterizations of the main peak, the minor charge variant peaks (e.g., deamidation, C-terminal lysine truncation, aspartate isomerization, succinimide formation, unprocessed leader sequence, and complex glycosylation) and LMW impurities as low as 0.05%. To further reduce the chromatographic complexity caused by the cumulative effect of multiple PTMs, the antibodies were also treated with IdeS digestion to separate the F(ab’)2 from the Fc region. Notably, the same SCX-MS method was used in the study without any tuning, which highlights the universal applicability of the method for a wide scope of analysis. By applying this native digestion technique, we were able to dig deeper into the proteoforms and identify charge variant species at lower abundance. Unique glycan-containing antibodies, which were rarely reported before, were also identified.
The successful elucidation of the identities of each charge variant species is not possible without a powerful data interpretation software. Here, a vendor agnostic software, Genedata Expressionist, was used for the analysis.Citation10,Citation33,Citation38 Four types of deconvolution modes are available in Genedata expression, including fully automated, semi-automated, spectral deconvolution, and time-resolved deconvolution. For the first three modes, the mass spectra were averaged across specific time range, and different charge envelopes were deconvoluted through either a manual or automated process. This approach differentiates the real signal from background noise and improves the quality of mass spectra for deconvolution. The automation of peak detection and analysis also enables high throughput screening. However, retention time data for different species were lost during deconvolution, and it induces the potential to bury information for critical minor variants under predominant species. In contrast, time-resolved deconvolution allows scan-by-scan deconvolution, which not only retains retention time information for all species, but also enables the detection of lower abundant variants coeluting with the main species, a similar function like the sliding window deconvolution feature from BioPharma Finder.Citation17,Citation25 The versatility of the software provides in-depth and unbiased characterization of different charge variants for online SCX-MS analysis. Fast and intuitive visualization of charge variant species can be also achieved with the use of a 3-dimensional map (m/z vs. time vs. intensity).
Since this technique is highly effective for the detection and elucidation of various charge variant species, we used it to investigate the molecular alteration of trastuzumab under different stressed conditions. Deamidation introduces a negative charge to the protein, which reduces its pI value and leads to early elution (acidic peak) in comparison to main species. Isomerization, on the contrary, results in an increased retention time. They cannot be differentiated from the main species in the regular LC-MS analysis because they either render no mass change (isomerization) or the small mass difference (deamidation) cannot be resolved with the current mass resolution. However, the implementation of SCX allows separation of the charge variant species from the main peak. Given the high mass accuracy of our data, we were able to confidently differentiate these PTMs from the main species in both intact and subunit analysis. For the control sample, a small percentage of acidic and basic variant peaks were observed. The acidic peak has a mass addition of 1 Da higher than the main species, likely caused by asparagine deamidation. The solvent accessibility of N30 T in the light chain has been well characterized by peptide mapping and other techniques,Citation39,Citation40 which is in high accordance with our data. The basic peaks were also identified as low abundance of aspartate isomerization and succinimide formation. With the implementation of low pH, a gradual decrease of acidic variant species was observed while the basic variant peaks increased. As expected, a high percentage of acidic variants was observed when the antibody was incubated under high pH for 7 days. Our data suggested that the asparagine deamidation tended toward the formation of iso-aspartate and succinimide under the acidic conditions while the deamidated form is more pronounced under the high pH. The antibody underwent more extensive modifications under the extreme conditions like 50ºC incubation and light stress (1X), and sample complexity was also captured in both native analysis and IdeS digest ( and Figure S5-6). Our data were also compared with previous publications using either offline SCX or WCX fractionation, and a comparable or slightly lower separation was observed.Citation41,Citation42 To further improve the separation, subunit analysis can be performed, which minimizes the cumulative effect of multiple PTMs and improves the chromatographic separation, as shown in . Additional chromatographic change could also facilitate the separation if necessary. One of the key advantages of our method is that it is significantly faster than offline fractionation followed by peptide mapping. A comprehensive understanding of the modification sites can be further achieved by offline fractionation followed by peptide mapping analysis.Citation18,Citation19,Citation25,Citation39,Citation40
In summary, it is critical to identify and monitor charge variant species from the early phases of developability and candidate selection during the discovery stage, and throughout the antibody development and manufacturing. Our study uses combined pH and salt gradients to enable the universal separation of charge variant peaks of different antibodies spanning a wide range of pI values, which is very beneficial for unbiased, in-depth and high-throughput characterization of various charge variant species and LMW fragments. Optimizations of various LC and MS parameters significantly improve the sensitivity of the method and allow the direct identification of minor variant species and LMW fragment (<0.05%) without flow diversion. This method offers the charge variants profile of the antibodies in the intact level and provides novel information on antibody heterogeneity. The technique was also applied to investigate the degradation pathway of an antibody under different stress conditions. We believe this method can be promptly integrated into biopharmaceutical characterization workflows, as well as in biosimilar analysis.
Materials and methods
Antibodies
Infliximab (Remicade®) is an approved chimeric IgG1/kappa therapeutic antibody developed by Janssen. The batch used in this study was produced in house at Merck & Co., Inc., in a stable CHO cell line. Briefly, cell culture supernatant was purified via protein A chromatography followed by polishing steps (e.g., anion-exchange chromatography)
Trastuzumab is an approved humanized IgG1/kappa therapeutic antibody sold by Genentech under the trade name Herceptin®. The batch used in this study was purchased from the Pharmacy.
NISTmAb (humanized IgG1/kappa) was obtained from the National Institute of Standards and Technology (Gaithersburg, MD).
All the other mAbs were produced at Merck & Co., Inc. in transient transfection in CHO-Expi cells (Life Technologies). Briefly, cell culture supernatant was purified via protein A chromatography followed by polishing steps (e.g., preparative size-exclusion or anion-exchange chromatography) to achieve purity >95%.
Sample preparation
Samples were diluted to a final concentration of 5 mg/mL using 50 mM ammonium bicarbonate. Deglycosylated samples were obtained through treatment with PNGase F (P0705 S, New England BioLabs) at 37°C for 2 h. For subdomain analysis, samples were incubated with FabRICATOR reagent (A0-FR1-020, Genovis) at 37°C for 2 h.
Stressed studies during developability assessment
Trastuzumab was subjected to a variety of stressed conditions, including low pH for 1 or 7 days, high pH for 7 days, 50ºC and light. The same amount of the samples was injected for online SCX-MS analysis.
Stability and Forced Degradation Stress Studies were done following previous literature.Citation43 Samples were buffer exchanged to 20 mM sodium acetate (pH5.5) and subject to the following stress studies, followed by analysis using cIEF.
Low pH hold
For each time point, 1 mg of antibody at 2 mg/mL had its pH adjusted to pH 3.5 by addition of 0.5 N hydrochloric acid. Each sample was incubated at room temperature for up to 1day, and 7 days protected from light. At each analysis time point sample buffer was exchanged into 20 mM sodium acetate, pH 5.5, 9% sucrose using a 5 ml Zeba column (Thermo Fisher Scientific). Aliquots were made from each time point and stored at −80°C until analysis.
High pH hold
For each time point, 2 mg of antibody at 2 mg/mL had its pH adjusted to pH 10.0 by addition of 0.5 N sodium hydroxide. Each sample was incubated at room temperature for 7 days protected from light. At each analysis time point sample buffer was exchanged into 20 mM sodium acetate, pH 5.5, 9% sucrose using a Zeba column. Aliquots were made from each time point and stored at −80°C until analysis.
Temperature hold
For each time point, 2 mg of antibody at 2 mg/mL was incubated at 50°C protected from light. Samples were incubated for 7 days at 50°C. At each analysis time point sample buffer was exchanged into 20 mM sodium acetate, pH 5.5, 9% sucrose using a Zeba column. Aliquots were made from each time point and stored at −80°C until analysis.
Light stress
For each condition, 2 mg of antibody at 2 mg/mL was placed in a reusable quartz cuvette. Samples were exposed to 1x light (200 W-h/m2 ultraviolet and 1200 k-lux visible light). 2 mg of antibody were held in the 1x light condition wrapped in aluminum foil. Aliquots were made from each condition and stored at −80°C until analysis.
Determination of isoelectric point by cIEF
To determine the pI and charged species by cIEF, samples were diluted to 0.2 mg/mL in buffer containing 0.35% methyl cellulose, 3 M urea, 1% Pharmalyte 3–10 (GE Healthcare), 0.5% Pharmalyte 5–8, 0.5% Pharmalyte 8–10, 0.5% pI marker 5.85 (Protein Simple) and 0.5% pI marker 10.1. Samples were run on an iCE3 (Protein Simple) using fluorocarbon-coated capillary focusing for 1 minute at 1500 V followed by 8 minutes at 3000 V. Data were exported into and integrated using Empower 2 (Waters).
SCX-MS
Experiments were performed on a Thermo Scientific Q Exactive HF-X quadrupole-Orbitrap mass spectrometer (Thermo Fisher Scientific, San Jose, CA) coupled to a Dionex UltiMate 3000 UPLC system. Column compartment was held at 45ºC during the experiments and a MABPac SCX-10 RS 2.1 mm × 50 mm column (5 µm) (082675, Thermo Fisher Scientific) was used for all separations. Buffer A was composed of 20 mM ammonium acetate (pH adjusted with acetic acid), and buffer B was composed of 140 mM ammonium acetate, 10 mM ammonium bicarbonate, pH 7.4. Three different flow rates (0.1 ml/min, 0.2 ml/min, 0.4 ml/min) were tested in the study. The gradient was held at either 100% A or 60% A for 2 min, followed by a linear curve to 100% B in 12 min. The gradient stayed at 100% B for 3 min for column flushing and returned to the initial gradient. It was then re-equilibrated for 6 min before the next injection. The total run time was less than 25 min. Data acquisition was performed with both UV (280 nm) and MS. 50micrograms of antibodies were injected for the analysis.
For the mass spectrometric data acquisition, the optimized parameters are shown below. The resolution was set at 30 000, spray voltage was set as 3.7 kV, the capillary temperature was 300ºC, High Mass Range mode was turned on, the in-source CID was set as 100, the S-Lens RF was set as 200, the higher-energy collisional dissociation trapping gas pressure was set at 2. Mass spectra were acquired from 2500 to 8000 m/z for intact mAb analyses and 1000 to 8000 m/z for subdomain analyses. The raw data were processed with Genedata. Detailed descriptions of data processing were shown below.
Data processing
Raw data were imported to Genedata Expressionist without any prior data conversion. An adapted and application dependent workflow that includes retention time and m/z restriction, UV peak detection, spectrum smoothing, protein deconvolution and annotation was established. The data were analyzed with three types of deconvolution modes, semi-automated deconvolution, spectral deconvolution and time-resolved deconvolution. In semi-automated deconvolution, UV peaks were aligned to MS peaks first, followed by peak detection based on UV trace. The mass range was set to 140 000–150 000 in the case of intact analysis, 45 000–55 000 and 90 000–100 000 in the case of subunit analysis. After optimization of the workflow, this process was run automatically which provides quick screening of the charge variants in the file. In spectral deconvolution, spectra were averaged across specific retention time and m/z range, followed by deconvolution of the averaged spectra. In time-resolved mode, deconvolution was performed scan-by-scan, which not only retains retention time information for all species, but also enables the detection of lower abundant variants coeluting with the main species.
Disclosure of potential conflicts of interest
No potential conflicts of interest were disclosed.
Supplemental Material
Download MS Word (1.6 MB)Supplemental material
Supplemental data for this article can be accessed on the publisher’s website.
References
- Walsh G. Biopharmaceutical benchmarks 2018. Nat Biotechnol. 2018;36(12):1136–12. doi:https://doi.org/10.1038/nbt.4305.
- Xu Y, Wang D, Mason B, Rossomando T, Li N, Liu D, Cheung JK, Xu W, Raghava S, Katiyar A, et al. Structure, heterogeneity and developability assessment of therapeutic antibodies. MAbs. 2019;11(2):239–64. doi:https://doi.org/10.1080/19420862.2018.1553476.
- Berkowitz SA, Engen JR, Mazzeo JR, Jones GB. Analytical tools for characterizing biopharmaceuticals and the implications for biosimilars. Nat Rev Drug Discov. 2012;11(7):527–40. doi:https://doi.org/10.1038/nrd3746.
- Neill A, Nowak C, Patel R, Ponniah G, Gonzalez N, Miano D, Liu H. Characterization of recombinant monoclonal antibody charge variants using OFFGEL Fractionation, weak anion exchange chromatography, and mass spectrometry. Anal Chem. 2015;87(12):6204–11. doi:https://doi.org/10.1021/acs.analchem.5b01452.
- Sandra K, Vandenheede I, Sandra P. Modern chromatographic and mass spectrometric techniques for protein biopharmaceutical characterization. J Chromatogr A. 2014;1335:81–103. doi:https://doi.org/10.1016/j.chroma.2013.11.057.
- Rea JC, Freistadt BS, McDonald D, Farnan D, Wang YJ. Capillary ion-exchange chromatography with nanogram sensitivity for the analysis of monoclonal antibodies. J Chromatogr A. 2015;1424:77–85. doi:https://doi.org/10.1016/j.chroma.2015.11.002.
- Vanam RP, Schneider MA, Marlow MS. Rapid quantitative analysis of monoclonal antibody heavy and light chain charge heterogeneity. MAbs. 2015;7(6):1118–27. doi:https://doi.org/10.1080/19420862.2015.1085145.
- Fekete S, Beck A, Fekete J, Guillarme D. Method development for the separation of monoclonal antibody charge variants in cation exchange chromatography, Part II: pH gradient approach. J Pharm Biomed Anal. 2015;102:282–89. doi:https://doi.org/10.1016/j.jpba.2014.09.032.
- Fekete S, Beck A, Fekete J, Guillarme D. Method development for the separation of monoclonal antibody charge variants in cation exchange chromatography, Part I: salt gradient approach. J Pharm Biomed Anal. 2015;102:33–44. doi:https://doi.org/10.1016/j.jpba.2014.08.035.
- Griaud F, Denefeld B, Lang M, Hensinger H, Haberl P, Berg M. Unbiased in-depth characterization of CEX fractions from a stressed monoclonal antibody by mass spectrometry. MAbs. 2017;9(5):820–30. doi:https://doi.org/10.1080/19420862.2017.1313367.
- Alvarez M, Tremintin G, Wang J, Eng M, Kao YH, Jeong J, Ling VT, Borisov OV. On-line characterization of monoclonal antibody variants by liquid chromatography-mass spectrometry operating in a two-dimensional format. Anal Biochem. 2011;419(1):17–25. doi:https://doi.org/10.1016/j.ab.2011.07.033.
- Stoll DR, Harmes DC, Danforth J, Wagner E, Guillarme D, Fekete S, Beck A. Direct identification of rituximab main isoforms and subunit analysis by online selective comprehensive two-dimensional liquid chromatography-mass spectrometry. Anal Chem. 2015;87(16):8307–15. doi:https://doi.org/10.1021/acs.analchem.5b01578.
- Sorensen M, Harmes DC, Stoll DR, Staples GO, Fekete S, Guillarme D, Beck A. Comparison of originator and biosimilar therapeutic monoclonal antibodies using comprehensive two-dimensional liquid chromatography coupled with time-of-flight mass spectrometry. MAbs. 2016;8(7):1224–34. doi:https://doi.org/10.1080/19420862.2016.1203497.
- Muneeruddin K, Nazzaro M, Kaltashov IA. Characterization of intact protein conjugates and biopharmaceuticals using ion-exchange chromatography with online detection by native electrospray ionization mass spectrometry and top-down tandem mass spectrometry. Anal Chem. 2015;87(19):10138–45. doi:https://doi.org/10.1021/acs.analchem.5b02982.
- Muneeruddin K, Bobst CE, Frenkel R, Houde D, Turyan I, Sosic Z, Kaltashov IA. Characterization of a PEGylated protein therapeutic by ion exchange chromatography with on-line detection by native ESI MS and MS/MS. Analyst. 2017;142(2):336–44. doi:https://doi.org/10.1039/C6AN02041K.
- Talebi M, Nordborg A, Gaspar A, Lacher NA, Wang Q, He XZ, Haddad PR, Hilder EF. Charge heterogeneity profiling of monoclonal antibodies using low ionic strength ion-exchange chromatography and well-controlled pH gradients on monolithic columns. J Chromatogr A. 2013;1317:148–54. doi:https://doi.org/10.1016/j.chroma.2013.08.061.
- Fussl F, Cook K, Scheffler K, Farrell A, Mittermayr S, Bones J. Charge variant analysis of monoclonal antibodies using direct coupled pH gradient cation exchange chromatography to high-resolution native mass spectrometry. Anal Chem. 2018;90(7):4669–76. doi:https://doi.org/10.1021/acs.analchem.7b05241.
- Leblanc Y, Ramon C, Bihoreau N, Chevreux G. Charge variants characterization of a monoclonal antibody by ion exchange chromatography coupled on-line to native mass spectrometry: case study after a long-term storage at +5 °C. J Chromatogr B. 2017;1048:130–39. doi:https://doi.org/10.1016/j.jchromb.2017.02.017.
- Yan Y, Liu AP, Wang S, Daly TJ, Li N. Ultrasensitive characterization of charge heterogeneity of therapeutic monoclonal antibodies using strong cation exchange chromatography coupled to native mass spectrometry. Anal Chem. 2018;90(21):13013–20. doi:https://doi.org/10.1021/acs.analchem.8b03773.
- Yan Y, Xing T, Wang S, Daly TJ, Li N. Coupling mixed-mode size exclusion chromatography with native mass spectrometry for sensitive detection and quantitation of homodimer impurities in bispecific IgG. Anal Chem. 2019;91:11417–24. doi:https://doi.org/10.1021/acs.analchem.9b02793.
- Zhang K, Liu X. Mixed-mode chromatography in pharmaceutical and biopharmaceutical applications. J Pharm Biomed Anal. 2016;128:73–88. doi:https://doi.org/10.1016/j.jpba.2016.05.007.
- Yang X, Zhang Y, Wang F, Wang LJ, Richardson D, Shameem M, Ambrogelly A. Analysis and purification of IgG4 bispecific antibodies by a mixed-mode chromatography. Anal Biochem. 2015;484:173–79. doi:https://doi.org/10.1016/j.ab.2015.06.014.
- Trappe A, Fussl F, Carillo S, Zaborowska I, Meleady P, Bones J. Rapid charge variant analysis of monoclonal antibodies to support lead candidate biopharmaceutical development. J Chromatogr B Analyt Technol Biomed Life Sci. 2018;1095:166–76. doi:https://doi.org/10.1016/j.jchromb.2018.07.037.
- Fekete S, Beck A, Guillarme D. Characterization of cation exchanger stationary phases applied for the separations of therapeutic monoclonal antibodies. J Pharm Biomed Anal. 2015;111:169–76. doi:https://doi.org/10.1016/j.jpba.2015.03.041.
- Fussl F, Trappe A, Cook K, Scheffler K, Fitzgerald O, Bones J. Comprehensive characterisation of the heterogeneity of adalimumab via charge variant analysis hyphenated on-line to native high resolution Orbitrap mass spectrometry. MAbs. 2019;11(1):116–28. doi:https://doi.org/10.1080/19420862.2018.1531664.
- Yu XC, Joe K, Zhang Y, Adriano A, Wang Y, Gazzano-Santoro H, Keck RG, Deperalta G, Ling V. Accurate determination of succinimide degradation products using high fidelity trypsin digestion peptide map analysis. Anal Chem. 2011;83(15):5912–19. doi:https://doi.org/10.1021/ac200750u.
- Cao M, Mulagapati SHR, Vemulapalli B, Wang J, Saveliev SV, Urh M, Hunter A, Liu D. Characterization and quantification of succinimide using peptide mapping under low-pH conditions and hydrophobic interaction chromatography. Anal Biochem. 2019;566:151–59. doi:https://doi.org/10.1016/j.ab.2018.11.021.
- Ehkirch A, Hernandez-Alba O, Colas O, Beck A, Guillarme D, Cianferani S. Hyphenation of size exclusion chromatography to native ion mobility mass spectrometry for the analytical characterization of therapeutic antibodies and related products. J Chromatogr B Analyt Technol Biomed Life Sci. 2018;1086:176–83. doi:https://doi.org/10.1016/j.jchromb.2018.04.010.
- Gassner AL, Rudaz S, Schappler J. Static coatings for the analysis of intact monoclonal antibody drugs by capillary zone electrophoresis. Electrophoresis. 2013;34(18):2718–24. doi:https://doi.org/10.1002/elps.201300070.
- Redman EA, Batz NG, Mellors JS, Ramsey JM. Integrated microfluidic capillary electrophoresis-electrospray ionization devices with online MS detection for the separation and characterization of intact monoclonal antibody variants. Anal Chem. 2015;87(4):2264–72. doi:https://doi.org/10.1021/ac503964j.
- Cordoba AJ, Shyong BJ, Breen D, Harris RJ. Non-enzymatic hinge region fragmentation of antibodies in solution. J Chromatogr B Analyt Technol Biomed Life Sci. 2005;818(2):115–21. doi:https://doi.org/10.1016/j.jchromb.2004.12.033.
- Vlasak J, Ionescu R. Fragmentation of monoclonal antibodies. MAbs. 2011;3(3):253–63. doi:https://doi.org/10.4161/mabs.3.3.15608.
- Griaud F, Winter A, Denefeld B, Lang M, Hensinger H, Straube F, Sackewitz M, Berg M. Identification of multiple serine to asparagine sequence variation sites in an intended copy product of LUCENTIS(R) by mass spectrometry. MAbs. 2017;9(8):1337–48. doi:https://doi.org/10.1080/19420862.2017.1366395.
- Maeda E, Kita S, Kinoshita M, Urakami K, Hayakawa T, Kakehi K. Analysis of nonhuman N-glycans as the minor constituents in recombinant monoclonal antibody pharmaceuticals. Anal Chem. 2012;84(5):2373–79. doi:https://doi.org/10.1021/ac300234a.
- Raju TS, Briggs JB, Borge SM, Jones AJ. Species-specific variation in glycosylation of IgG: evidence for the species-specific sialylation and branch-specific galactosylation and importance for engineering recombinant glycoprotein therapeutics. Glycobiology. 2000;10(5):477–86. doi:https://doi.org/10.1093/glycob/10.5.477.
- Meert CD, Amy Guo LJB, Balland A. Characterization of antibody charge heterogeneity resolved by preparative immobilized pH gradients. Anal Chem. 2010;82:3510–18. doi:https://doi.org/10.1021/ac902408r.
- Khawli LA, Goswami S, Hutchinson R, Kwong ZW, Yang J, Wang X, Yao Z, Sreedhara A, Cano T, Tesar D, et al. Charge variants in IgG1: isolation, characterization, in vitro binding properties and pharmacokinetics in rats. MAbs. 2010;2(6):613–24. doi:https://doi.org/10.4161/mabs.2.6.13333.
- Higel F, Sandl T, Kao CY, Pechinger N, Sorgel F, Friess W, Wolschin F, Seidl A. N-glycans of complex glycosylated biopharmaceuticals and their impact on protein clearance. Eur J Pharm Biopharm. 2019;139:123–31. doi:https://doi.org/10.1016/j.ejpb.2019.03.018.
- Diepold K, Bomans K, Wiedmann M, Zimmermann B, Petzold A, Schlothauer T, Mueller R, Moritz B, Stracke JO, Molhoj M, et al. Simultaneous assessment of Asp isomerization and Asn deamidation in recombinant antibodies by LC-MS following incubation at elevated temperatures. PLoS One. 2012;7(1):e30295. doi:https://doi.org/10.1371/journal.pone.0030295.
- Bailey AO, Han G, Phung W, Gazis P, Sutton J, Josephs JL, Sandoval W. Charge variant native mass spectrometry benefits mass precision and dynamic range of monoclonal antibody intact mass analysis. MAbs. 2018;10(8):1214–25. doi:https://doi.org/10.1080/19420862.2018.1521131.
- Schmid I, Bonnington L, Gerl M, Bomans K, Thaller AL, Wagner K, Schlothauer T, Falkenstein R, Zimmermann B, Kopitz J, et al. Assessment of susceptible chemical modification sites of trastuzumab and endogenous human immunoglobulins at physiological conditions. Commun Biol. 2018;1:28. doi:https://doi.org/10.1038/s42003-018-0032-8.
- Harris R, Kabakoff B, Macchi F, Shen F, Kwong M, Andya J, Shire S, Bjork N, Totpal K, Chen A. Identification of multiple sources of charge heterogeneity in a recombinant antibody. J Chromatogr B. 2001;752:233–45. doi:https://doi.org/10.1016/S0378-4347(00)00548-X.
- Bailly M, Mieczkowski C, Juan V, Metwally E, Tomazela D, Baker J, Uchida M, Kofman E, Raoufi F, Motlagh S, et al. Predicting antibody developability profiles through early stage discovery screening. mAbs. 2020;12:1. doi:https://doi.org/10.1080/19420862.2020.1743053.