
ABSTRACT
In vitro affinity maturation of therapeutic monoclonal antibodies is commonly applied to achieve desired properties, such as improved binding kinetics and affinity. Currently there are no universally accepted protocols for generation of variegated antibody libraries or selection thereof. Here, we performed affinity maturation using a yeast-based single-chain variable fragment (scFv) expression system to compare two mutagenesis methods: random mutagenesis across the entire V(D)J region by error-prone PCR, and a novel combinatorial mutagenesis process limited to the complementarity-determining regions (CDRs). We applied both methods of mutagenesis to four human antibodies against well-known immuno-oncology target proteins. Detailed sequence analysis showed an even mutational distribution across the entire length of the scFv for the error-prone PCR method and an almost exclusive targeting of the CDRs for the combinatorial method. Though there were distinct mutagenesis profiles for each target antibody and mutagenesis method, we found that both methods improved scFv affinity with similar efficiency. When a subset of the affinity-matured antibodies was expressed as full-length immunoglobulin, the measured affinity constants were mostly comparable to those of the respective scFv, but the full-length antibodies were inferior to their scFv counterparts for one of the targets. Furthermore, we found that improved affinity for the full-length antibody did not always translate into enhanced binding to cell-surface expressed antigen or improved immune checkpoint blocking ability, suggesting that screening with full-length antibody or antigen-binding fragment formats might be advantageous and the subject of a future study.
Introduction
Antibodies are potent therapeutics for various medical conditions, including autoimmune disorders, infectious disease, transplant rejection, and cancer.Citation1 The binding equilibrium dissociation constant (KD) for therapeutic antibodies against their targets range from sub-picomolar to nanomolar, depending on the mechanism of action.Citation2 For example, antibodies designed to sequester soluble target molecules might benefit from a low picomolar KD, whereas the maximum efficacy for antibodies against membrane-bound targets with high internalization rates might be achieved with a KD of 10–100 nM.Citation2 Particular on-rate and off-rate binding kinetics (kon and koff) might also be desired.Citation3 As a result, antibodies identified through phage display,Citation4,Citation5 yeast display,Citation6 or mouse immunizationCitation7 often require further engineering (“affinity maturation”) to achieve the appropriate affinities and kinetics for in vivo efficacy. Though antibody affinity has been improved through computationally-guided site-directed mutagenesis,Citation8–Citation10 many antibody engineers still rely on empirical methods that variegate antibody candidates and screen for antibody variants with desired properties.
One major challenge of antibody affinity maturation is that comprehensively mutagenized libraries can be enormously diverse. Libraries encoding multiple combinations per clone rapidly become very large. For example, while a library comprising all possible single amino acid variants in the heavy and light chain V(D)J regions of a typical antibody with 226 amino acids would contain 4,520 unique clones, a library comprising two simultaneous changes would comprise over 10 million different clones. Such large libraries can be expensive to produce, and thus investigators rely on more economical methods, such as error-prone polymerase chain reaction (epPCR), DNA shufflingCitation11-Citation14 or production of smaller libraries focusing exclusively on complementarity-determining region 3 (CDR3) domains.Citation15,Citation16 Highly diverse libraries can also be labor intensive and costly to screen, so investigators have developed an array of high-throughput methods, such as single-chain variable fragment (scFv) phage, yeast display, antigen-binding fragment (Fab) display, and full-length antibody mammalian display.Citation17 Full-length antibody libraries are typically smaller and closer to the drug format (i.e., a monoclonal antibody), whereas scFv libraries are typically larger and cheaper to screen.Citation18 However, an affinity-matured scFv may not always convert into an affinity-matured monoclonal antibody.Citation19 Despite the absence of universally adopted protocols, we are not aware of any published studies that comprehensively examine the performance of various methods for affinity maturation side-by-side.
Here we chose to focus on the yeast scFv displayCitation6 screening method to assess the utility of epPCR across the full V(D)J versus a novel method for combinatorial NNK codon mutagenesis directed against the CDRs (). A total of eight yeast scFv libraries were generated using both epPCR and degenerate NNK combinatorial codon mutagenesis (using VariantFind from Ranomics), starting with one human antibody directed against each of four immuno-oncology targets: programmed cell death protein 1 (PD-1), programmed cell death ligand 1 (PD-L1), cytotoxic lymphocyte-associated factor 4 (CTLA-4), and tumor necrosis factor receptor superfamily member 4 (OX40). Long-read next-generation sequencing (Pacific Biosciences) was used throughout the process to comprehensively assess library content before and after screening.Citation20 We selected 1–2 candidates from each library and assessed the KD of both full-length and scFv formats and performed in vitro efficacy studies on the full-length candidates. At least in the context of yeast scFv screening, either mutagenesis method can generate antibodies with improved affinity. However, mutations in yeast scFv format that affect affinity do not always maintain the same effect once expressed in a full-length antibody format, suggesting a need for further investigation of Fab or full-length libraries.
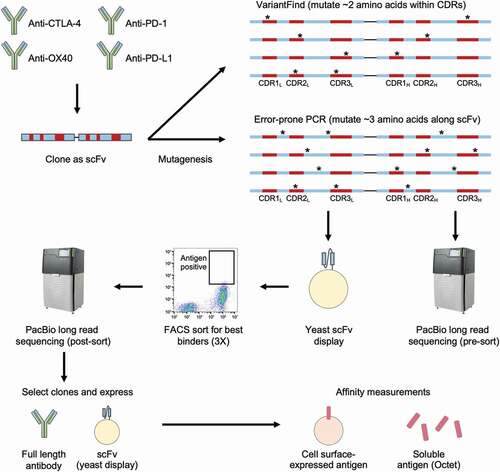
Figure 1. Affinity maturation workflow. DNA sequences encoding four antibodies, targeting CTLA-4, OX40, PD-1, and PD-L1, were first cloned into scFv formats before undergoing mutagenesis using two distinct methods. The VariantFind method aimed to mutate two amino acids within the six CDRs of the light and heavy chains, whereas the epPCR method aimed to mutate three amino acids anywhere along the entire scFv sequences (* represents mutation). The libraries were transformed into a yeast scFv display system and sorted against their respective antigens with three rounds of FACS. The libraries were sequenced via Pacific Biosciences (PacBio) long read sequencing before and after sorting. Enriched sequences were selected and cloned as full-length antibodies or scFvs, and their affinities were measured using soluble or cell surface-expressed antigens.
Results
Mutant scFv library generation and characterization
To address the complicating factor that starting KD impacts ease of affinity maturation campaigns, we selected four parental antibodies with KD spanning more than two orders of magnitude, from sub-nanomolar KD to 38 nM for the weakest binder (). Selecting antibodies directed against four distinct targets further addressed the risk of target-specific bias in our results. We previously observed that natural in vivo affinity-matured antibodies preferentially accumulate mutations within the CDR3 regions, with 6–7 amino acid changes in total across the heavy and light chain V(D)J.Citation21 A separate study showed that antibody libraries with a mutational load of only 1–2 mutations across the entire scFv could effectively be used to isolate high affinity antibody variants.Citation22 We therefore designed two mutagenesis strategies, one targeting three amino acid changes across the entire scFv through epPCR (resulting in 1–2 amino acid changes in the CDRs), the second one averaging two amino acid changes only in the CDR regions by NNK variegation.
Table 1. KD measurements for the four parental antibody clones (tPD1.16, tCTLA4.28, tPDL1.3 and tOX40.24) before being subjected to affinity maturation campaigns, measured using SPR and BLI.
Random mutagenesis was performed with the Mutazyme II (Agilent Technologies) polymerase blend, which has been optimized for reduced mutational bias. We performed long read high throughput sequencing on a Sequel device (Pacific Biosciences) to characterize the mutagenized libraries and observed an average of three codon changing mutations (range 0–11) over the length of the scFvs (). The relative frequencies of transitions and transversions closely reflected those reported by the manufacturer of the Mutazyme II polymerase mix (). The distribution of mutations was consistent across the entire scFv with no discernable bias between the framework regions (FR) and CDRs or between the individual CDRs (). We also found that if the epPCR was repeated one or two additional times on the same sample, the number of mutations could reproducibly be doubled or tripled, respectively (data not shown). We estimate that each epPCR library comprised approximately 1010 possible scFv variants.
Figure 2. Mutational profiles of in vitro mutagenized antibody libraries as assessed by Pacific Biosciences sequencing. (a) Boxplots showing the number of amino acid mutations in each library relative to the parental antibody sequences. (b) Categorization of nucleotide changes in the epPCR mutagenized libraries. The expected mutational frequency (Mutazyme II) is presented for comparison. (c) Amino acid mutation frequency along light (left panel) and heavy (right panel) chain sequences. The x-axis represents amino acid position according to the IMGT annotation. The y-axis represents mutation frequency as percentage of the total number of mutations for a given library. EpPCR and VariantFind libraries are color coded as indicated in the legend. CDR regions are shaded in yellow. (d) Predicted and observed mutational distributions based on classification of amino acid side chain properties (polar, nonpolar, positively and negatively charged).
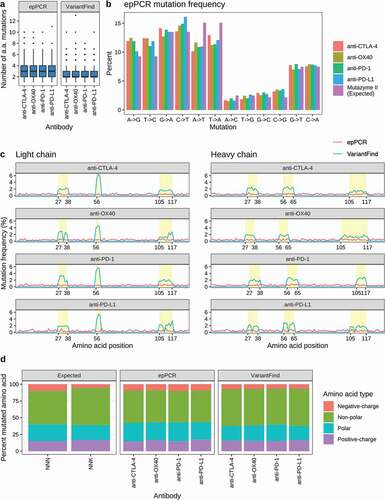
VariantFind NNK directed mutagenesis was performed by multiplexed PCR using degenerate, codon randomized oligonucleotides. In contrast with several competing methods,Citation23,Citation24 this method, like one described by Bloom,Citation25 has no restrictions on the spatial separation between mutated codons. Sequencing of the mutagenized libraries confirmed an average of two mutations (range 0–13) per scFv (). The mutations were localized to the CDR regions (), and each amino acid was mutagenized into one of the 20 possible amino acids, with the resulting amino acid distribution reflecting the codon frequencies of the degenerate NNK (Supplementary Figure S1-S4). There were no strong positional biases (Supplementary Figures S5-S8). However, an overrepresentation of mutations in CDR2L, which consists of only three amino acids, was observed for all targets. Further analysis showed that, whereas the presence of a particular amino acid in a given position was occasionally low, a substantial portion of the amino acids was represented in each position across all templates (Supplementary Figure S1-S4). For unknown reasons, four positions in anti-PD-L1 and one in anti-OX40 only displayed 1–3 alternative amino acids besides the original amino acid (Supplementary Figures S2, S4). We estimate that each VariantFind library comprised 3–6 × 10⁵ scFv variants.
We also examined the mutational profiles with respect to amino acid classes (i.e., polar, nonpolar, positively and negatively charged). We found that, whereas the two mutagenesis methods generally produced very similar patterns across all four targets, there was a slightly higher tendency for epPCR to lead to the incorporation of negatively charged and polar side chains (). There were more substantial differences for individual amino acids. Whereas the amino acid class distribution for VariantFind clones reflected that expected for NNK codons and was not detectably affected by the original amino acid, particular amino acids were biased in the epPCR samples (Supplementary Figure S9). For example, 61.6–66.5% of the mutated amino acids originating from a glutamine codon were found to be positively charged and never polar. Similarly, valine was mutated to a nonpolar amino acid in 68.3–75.8% of cases, with the remainder almost exclusively negatively charged. Other original amino acids with strongly skewed mutational profiles included cysteine, phenylalanine, isoleucine, leucine, arginine, and tryptophan. A key distinction between epPCR and VariantFind mutagenesis is that for the former the likelihood of a particular derived amino acid codon is influenced by the codon of the parental sequence, which is not the case for VariantFind. Notably, in the four epPCR libraries, 10 of the 20 amino acids never converted to a negatively charged amino acid regardless of the position in the original protein sequence. Examination of the codon repertoires for these 10 amino acids revealed that a minimum of 2 nucleotide substitutions are required to convert them to encode either aspartic acid or glutamic acid.
Affinity enrichment of yeast-displayed mutated scFv
To enrich for mutagenized scFv clones with improved antigen binding affinities, we used yeast scFv surface display and fluorescence-activated cell sorting (FACS).Citation6,Citation26 Three rounds of FACS were performed on each sample, and for each round approximately 3,000 cells were isolated from a total population of approximately 3 million cells (0.1%; ). The applied antigen concentrations for each round of FACS were guided by the antigen binding signal of each input library, with the intention to achieve increased signal in each round without losing too much of the antigen binding cell population. A previous pilot study had shown that application of antigen concentrations of 10 nM followed by 2 nM resulted in sorted libraries of desirable diversity. The intension was also to apply similar selective conditions for all libraries to assess how the affinity of the parental antibody would influence the resulting complexity and binding affinities of the post-sort population. Hence, for the first round of sorting, 10 nM concentration of antigen was used for all samples, whereas either 5 or 2 nM was used for consecutive rounds. In each round of sorting the top ~0.1% of the antigen positive cells were collected. A square gating strategy was applied, in an effort to select for scFv that were the strongest binders and most consistent expressors. This ensured homogeneous scFv expression for consecutive rounds of sorting and selected against potential mutations of the c-myc tag that were introduced during library construction.
Figure 3. Flow cytometry profiles for parental scFv yeast clones, epPCR, or VariantFind mutagenized libraries, and post-sort libraries. (a) EpPCR mutagenized samples. (b) VariantFind mutagenized samples. Each row from left to right represents the following samples: parental strain, unsorted mutagenized library, and one, two, or three times sorted libraries, all stained with the relevant soluble antigen. The y-axis reflects antigen binding, whereas the x-axis displays scFv expression through staining of the c-myc tag.
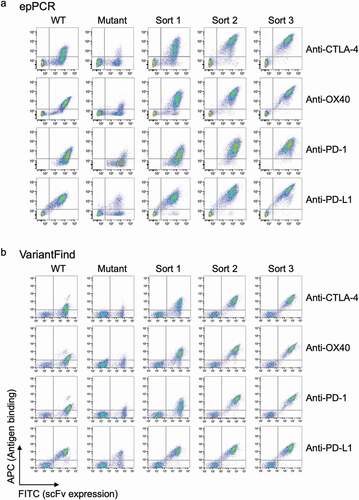
For the first round of sorting, the proportion of antigen-binding cells represented 20–40% of the total population of mutagenized cells. This was substantially higher than previously reportedCitation22 for an anti-dioxygenin scFv phage display library, where only 6.7% of cells were found positive in a library with a mutational load of 3–4 amino acid changes across the length of the scFv. We speculate that this difference resulted from the different expression systems used, the nature of the antigens, or simply the particular parental antibodies studied. Also, we often observed a substantial increase in absolute fluorescence signal either after the first or second round of sorting (). Post-sorting signals, normalized for expression, were 13- to 27-fold higher than for the parental clones for the anti-PD-1, anti-CTLA-4, and anti-OX40 antibodies, whereas the signal for the already high affinity anti-PD-L1 antibody only increased by a factor of 3- to 4-fold. Additionally, we investigated the benefit of additional rounds of sorting, but observed no measurable increase in median antigen fluorescence signal going beyond three rounds.
Following the third round of sorting, the scFv inserts in each library were PCR amplified using barcoded primers and pooled prior to long-read sequencing (Pacific Biosciences). We observed clear differences between libraries in terms of the distribution of mutations in the affinity enriched samples (). For example, post-sort anti-CTLA-4 VariantFind clones contained more amino acid mutations than the post-sort anti-PD-L1 VariantFind clones. We also observed differences between libraries in terms of the diversity of clones observed in post-sort samples (). For example, the post-sorting anti-PD-1 and anti-OX40 scFv libraries derived from either mutagenesis method were oligoclonal, with the most abundant clones representing 65.08% and 93.12% of the library, respectively. In contrast, the anti-PD-L1 and anti-CTLA-4 libraries consisted of a larger number of more evenly represented clones, with no single clone exceeding 35% frequency. We observed that the diversity of the enriched libraries was proportional to the affinity of the parental clones, consistent with the more stringent selectivity applied to the libraries of lower affinity parental antibodies (anti-PD-1 and anti-OX40) ( and ).
Figure 4. Sequence characteristics the mutagenized libraries after FACS sorting. (a) Boxplots showing the number of amino acid mutations in each library relative to the parental antibody sequences. Pre- and post-sort libraries are shown in blue and orange, respectively. P-values were determined using Wilcoxon rank sum test (**p < .0001, *p < .05, ns = not significant). (b) Library diversity post-FACS enrichment. The panels represent the 8 mutagenized libraries (top = epPCR, bottom = VariantFind). The x-axis shows the top 10 clones ranked by abundance, while the y-axis shows their percent abundance, as measured by percent sequencing reads, in the respective libraries. The bars are color-coded to indicate the number of amino acid mutations in the clones. (c) Distribution of mutations in different antibody regions (FR = framework region, CDR = complementarity-determining region) on the light (l) and heavy (h) chains. The y-axis represents percent mutation, normalized by the number of amino acids in a given region, relative to the total number of mutations in the library. The blue and orange bars represent pre- and post-sort libraries, respectively. CDR regions are shaded in yellow.
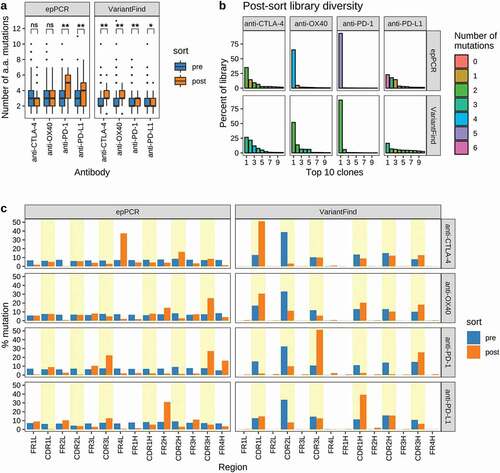
After the third round of sorting, the distribution of amino acid changes across scFv domains was distinct for each library and mutagenesis protocol (; Supplementary Figure S10a). For example, sorting of the epPCR anti-CTLA-4 library yielded antibodies with a clustering of mutations in the light chain FR 4 (FR4L; 37.4% of mutations, normalized by the length of the antibody region), whereas for the VariantFind anti-CTLA-4 library, the most abundant mutation was in CDR1L (51.1%). On the other hand, the epPCR mutagenized anti-OX40 antibodies had the highest occurrence of mutations in CDR3H (25.5%) and FR2H (14.7%), with lower and mostly even distribution of mutations across the remainder of the sequence. For this target, the VariantFind library produced one dominant mutation in CDR1L and similar levels of mutations in the remaining CDRs. Overall, the fraction of epPCR clones with codon changing mutations in the CDRs after sorting was markedly increased among the enriched anti-PD-1, anti-CTLA-4, and anti-OX40 clones, whereas framework mutations for these samples were less common (). For anti-PD-1, the number of clones with at least one CDR mutation increased from 47% pre-sort to 84% post-sort, whereas for anti-OX40, 90% of the clones had at least one CDR mutation after three sorts (Supplementary Figure S10b), consistent with prior suggestions that affinity maturation should focus on CDRs.Citation27,Citation28 However, contrary to the other libraries, anti-PD-L1 showed a small decrease in CDR mutations when comparing pre- and post-sort clones.
We also observed that at the single codon level, the mutagenic hotspots identified with VariantFind generally did not overlap with those found by epPCR. However, both mutagenesis methods produced some common mutations in CDR3H region for anti-PD-1, anti-CTLA-4, and anti-OX40, and in the CDR3L of anti-PD-1 (Supplementary Figure S10a). For example, whereas 51.1% of the VariantFind anti-CTLA-4 mutations occurred in the CDR1L region, only 5.1% of the epPCR mutations were in the same region. Sequence analysis demonstrated that several of the clones enriched from the VariantFind libraries were originally present in the pre-sort epPCR library but did not appear among the top clones after sorting. We speculate that in the higher diversity epPCR libraries, these clones were outcompeted by other clones under the specific selection conditions used or due to the stochastics of the sorting process.
Assessment of full-length and scFv candidates in vitro
We selected a set of scFv clones from the affinity maturation campaigns for each target antigen to express as full-length human IgG1 antibodies (Supplementary Table S1). Typically, the 1–2 most abundant clones post-sort were selected, however, slightly less enriched clones were also chosen to capture a more diverse set of sequence variants. For example, both the VariantFind and epPCR anti-PD-1 libraries were extremely oligoclonal after sorting, so we only chose the top 2–3 clones for each. We chose as many as six clones from other post-sort libraries. The cell culture supernatants containing secreted antibodies were used for KD measurements by biolayer interferometry (BLI).
We did not observe a clear relationship between the sequence abundance of a given scFv clone after three rounds of FACS selection and the measured affinity for the corresponding full-length antibody (Supplementary Tables S2-S3). For example, though the top-ranking anti-PD-1 clones comprised 93% and 90% of the post-sort epPCR and VariantFind libraries, respectively, the second-ranking clones, present at 0.4% and 5.8%, respectively, had lower KD values than the top ranked clones. Likewise, the second-ranking epPCR anti-OX40 clone (1.1% abundance) had an almost 4 times lower KD than the most abundant clone (65.1% abundance). Only for the anti-CTLA-4 antibodies did the top-ranking clones coincide with the strongest binders. This suggests that, at least when using our particular yeast scFv sorting protocol, a higher affinity scFv does not necessarily lead to higher abundance after three rounds of sorting.
We improved the affinities of some parental antibodies, whereas other antibodies remained recalcitrant to affinity maturation (Supplementary Tables S2-S3, Supplementary Figure S11). The affinity enriched anti-OX40 full-length antibodies were the most improved, with one antibody measuring a 10-fold improved KD, while the top ranking anti-CTLA-4 was about 4-fold improved. The remaining antibodies achieved at most 2- to 3-fold gains in affinity. The most challenging case was anti-PD-L1, which did not improve measurably despite a 4-fold higher mean fluorescent antigen binding signal for enriched yeast-displayed scFvs (though it also had the strongest starting affinity). Although the mean fluorescent antigen binding signal for the yeast-displayed anti-PD-1 scFv was substantially increased by 18- and 25-fold for the epPCR and VariantFind libraries, respectively, the full-length clones exhibited no more than 2-fold improved affinity. Thus, increases in mean fluorescent antigen binding signal after three rounds of sorting do not appear to be generally predictive of improvements in antibody affinity.
We hypothesized that FACS with scFv variant libraries might select mutations that improve affinity in the scFv, but not the full-length format. To investigate, we measured the KD of a selected set of antibodies by equilibrium binding of antigen to cell-surface displayed scFvs on yeast.Citation29 In general, we found good agreement between the parental scFv KD and the corresponding parental full-length antibody KD measured by BLI (–). However, almost all the scFv clones identified through yeast scFv sorting achieved greater relative gains in affinity over their parental scFv clone than their corresponding full-length antibodies (–). For example, the rPD1.16.1 full-length antibody and the corresponding scFv had affinities of 36.8 nM and 1.6 nM, respectively. Compared to the parental scFv, the post-sort enriched scFv had an 11.5-fold improved KD, whereas the post-sort enriched full-length antibody was a slightly weaker binder than the parental full-length antibody. For these anti-PD-1 clones, conversion of the scFv into a full-length antibody likely had a detrimental structural impact, making these scFv clones unsuitable for conversion into full-length IgG1 without further protein engineering.
Table 2. KD measurements for parental and epPCR derived full-length antibodies and their corresponding scFv clones, measured using BLI.
Table 3. KD measurements for parental and VariantFind derived full-length antibodies and their corresponding scFv clones, measured using BLI.
Ultimately, the goal of an antibody affinity maturation campaign is to identify functionally improved molecules. We therefore compared the function of several clones using cell-surface binding and in vitro efficacy assays. rOX40.24.2For example, the anti-PD-1 and anti-PD-L1 antibodies had between 4.8- to 9.6-fold stronger binding to cells than to corresponding soluble antigens. We speculate that the increased affinity of the antibodies to cell-surface antigens may be a result of conformational differences between the soluble and surface- expressed antigens, post-translational modifications, or an avidity effect caused by the close proximity of target antigens on the cell surface.Citation30 In contrast, for the anti-CTLA-4 antibodies, cell surface EC50 values were comparable to the BLI affinity constants (; ).
Table 4. Functional assessment (cellular binding and cellular activation in vitro) of a selection of full-length antibodies. Cell surface binding and functional efficacy EC50 values are derived from titration curves presented in ,b.
Figure 5. Analysis of affinity-matured full-length antibodies. (a) Cellular titrations of full-length antibodies. Cells were incubated with a dilution series of each antibody, then antibody binding was detected by a PE-labeled antibody against the Fc region. Binding is measured by median fluorescent intensity (MFI) of the PE channel. (b) Functional assessment of inhibition (for anti-PD-1, anti-PD-L1, and anti-CTLA-4) or agonism (anti-OX40) using Promega in vitro efficacy assays. Inhibition or agonism is measured by relative luminescence units (RLUs) across a dilution series of each antibody. Antibodies were tested in duplicate (anti-PD-1, anti-PD-L1) or triplicate (anti-CTLA-4, anti-OX40). Average ± standard deviation is shown. For all plots, parental antibodies and variants are shown in black and color, respectively. Derived EC50 values are listed in.
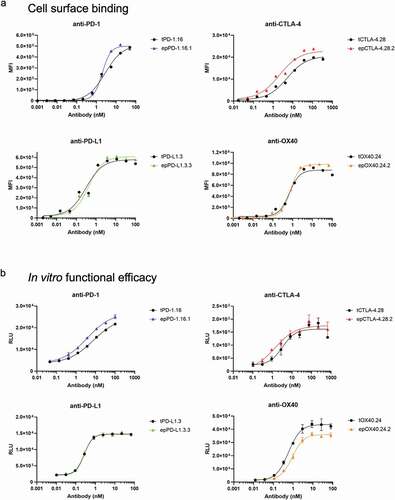
To determine whether our affinity-matured antibodies had improved efficacy in an in vitro activation model, we measured the ability of the antibodies to modulate signaling in cellular assays depending on their mechanism of action: 1) by blocking interaction of PD-1 with PD-L1; 2) by blocking CTLA-4 signaling from CD80 and CD86; or 3) by agonizing FcγRIIB-dependent OX40 signaling ().Citation31 The EC50 values for these assays generally corresponded to the cellular binding EC50 values for the full-length antibodies (). The post-sort enriched anti-PD-L1 and anti-OX40 antibodies failed to exert any gain in function over the parental counterparts, consistent with the equivalent binding affinities to the cells. On the other hand, the epPCR-derived clones epPD1.16.1 and epCTLA4.28.1 were both twice as potent as the corresponding parental full-length antibodies, presumably because of their stronger cellular binding.
Discussion
In this study, we used an established yeast scFv sorting protocolCitation6 to evaluate two mutagenesis methods for affinity maturation: epPCR across the full V(D)J versus combinatorial NNK codon mutagenesis (VariantFind) directed against CDRs. We used the protocols to attempt to affinity-mature four antibodies against four different immuno-oncology protein targets (CTLA-4, OX40, PD-1, and PD-L1). We used long-read high throughput sequencing (Pacific Biosciences) before and after sorting to accurately quantify the frequency of each amino acid mutation across the full heavy and light chain V(D)J sequences. We estimate that the VariantFind libraries contained 3–5 × 10⁵ possible scFv variants, and the epPCR libraries theoretically as many as 1010 potential variants. Though each variegation method produced very different amino acid mutation profiles, neither method was distinctly superior at identifying antibodies with improved KD. Generally, our methods produced affinity-matured scFv more efficiently than affinity-matured full-length antibodies, suggesting that some mutations that improve scFv affinity do not necessarily improve full-length antibody binding. We also observed that improvements in KD against soluble antigen did not necessarily translate into improvements in binding to cell surface-expressed antigen or ability to modulate in vitro cellular activation.
The number of variant sequences generated for antibody affinity maturation campaigns varies widely. Targeted libraries may be easier to screen, but may also miss critical variants in unexpected domains. A larger library of variants requires more effort to screen, but theoretically increases the probability that the library contains an affinity-matured variant. For example, highly targeted, computer-assisted rational design may only generate a single hypothesis for a single antibody variant, simplifying laboratory experimentation.Citation10 In contrast, epPCR, as conducted in this study, may generate as many as 1010 variants, requiring sophisticated screening protocols. Generally, most random V(D)J mutations lead to no change in affinity while most mutations that enhance affinity occur in CDRs, and random mutations in FRs often lead to unstable antibodies.Citation28,Citation32 Accordingly, we observed that post-sort epPCR clones contained more mutations in the CDRs than FRs. On the other hand, particularly for anti-PD-1 and anti-OX40, we observed common FR mutations in the post-sort epPCR clones, suggesting that advantageous mutations can arise outside the CDRs. Another important concern is coverage of synergistic or compensatory mutations, which have been seen in prior studies.Citation33 Because our epPCR libraries comprised 3 mutations across the V(D)Js (with 1–2 of them in the CDRs), we would be unlikely to identify synergistic or compensatory mutations in these libraries. The VariantFind libraries were more likely to contain these types of mutations, since they comprised an average of two mutations and specifically targeted CDRs. One method that might capture synergistic or compensatory mutations involves consecutive rounds of mutagenesis interspersed by rounds of selection.Citation34 To this end, a mutagenesis strategy of particular interest to us would be to first perform exhaustive CDR-centric VariantFind mutagenesis, followed by one or two rounds of epPCR across the entire scFv.
For future efforts, there are several process optimizations that could be used to improve results. An obvious improvement would be to sort more clones, especially for our epPCR library, which we estimated could have upwards of 1010 possible variants. With a smaller number of samples, we could reasonably sort 5 × 10⁷ cells using FACS or use magnetic-bead-based isolation systems for a larger first round of sorting. We could also modify our sorting strategy to select for higher affinity clones or clones with the desired characteristics. Here we used a moderate 2–5 nM antigen concentration for all steps and found the most improvement in cases where the affinity of the parental clone was much lower than this concentration. Thus, especially for the higher affinity antibody-antigen pairs, a further reduction in the antigen staining concentration could more clearly differentiate tighter binders. Alternatively, kinetic screening based on reduced dissociation rate, where the initial stain is followed by a pulse of non-labeled antigen, could identify clones with the desired kinetic parameters.Citation26 Finally, as not all scFvs retained their characteristics upon reformatting to full-length IgG, it is of great interest to screen antibodies in a more native format. There are multiple reports of using Fab on phage,Citation35,Citation36 yeast,Citation37,Citation38 or mammalian cellsCitation39 to evolve higher-affinity full-length antibodies. As the Fab format retains the native heavy-light interface but operates independently of the Fc, it is more likely that selected mutations will retain their benefit upon reformatting. In addition, the Fab format avoids possible avidity effects of true full-length platforms and is small enough to be reasonably expressed on yeast for larger libraries.
Though we successfully identified affinity-matured antibodies for PD-1, OX40, and CTLA-4, we were not able to identify any affinity-matured antibodies for PD-L1. Uniquely among the four affinity maturation campaigns, the post-sort anti-PD-L1 antibodies were not enriched in CDR mutations. We speculate that since the parental antibody was already of considerably higher affinity than the other parental antibodies, FACS at lower antigen concentrations would have brought a different outcome. We also note that the CDR3H of the parental anti-PD-L1 antibody was rich in tyrosines (5 of 12 residues), an amino acid with physiochemical properties making it particularly effective in antigen binding, and hence possibly less receptive to affinity enhancing mutagenesis.Citation40
Looking forward, current methods for mutagenesis, antibody variant display, and screening for binders still need further optimization, especially as technologies for DNA synthesis and cell engineering become cheaper and more precise. Still, one of the most under-explored areas for improvement is how antibody developers assess antibody improvement. To date, engineers have mostly focused on improvements in affinity kinetics, even though affinity does not necessarily correlate with improved function. For example, recently there have been substantial improvements in miniaturization and throughput of functional cellular assays.Citation41,Citation42 In the future, we expect that antibody developers will combine antibody variegation technologies with high-throughput functional assays, enabling a direct selection for the desired function.
Materials and methods
Parental scFv clones
The parental clones used as templates for mutagenesis () were identified using a microfluidics-based single cell antibody discovery platform.Citation21,Citation43–Citation45 Briefly, fully human transgenic mice (Trianni, San Francisco, CA) were injected with soluble antigen.Citation31 Millions of B cells were run through the microfluidic system, generating yeast scFv libraries of natively paired Ig heavy and light chains. The yeast scFv libraries were then screened for binders using 3–4 rounds of FACS. The parental clones were designated tPD1.16, tCTLA4.28, tPDL1.3 and tOX40.24 (the “t” prefix refers to Trianni-derived antibodies). The polyclonal libraries derived from each parental clone are designated simply anti-PD-1, anti-PD-L1, anti-CTLA-4, and anti-OX40.
Parental scFv expression constructs were generated by PCR amplification of individual heavy and light chain variable regions, using templates plasmids harboring tPD1.16, tCTLA4.28, tPL1.3, or tOX40.24. We used a combination of gene specific primers and universal primers for the light and heavy chain constant regions. The constant region primers had complementary 5ʹ ends enabling a subsequent overlap-extension PCR reaction to generate a single-chain scFv gene with an N-terminal kappa light chain and a C-terminal heavy chain. The primers also included a nucleotide sequence encoding an 18 amino acid spacer sequence (ASSRSSSSGGGGSGGGAS). A carboxy-terminal c-myc tag was appended to allow for quantification of cell surface expression. PCRs were performed using Q5 High Fidelity DNA polymerase (New England Biolabs, Ipswich, MA) and primers were custom synthesized by Integrated DNA Technologies (Coralville, IA).
The scFv amplicons were inserted into a linearized plasmid derived from p414-GAL1 (American Type Culture Collection, Manassas, VA) through homologous recombination in S. cerevisiae strain EBY100 ((MATa URA3-52 trp1 leu2Δ1 his3Δ200 pep4::HIS3 prb1Δ1.6 R can1 GAL (pIU211:URA3) (American Type Culture Collection, Manassas, VA). Yeast cells were conditioned for transformation by 15 min incubation in 2.5 M DTTCitation34 and transformed by electroporation in 2 mm gap electroporation cuvettes (89047–208, VWR Scientific, Radnor, PA) on a Bio-Rad Gene Pulser II (0.54 kV, 25 uF, resistance set to infinity) in a sucrose containing buffer (10 mM Tris, pH 7.5, 270 mM sucrose, 1 mM MgCl2). After recovery in YPD medium, transformed cells were plated on SDCAA minimal media agar plates with antibiotics (Teknova, Hollister, CA). The plasmid-borne scFv constructs were sequence-verified by Sanger sequencing.
Generating variegated scFv libraries
Random mutagenesis was performed by epPCR using the Genemorph II Random Mutagenesis kit (200550, Agilent Technologies, Santa Clara, CA). First, mutagenesis templates were generated by standard PCR amplification using Q5 polymerase (Thermo Fisher Scientific, Waltham, MA) and primers immediately flanking the scFv region. The mutagenesis reaction was performed according to the manufacturer’s recommendations. Briefly, 1 ng of PCR generated template was amplified for 20 cycles in 1 x Mutazyme II reaction buffer supplemented with 0.8 mM dNTPs, 150 nM of each primer and 2.5 units of Mutazyme II DNA polymerase. This procedure reproducibly generated ~5 nucleotide mutations across the ~1.1 kb template DNAs.
CDR-targeted mutagenesis was performed by Ranomics (Toronto, ON) using their proprietary VariantFindTM technology, which utilizes an NNK oligo-based multiplex PCR approach to randomly introduce mutations in precisely specified positions of the target gene. We designed our library to include two amino acid changes randomly distributed across all heavy and light chain CDRs. Depending on the combined length of the CDRs for each target, between 41 and 55 codons were subject to mutagenesis. One microgram of plasmid DNA (50 ng/μl) containing the parental scFvs were provided to Ranomics, and approximately 1 μg of mutagenized PCR product was received in return.
Each epPCR and VariantFind library was then introduced into yeast using the methods described above for the generation of the parental scFv clones, i.e., transformation of the mutagenized scFv libraries with the linearized p414-GAL1 vector into yeast. Approximately 2 × 10⁸ cells were transformed for each library and after growth in SDCAA selective media (Trp−) (Teknova, Hollister, CA), yielded 1–2 × 10⁷ transformants for each epPCR library and 5 × 10⁷ transformants for each VariantFind PCR library.
Variant calculations
The number of possible mutants for the epPCR variegated libraries was calculated using the formula provided below. The calculation was based on a total of between 222 to 235 targeted amino acids and an average of 3 amino acid mutations per individual molecule in each of the epPCR libraries, and between 41 and 55 targeted amino acids and an average of 2 mutations in the VariantFind libraries. The calculations did not take into account the intrinsic mutational biases of each mutagenesis method.
((xy)(z!/(z-y)!)/y! = number of possible amino acid variants
where
x = number of amino acid choices
y = number of amino acid changes per molecule
z = number of amino acid position that can be varied
Pacific biosciences long read sequencing
The sequence diversity of the mutagenized parental libraries and the FACS-sorted libraries was determined on a Sequel System (Pacific Biosciences, Menlo Park, CA), at either MR DNA (Molecular Research LP, Shallowater, Texas) or Vincent J. Coates Genomics Sequencing Laboratory at the University of California, Berkeley. Samples were prepared by first isolating the scFv carrying plasmids from each yeast strain. Briefly, 8 × 10⁶ yeast cells for each strain were cultured overnight in selective SDCAA medium, diluted to a concentration of 2 × 10⁶ cells/ml and further incubated in SDCAA medium for an additional 6 hours for optimal plasmid isolation using the Zymoprep Yeast Plasmid Miniprep II kit (Zymo Research, Irvine, CA). Preparation of sequencing-ready templates was accomplished by PCR amplification of the entire scFv insert using Q5 High Fidelity 2× Master Mix (Thermo Fisher Scientific, Waltham, MA) with Sequel-compatible 5ʹ barcoded primers for multiplexed sequencing (Pacific Biosciences, Menlo Park, CA) for 25 or 30 cycles to satisfy the minimum requested template amount of 500 ng. Final preparation of the amplicon samples for sequencing was done following standard SMRTbell library preparation procedures.
The Sequel sequencing reactions were run for 20 hours, generating an average of 29,724 circular consensus sequences (CSS) per sample (Supplementary Table S4). The CSS reads were mapped to their respective parental scFv sequences using bwa (version 0.7.17-r1188)Citation46 using the default parameters. Mapped reads with insertions or deletions were excluded from downstream analysis. The nucleotide sequences were translated to amino acid sequences in silico to identify amino acid substitutions relative to the parental sequences (Supplementary Table S1). Each unique amino acid sequence was assigned a “rank” based on read abundance. Five to nine mutated scFvs per target were manually selected based on rank and sequence uniqueness for further cloning into full length antibodies.
The parental antibody amino acid sequences were annotated using ANARCICitation47 using the international ImMunoGeneTics (IMGT) numbering scheme.Citation48 To visualize mutation hotspots along the heavy and light chains ( and S10a), the number of unique clones with a mutation at each amino acid position was counted using custom Perl scripts. The resulting mutation frequency was converted to percentage and visualized in R 3.6.0 using ggplot2 3.2.1.Citation49 To visualize mutation frequency within the CDR and FR (), the mutation counts within each region was divided by the amino acid sequence length, before conversion into percentages. The VariantFind mutation matrices (Supplementary Figures S1-S4) were generated using pheatmap 1.0.12 in R 3.6.0.
FACS of yeast scFv libraries
Yeast scFv FACS generally followed previously published protocols.Citation6 Antigens represented the extracellular, soluble portions of each target protein and were procured in a lyophilized form from either R&D Systems (PD-1, 8986-PD-100; PD-L1, 9049-B7-100) (Minneapolis, MN) or Acro Biosystems (CTLA-4, CT4-H5229; OX40, OX0-H5224) (Newark, DE). Antigens were labeled with biotin using the EZ-LinkTM Sulfo-NHS-LC-Biotinylation Kit (A39257, Thermo Fisher Scientific, Waltham, MA). Briefly, 50–100 µg of lyophilized protein was resuspended over 8–12 hours in either phosphate-buffered saline (PBS) or H2O without agitation at 4°C. Biotin labeling was accomplished in aqueous solution by combining target proteins in a 1:50 molar ratio with NHS-LC-biotin reagent freshly prepared as a 9 mM stock. The reaction was incubated without agitation in the dark at 4°C for 2 hours after which a 7 kD MWCO Zeba desalting column (89890, Thermo Fisher Scientific, Waltham, MA) was used to remove excess biotin from the solution. Subsequently, the purified labeled proteins were quantified by Bradford assay (Thermo Fisher Scientific, Waltham, MA) using a standard curve of titrated bovine serum albumin (BSA) ampules (23209, Thermo-Fisher Scientific). Biotin labeling was verified by Western Blotting using Streptavidin-HRP (21130, Pierce, Waltham, MA).
For FACS sorting a minimum of 10 million freshly cultured yeast cells for each scFv library were suspended in selective SDCAA medium at a density of 2 × 10⁶ cells/ml and cultured for 16 hours at 30°C. Cell surface expression of mutant scFv proteins was induced by diluting the cultures to a concentration of 8 × 10⁶ cells/ml in SGRCAA medium (2% galactose, 2% raffinose; Teknova) followed by incubation at 20°C for 20–24 hours with agitation. For fluorescent labeling, washed cells were incubated for 30 min at room temperature in the presence of chicken anti-c-myc polyclonal antibody (A21281, Thermo Fisher Scientific, Waltham, MA) at 5 μg/ml and the appropriate biotinylated antigen. For the first round of sorting, each sample was incubated with 10 nM biotinylated antigen, while for the second and third rounds the antigen concentrations were adjusted based on the flow cytometry signal distribution from the previous round. Thus, in the second and third rounds all VariantFind™ samples were incubated with 2 nM antigen, whereas the epPCR samples received either 5 nM (anti-CTLA-4, anti-PD-L1, and anti-OX40) or 2 nM (anti-PD-1) antigen for the second round and 2 nM for the third round, except anti-OX40, which received 5 nM in the final round. Subsequently, each sample was incubated at room temperature for 30 min with 12 μg/ml AF488-goat anti-chicken IgY and 1:300 diluted allophycocyanin (APC)-streptavidin (A11039 and SA1005, respectively, Thermo Fisher Scientific, Waltham, MA). Cells were flow sorted for double-positive cells (AF488/APC) on a BD FACSMelody (Becton-Dickinson, Franklin Lakes, NJ) equipped with 488 nm (527/32 nm filter and 507 nm LP dichroic mirror) and a 640 nm (660/10 nm filter and dichroic mirror) lasers and recovered cells were grown for 48 hours in SDCAA medium supplemented with kanamycin, streptomycin, and penicillin (Teknova, Hollister, CA). After each round of sorting an aliquot of the enriched and propagated cells were frozen and archived at −80°C. To assess the change in fluorescent signal between the input library and the enriched cell population after each FACS round, an aliquot of the enrich cells were run in parallel with the precursor population and the parental monoclonal cells on the flow cytometer.
Generation of full-length antibodies
The generation of the full-length constructs was accomplished by Gibson assembly from synthetic oligonucleotides on a BioXP 3200 System (SGI-DNA, San Diego, CA) and simultaneously introduced into vector pcDNA5/FRT EF1a-IgG1 under the control of the IE1a promoter for expression in mammalian cells. The assembled plasmids were transformed into electro-competent 5-alpha E. coli cells (New England Biolabs, Ipswich, MA), plasmids were isolated, and duplicate colonies were Sanger sequenced by Genewiz (South San Francisco, CA). Sequence-verified constructs were transiently transfected into ExpiCHO cells using the ExpiCHO expression system (A29133, Thermo Fisher Scientific, Waltham, MA). Plasmid DNA for eukaryotic expression of each antibody was diluted to 1 μg/ml of the final culture volume in OptiPRO medium and mixed with ExpiFectamine at 1.6 μl/ml. After incubating for 5 minutes at room temperature, the transfection mixture was added to ExpiCHO cells (6 million cells/ml). The cells were incubated at 37°C with 5% CO2, then ExpiFectamine CHO enhancer and ExpiCHO feed were added 18 hours post-transfection. A second feed was provided on day 5, and supernatant was harvested and clarified on day 10.
Antibody-containing supernatant was purified by binding onto a protein A column (29048576, GE Healthcare, Pittsburgh, PA) and eluting with 100 mM glycine, pH 2.5 using an Äkta FPLC. The eluate was neutralized with 1 M Tris pH 8, then dialyzed into 40 mM histidine, 240 mM sucrose, 0.2% Tween-20 and concentrated to >1 mg/mL. Proteins were checked for quality by reducing and non-reducing SDS-PAGE and size-exclusion chromatography (SEC)-high performance liquid chromatography. SEC was performed using a TSKgel G3000 7.8 × 300 mm column with a PBS mobile phase.
Affinity kinetics measurements
Kinetic binding measurements for purified parental antibodies and post-sort full-length antibodies was outsourced to Bionova (Fremont, CA) and performed on an Octet RED96e BLI instrument (Forte Bio, Fremont, CA) using 96-well microplates. The antibody samples were diluted in freshly prepared and filtered running buffer containing 1× PBS pH 7.4 (Sigma, St. Louis, MO), 1 mg/mL BSA (Sigma, St. Louis, MO), and 0.02% Tween-20 (Sigma, St. Louis, MO) (kinetic buffer, 1× KB). The temperature was set at 30°C and the orbital shake speed at 1000 rpm. The assay was performed by first capturing the antibodies (5 μg/mL, 60 sec) using anti-human Fc (AHC) Octet biosensors (18–5060, ForteBio, Fremont, CA) followed by a baseline step of 30 sec in 1× KB buffer. The monoclonal antibody-captured biosensors were then submerged in wells containing different concentrations of antigen (in 2-fold serial dilutions) for 80 sec followed by 200 sec of dissolution time in 1× KB. The antibody-captured sensors were also dipped in wells containing 1× KB to allow single reference subtraction. The AHC sensor tips were regenerated with three 5-sec dips in glycine (10 mM, pH 1.5) between each binding cycle. Binding sensorgrams were first aligned at the beginning of the antigen binding cycle and following the single reference subtraction the binding sensorgrams were globally fitted to a 1:1 model using Octet software version HT11.1.
For additional rigor, kinetic binding measurements for the parental purified full-length antibodies were also determined on a Carterra LSA surface plasmon resonance (SPR) instrument (Carterra, Salt Lake City, UT) as previously described.Citation44
Cellular binding and functional analysis
We first generated stable pools of Flp-In CHO cells (Thermo Fisher Scientific, Waltham, MA) expressing PD-1, PD-L1, CTLA-4, or OX40. To measure cell surface binding, 500,000 cells were washed two times with DPBS supplemented with 2% fetal bovine serum (Assay Buffer). Full-length antibodies were diluted in Assay Buffer to starting concentrations of 50 nM (tPD-1.16 and epPD-1.16.1), 66.7 nM (epOX40.24.2), 100 nM (tPD-L1.3, epPD-L1.3.3, and tOX40.24), or 1 μM (tCTLA-4.28 and epCTLA4.28.2), further diluted in 3-fold dilution series, then added to cells and incubated for 30 minutes at 4°C to allow binding to the cellular ligands. Cells were washed twice with Assay Buffer, then stained with Phycoerythrin (PE) anti-human IgG Fc Antibody (M1310G05, BioLegend, San Diego, CA). Cells were washed two more times with Assay Buffer and filtered into a solution of DAPI in Assay Buffer. Cytometry measurements were performed on a CytoFLEX LX flow cytometer (Beckman Coulter, Brea, CA) running CytExpert v2.2 for Windows. Antibody binding was quantified by calculating the Median Fluorescence Intensity (MFI) of the appropriate channel using FlowJo v10.4.2. EC50 values were calculated by plotting MFI versus the log of concentration using Prism v8.1.2 (GraphPad, San Diego, CA) and fit with a four-parameter logistic curve.
Functional activity of full-length antibodies in vitro was analyzed using kits for PD-1/PD-L1 Blockade, CTLA-4 Blockade, and OX40 Activation with FcγRIIB (J1250, JA3001, and CS197702, Promega, Madison, WI). All incubations were at 37°C with 5% CO2. For anti-PD-1 and anti-PD-L1, PD-L1 aAPC/CHO-K1 cells were seeded in 96-well plates and incubated for 20 hours. After removing the media, a 3-fold dilution series of each antibody (starting at 100 nM for anti-PD-L1 and 66.7 nM for anti-PD-L1) was added to the cells, followed by PD-1 effector cells. For anti-CTLA-4, CTLA-4 effector cells were seeded, followed by a 3-fold dilution series of each antibody (starting at 667 nM), then aAPC/Raji cells were added. For anti-OX40, FcγRIIb cells were seeded and incubated for 6 hours. OX40 cells were then added to the plate and incubated for 20 hours, followed by a 3-fold dilution series of each antibody (starting at 80 nM). After all cells and antibodies were added, the plates were incubated for 6 hours (5 hours for OX40), Bio-Glo Luciferase Assay buffer was added. Luminescence was read using a Spectramax i3x plate reader (Molecular Devices, San Jose, CA). EC50 values were calculated by plotting RLU (relative luminescence units) vs. the log of concentration using Prism v8.1.2 (Graphpad, San Diego, CA) and fit with a four-parameter logistic curve.
Disclosure of Potential Conflicts of Interest
All authors are employees of GigaGen Inc. and receive both equity shares and salary for their work.
Supplemental Material
Download Zip (24.2 MB)Acknowledgments
We want to express special gratitude to Michael Asensio for critically reviewing calculations on clonal diversity throughout the manuscript and Matthew Spindler, Jackson Leong, Ariel Niedecken, Rena Mizrahi, and Matthew Adams for valuable technical assistance and advice leading up to this study.
Supplementary material
Supplemental data for this article can be accessed here.
Additional information
Funding
References
- Kaplon H, Muralidharan M, Schneider Z, Reichert JM. Antibodies to watch in 2020. Mabs. 2020;12:1703531. doi:https://doi.org/10.1080/19420862.2019.1703531.
- Tiwari A, Abraham AK, Harrold JM, Zutshi A, Singh P. Optimal affinity of a monoclonal antibody: guiding principles using mechanistic modeling. Aaps J. 2017;19:510–14. doi:https://doi.org/10.1208/s12248-016-0004-1.
- Wu H, Pfarr DS, Tang Y, An -L-L, Patel NK, Watkins JD, Huse WD, Kiener PA, Young JF. Ultra-potent antibodies against respiratory syncytial virus: effects of binding kinetics and binding valence on viral neutralization. J Mol Biol. 2005;350:126–44. doi:https://doi.org/10.1016/j.jmb.2005.04.049.
- McCafferty J, Griffiths AD, Winter G, Chiswell DJ. Phage antibodies: filamentous phage displaying antibody variable regions. Nature. 1990;348:552–54. doi:https://doi.org/10.1038/348552a0.
- Clackson T, Hoogenboom HR, Griffiths AD, Winter G. Making antibody fragments using phage display libraries. Nature. 1991;352:624–28. doi:https://doi.org/10.1038/352624a0.
- Kieke MC, Cho BK, Boder ET, Kranz DM, Wittrup KD. Isolation of anti-T cell receptor scFv mutants by yeast surface display. Protein Eng Des Sel. 1997;10:1303–10. doi:https://doi.org/10.1093/protein/10.11.1303.
- Köhler G, Milstein C. Continuous cultures of fused cells secreting antibody of predefined specificity. Nature. 1975;256:495–97. doi:https://doi.org/10.1038/256495a0.
- Schier R, McCall A, Adams GP, Marshall KW, Merritt H, Yim M, Crawford RS, Weiner LM, Marks C, Marks JD. Isolation of picomolar affinity anti-c-erbB-2 single-chain Fv by molecular evolution of the complementarity determining regions in the center of the antibody binding site. J Mol Biol. 1996;263:551–67. doi:https://doi.org/10.1006/jmbi.1996.0598.
- Steidl S, Ratsch O, Brocks B, Dürr M, Thomassen-Wolf E. In vitro affinity maturation of human GM-CSF antibodies by targeted CDR-diversification. Mol Immunol. 2008;46:135–44. doi:https://doi.org/10.1016/j.molimm.2008.07.013.
- Kuroda D, Tsumoto K. Antibody affinity maturation by computational design. Methods Mol Biology Clifton N J. 2018;1827:15–34.
- Boder ET, Midelfort KS, Wittrup KD. Directed evolution of antibody fragments with monovalent femtomolar antigen-binding affinity. Proc National Acad Sci. 2000;97:10701–05. doi:https://doi.org/10.1073/pnas.170297297.
- Cirino PC, Mayer KM, Umeno D. Generating mutant libraries using error-prone PCR. In: Arnold FH, Georgiou G, editors. Directed evolution library creation. Methods in Molecular Biology™ (vol. 231). Humana Press; 2003. p. 3–9. https://doi.org/10.1385/1-59259-395-X:3.
- Rajpal A, Beyaz N, Haber L, Cappuccilli G, Yee H, Bhatt RR, Takeuchi T, Lerner RA, Crea R. A general method for greatly improving the affinity of antibodies by using combinatorial libraries. Proc National Acad Sci. 2005;102:8466–71. doi:https://doi.org/10.1073/pnas.0503543102.
- Labrou N. Random mutagenesis methods for in vitro directed enzyme evolution. Curr Protein Pept Sc. 2010;11:91–100. doi:https://doi.org/10.2174/138920310790/274617.
- Herman A, Tawfik DS. Incorporating synthetic oligonucleotides via gene reassembly (ISOR): a versatile tool for generating targeted libraries. Protein Eng Des Sel. 2007;20:219–26. doi:https://doi.org/10.1093/protein/gzm014.
- Reetz MT, Carballeira JD. Iterative saturation mutagenesis (ISM) for rapid directed evolution of functional enzymes. Nat Protoc. 2007;2:891–903. doi:https://doi.org/10.1038/nprot.2007.72.
- Ho M, Pastan I. Methods in molecular biologyTM. Methods Mol Biology Clifton N J. 2008;525:337–52.
- Rouet R, Jackson KJL, Langley DB, Christ D. Next-generation sequencing of antibody display repertoires. Front Immunol. 2018;9:118. doi:https://doi.org/10.3389/fimmu.2018.00118.
- Marcus WD, Lindsay SM, Sierks MR. Identification and repair of positive binding antibodies containing randomly generated amber codons from synthetic phage display libraries. Biotechnol Progr. 2006;22:919–22. doi:https://doi.org/10.1021/bp050420y.
- Forsyth CM, Juan V, Akamatsu Y, DuBridge RB, Doan M, Ivanov AV, Ma Z, Polakoff D, Razo J, Wilson K, et al. Deep mutational scanning of an antibody against epidermal growth factor receptor using mammalian cell display and massively parallel pyrosequencing. Mabs. 2013;5:523–32. doi:https://doi.org/10.4161/mabs.24979.
- Adler AS, Mizrahi RA, Spindler MJ, Adams MS, Asensio MA, Edgar RC, Leong J, Leong R, Roalfe L, White R, et al. Rare, high-affinity anti-pathogen antibodies from human repertoires, discovered using microfluidics and molecular genomics. Mabs. 2017;9:1282–96. doi:https://doi.org/10.1080/19420862.2017.1371383.
- Daugherty PS, Chen G, Iverson BL, Georgiou G. Quantitative analysis of the effect of the mutation frequency on the affinity maturation of single chain Fv antibodies. Proc National Acad Sci. 2000;97:2029–34. doi:https://doi.org/10.1073/pnas.030527597.
- Fowler DM, Stephany JJ, Fields S. Measuring the activity of protein variants on a large scale using deep mutational scanning. Nat Protoc. 2014;9:2267–84. doi:https://doi.org/10.1038/nprot.2014.153.
- Wrenbeck EE, Klesmith JR, Stapleton JA, Adeniran A, Tyo KEJ, Whitehead TA. Plasmid-based one-pot saturation mutagenesis. Nat Methods. 2016;13:928–30. doi:https://doi.org/10.1038/nmeth.4029.
- Bloom JD. An experimentally determined evolutionary model dramatically improves phylogenetic fit. Mol Biol Evol. 2014;31:1956–78. doi:https://doi.org/10.1093/molbev/msu173.
- Boder ET, Wittrup KD. Yeast surface display for screening combinatorial polypeptide libraries. Nat Biotechnol. 1997;15:553–57. doi:https://doi.org/10.1038/nbt0697-553.
- Yang W-P, Green K, Pinz-Sweeney S, Briones AT, Burton DR, CFB III. CDR walking mutagenesis for the affinity maturation of a potent human anti-HIV-1 antibody into the picomolar range. J Mol Biol. 1995;254:392–403. doi:https://doi.org/10.1006/jmbi.1995.0626.
- Burkovitz A, Sela‐Culang I, Ofran Y. Large‐scale analysis of somatic hypermutations in antibodies reveals which structural regions, positions and amino acids are modified to improve affinity. Febs J. 2014;281:306–19. doi:https://doi.org/10.1111/febs.12597.
- Hunter SA, Cochran JR. Chapter two cell-binding assays for determining the affinity of protein–protein interactions technologies and considerations. Methods Enzymol. 2016;580:21–44.
- Zhou Y, Goenaga A-L, Harms BD, Zou H, Lou J, Conrad F, Adams GP, Schoeberl B, Nielsen UB, Marks JD. Impact of intrinsic affinity on functional binding and biological activity of EGFR antibodies. Mol Cancer Ther. 2012;11:1467–76. doi:https://doi.org/10.1158/1535-7163.MCT-11-1038.
- Medina-Cucurella AV, Mizrahi RA, Asensio MA, Edgar RC, Leong J, Leong R, Lim YW, Nelson A, Niedecken AR, Simons JF, et al. Preferential identification of agonistic OX40 antibodies by using cell lysate to pan natively paired, humanized mouse-derived yeast surface display libraries. Antibodies. 2019;8:17. doi:https://doi.org/10.3390/antib8010017.
- Koenig P, Lee CV, Walters BT, Janakiraman V, Stinson J, Patapoff TW, Fuh G. Mutational landscape of antibody variable domains reveals a switch modulating the interdomain conformational dynamics and antigen binding. Proc National Acad Sci. 2017;114:E486–95. doi:https://doi.org/10.1073/pnas.1613231114.
- Julian MC, Li L, Garde S, Wilen R, Tessier PM. Efficient affinity maturation of antibody variable domains requires co-selection of compensatory mutations to maintain thermodynamic stability. Sci Rep-uk. 2017;7:45259. doi:https://doi.org/10.1038/srep45259.
- Chao G, Lau WL, Hackel BJ, Sazinsky SL, Lippow SM, Wittrup KD. Isolating and engineering human antibodies using yeast surface display. Nat Protoc. 2006;1:755–68. doi:https://doi.org/10.1038/nprot.2006.94.
- Hoogenboom HR, Griffiths AD, Johnson KS, Chiswell DJ, Hudson P, Winter G. Multi-subunit proteins on the surface of filamentous phage: methodologies for displaying antibody (Fab) heavy and light chains. Nucleic Acids Res. 1991;19(15):4133–37. doi:https://doi.org/10.1093/nar/19.15.4133.
- Orum H, Andersen PS, Oster A, Johansen LK, Riise E, Bjørnvad M, Svendsen I, Engberg J. Efficient method for constructing comprehensive murine Fab antibody libraries displayed on phage. Nucleic Acids Res. 1993;21:4491–98. doi:https://doi.org/10.1093/nar/21.19.4491.
- van den Beucken T, Pieters H, Steukers M, van der Vaart M, Ladner RC, Hoogenboom HR, Hufton SE. Affinity maturation of Fab antibody fragments by fluorescent‐activated cell sorting of yeast‐displayed libraries. FEBS Lett. 2003;546:288–94. doi:https://doi.org/10.1016/S0014-5793(03)00602-1.
- Chan CEZ, Chan AHY, Lim APC, Hanson BJ. Comparison of the efficiency of antibody selection from semi-synthetic scFv and non-immune Fab phage display libraries against protein targets for rapid development of diagnostic immunoassays. J Immunol Methods. 2011;373:79–88. doi:https://doi.org/10.1016/j.jim.2011.08.005.
- Nguyen AW, Le KC, Maynard JA. Identification of high affinity HER2 binding antibodies using CHO Fab surface display. Protein Eng Des Sel. 2018;31:91–101. doi:https://doi.org/10.1093/protein/gzy004.
- Koide S, Sidhu SS. The Importance of being tyrosine: lessons in molecular recognition from minimalist synthetic binding proteins. ACS Chem Biol. 2009;4:325–34. doi:https://doi.org/10.1021/cb800314v.
- Shembekar N, Hu H, Eustace D, Merten CA. Single-cell droplet microfluidic screening for antibodies specifically binding to target cells. Cell Rep. 2018;22:2206–15. doi:https://doi.org/10.1016/j.celrep.2018.01.071.
- Johnson D, Adler A, Spindler M, Mizrahi R. Systems and methods for massively parallel combinatorial analysis of single cells. US patent 10,329,557. Publication date 2019 Jun 25.
- Adler AS, Mizrahi RA, Spindler MJ, Adams MS, Asensio MA, Edgar RC, Leong J, Leong R, Johnson DS. Rare, high-affinity mouse anti-PD-1 antibodies that function in checkpoint blockade, discovered using microfluidics and molecular genomics. Mabs. 2017;9:1270–81. doi:https://doi.org/10.1080/19420862.2017.1371386.
- Adler AS, Bedinger D, Adams MS, Asensio MA, Edgar RC, Leong R, Leong J, Mizrahi RA, Spindler MJ, Bandi SR, et al. A natively paired antibody library yields drug leads with higher sensitivity and specificity than a randomly paired antibody library. Mabs. 2018;10:431–43. doi:https://doi.org/10.1080/19420862.2018.1426422.
- Asensio MA, Lim YW, Wayham N, Stadtmiller K, Edgar RC, Leong J, Leong R, Mizrahi RA, Adams MS, Simons JF, et al. Antibody repertoire analysis of mouse immunization protocols using microfluidics and molecular genomics. Mabs. 2019;11:870–83. doi:https://doi.org/10.1080/19420862.2019.1583995.
- Li H, Durbin R. Fast and accurate long-read alignment with Burrows-Wheeler transform. Bioinform Oxf Engl. 2010;26:589–95. doi:https://doi.org/10.1093/bioinformatics/btp698.
- Dunbar J, Deane CM. ANARCI: antigen receptor numbering and receptor classification. Bioinform Oxf Engl. 2015;32:298–300.
- Lefranc M-P, Giudicelli V, Ginestoux C, Jabado-Michaloud J, Folch G, Bellahcene F, Wu Y, Gemrot E, Brochet X, Lane J, et al. IMGT, the international ImMunoGeneTics information system. Nucleic Acids Res. 2008;37:D1006–12. doi:https://doi.org/10.1093/nar/gkn838.
- Wickham H. Ggplot2: elegant graphics for data analysis (2nd. ed.). Springer Publishing Company, Incorporated; 2016.