
 ?Mathematical formulae have been encoded as MathML and are displayed in this HTML version using MathJax in order to improve their display. Uncheck the box to turn MathJax off. This feature requires Javascript. Click on a formula to zoom.
ABSTRACT
Monoclonal antibodies are a class of biotherapeutics used for an increasing variety of disorders, including cancer, autoimmune, neurodegenerative, and viral diseases. Besides their antigen specificity, therapeutic use also mandates control of their solution interactions and colloidal properties in order to achieve a stable, efficacious, non-immunogenic, and low viscosity antibody solution at concentrations in the range of 50–150 mg/mL. This requires characterization of their reversible self-association, aggregation, and weak attractive and repulsive interactions governing macromolecular distance distributions in solution. Simultaneous measurement of these properties, however, has been hampered by solution nonideality. Based on a recently introduced sedimentation velocity method for measuring macromolecular size distributions in a mean-field approximation for hydrodynamic interactions, we demonstrate simultaneous measurement of polydispersity and weak and strong solution interactions in a panel of antibodies with concentrations up to 45 mg/mL. By allowing approximately an order of magnitude higher concentrations than previously possible in sedimentation velocity size distribution analysis, this approach can substantially improve efficiency and sensitivity for characterizing polydispersity and interactions of therapeutic antibodies at or close to formulation conditions.
Introduction
The control of colloidal properties and higher-order structures in antibody solutions sufficiently concentrated to deliver injectable therapeutic doses is a key requirement for the development of stable, safe, and efficacious antibody therapeutics. Interactions that control macromolecular solution behavior span a large affinity range and the resulting solution structures can span an exceptionally large size range. Far-field interactions that modulate the molecular distance distribution in solution, as well as short-range weak interactions that lead to transient complexes, may cause phase separation, promote the formation of immunogenic irreversible aggregates, or cause excessive solution viscosity.Citation1–Citation8 In the search for conditions of pH, ionic strength, and excipients that yield safe and efficacious formulations, powerful biophysical methods have been used by different laboratories to predict and characterize higher-order structures and interactions of protein pharmaceuticals, including computational approaches,Citation5,Citation9-Citation11 and experimental techniques such as static and dynamic light scattering, small-angle scattering, analytical ultracentrifugation, and chromatography.Citation12–Citation21
However, a key experimental difficulty for the characterization of weak protein interactions with any technique is the need to study concentrated solutions that are thermodynamically and hydrodynamically nonideal. For this discussion, we adopt a framework accounting for reversible self-association explicitly as oligomeric states linked by mass action law, and separate from nonideality, which is here understood as forces that modulate interparticle distance distribution without leading to physical complex formation, such as volume exclusion and long-range repulsive or attractive interactions.Citation22 For fundamental reasons, this nonideality prohibits standard polydispersity analysis due to the hydrodynamic coupling of all macromolecular motion, and the concomitant violation of the linear superposition principle.Citation23 Although, in principle, nonideal solution behavior can be modeled, e.g., in scattering and sedimentation techniques, such models require a priori assumptions on the existence of one or a few discrete species, and the potential impact of polydispersity on the measurement remains uncertain. Therefore, the inability to account simultaneously for polydispersity and protein interactions in nonideal macromolecular solutions has substantially hampered the study of therapeutic formulations at the high concentrations on the order of 100 mg/mL typically required.
For dilute antibody solutions, typically up to a few mg/mL, sedimentation velocity analytical ultracentrifugation (SV) is a gold standard for quantitation of trace aggregates, orthogonal to size-exclusion chromatography (SEC).Citation24,Citation25 To briefly recapitulate the physical basis, separation is achieved in SV by virtue of the high centrifugal field during ultracentrifugation that causes strongly size-dependent migration of macromolecular particles free in solution, and leads to the formation of sedimentation boundaries. These are optically measured and mathematically modeled to determine the diffusion-deconvoluted sedimentation coefficient distributions “c(s)”.Citation26,Citation27 Since the experiment is matrix-free and does not depend on particular mobile phases, SV has become an important technique to complement the more high-throughput SECCitation25,Citation28,Citation29 for detecting traces of potentially immunogenic irreversible aggregates of misfolded protein populations with high sensitivity and oligomeric resolution.Citation24,Citation30-Citation33
Another traditional application of SV is the characterization of protein–protein interactions.Citation34–Citation39 Because the geometry of an SV experiment is such that faster sedimenting species remain in a bath of virtually undiluted sample solution at all times, dissociation of weakly bound oligomeric species is balanced by continuous re-association of monomers. As a consequence, in contrast to chromatographic separation techniques, even reversible oligomeric populations are maintained during the experiment and will not be diluted out.Citation34 Dependent on the life-time of the complex, the oligomers will be resolved, or reflected in a boundary pattern governed by the time-average sedimentation velocity of dynamically coupled systems.Citation34,Citation39
We have recently introduced an extension of SV that incorporates a mean-field approximation of hydrodynamic and thermodynamic nonideal interactions.Citation23 This “nonideal cNI(s0)” analysis permits, for the first time, size-distribution analysis of concentrated, strongly nonideal solutions. In model applications with small proteins at concentrations up to 80 mg/mL, we have demonstrated how the greater concentration range of SV allows the detection of ultra-weak protein self-association.Citation40 Additionally, as part of the nonideal c(s) fit, the nonideality coefficients of sedimentation and diffusion (kS and kD) are obtained, which report on even weaker attractive or on repulsive interactions reflected in the interparticle distance distribution and in the solution structure. They are directly related to the second osmotic virial coefficient B2, which is of great interest for predicting the long-term stability of formulations.Citation41–Citation45
These features should be useful in the study of concentrated solutions of therapeutic antibodies, due to the ability of this method, for the first time, to simultaneously measure reversible self-association, weak attractive or repulsive far-field interactions, while also hydrodynamically resolving irreversible aggregates and other particles. The aim of this work is to evaluate the performance of the new nonideal SV analysis in the characterization of a panel of model monoclonal antibodies (mAbs) with previously examined published properties.Citation4,Citation15,Citation18,Citation46-Citation49 We find that the new SV approach can seamlessly extend the conventional SV analysis of trace aggregates and oligomeric populations from dilute solutions to macromolecular concentrations exceeding 40 mg/mL. Overall, the measured mAb properties are consistent with those previously measured by SV and determined with other techniques. In this study, due to higher concentrations that can be used in the experiments, better detection limits for weak self-association are achieved. Based on these results, we believe the nonideal cNI(s0) approach significantly improves the comprehensive characterization of the colloidal state and protein–protein interactions of therapeutic antibodies close to formulation conditions.
Results
Quantitative analysis of sedimentation coefficient distributions of mAbs at high concentrations
Relative to SV in dilute solution, sedimentation boundaries at high concentrations are distorted in multiple ways as a result of the locally concentration-dependent macromolecular sedimentation rate. This is highlighted in ), which shows experimental data of mAb A at a concentration of 37 mg/mL (solid lines) in comparison with the expected concentration profiles (dotted lines) based on the sedimentation and diffusion properties of the same molecule measured in dilute conditions. Besides the overall retardation of the boundary midpoints at high concentration, the boundary spread is much reduced (traditionally referred to as “self-sharpening”) and changes very little with time. Not discernable in this presentation are distortions of the boundary amplitudes in multi-component mixtures, which magnify slowly moving species and obscure fast-moving species. As a result of this substantially altered migration process, nonideal SV data cannot be reliably analyzed with standard size-distribution models.
Figure 1. Distortions in the sedimentation boundaries and apparent sedimentation coefficient distributions in nonideal sedimentation. a, Measured concentration profiles of 37 mg/mL mAb A at select times during sedimentation at 45,000 rpm (solid lines; later times indicated by higher color temperature) in comparison with the theoretical sedimentation of a macromolecule with sedimentation properties as measured for the monomer or mAb A under dilute conditions (dotted lines; corresponding to a species with 6.5 S and frictional ratio 1.6). b, Lines show different sedimentation coefficient distribution models derived by fitting the sedimentation data: standard c(s) with unphysical best-fit f/f0 of 4.0 (blue); apparent sedimentation coefficient distribution g*(s) (purple); and nonideal cNI(s0) fixing f/f0 at 1.6 as measured in dilute solution by ideal c(s) analysis (magenta). The dashed vertical line indicates the s-value of the mAb A monomer measured at 100-fold lower concentration in dilute solution. In (a) and (b) the boundary and distribution features corresponding to trace aggregates are highlighted by shaded areas (arrows).
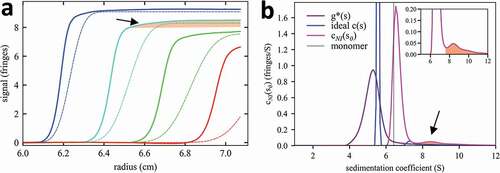
The data in are representative for the sedimentation behavior of all mAbs at high concentrations, since the hydrodynamic and thermodynamic nonideality is an obligate consequence of macromolecular volume exclusion and solvent viscosity. Although nonideality has long been incorporated in single (or a few discrete) species models,Citation50,Citation51 this typically provides only a very rough fit (with a root-mean-square deviation (rmsd) of 0.32 fringes for the data in ), and does not capture the detailed information contained in the experimental boundaries. For example, the traces of faster sedimenting species – critical information for pharmaceutical samples – are revealed in the slowly increasing solution ‘plateaus’ (red shaded highlight in )), and would be missed in a single species fit. On the other hand, force-fitting an imposter ideal sedimentation coefficient distribution c(s) still results in a poor fit (rmsd 0.09 fringes), and boundary self-sharpening is mistaken for low diffusion, resulting in an unphysical best-fit frictional ratio f/f0 of 4.0. Furthermore, without accounting for nonideality any sedimentation coefficient distribution shows peaks at too low s-values, and the Johnston-Ogston effect will invariably mask faster boundary components and produce underestimates of trace aggregate species.Citation23,Citation52
The new nonideal cNI(s0) does not suffer from these distortions and leads to an excellent fit (rmsd 0.042 fringes). Generally, rmsd values of cNI(s0) analyses fall within a few thousands of the loading concentration, comparable to the fit quality obtained in the standard c(s) for dilute solutions. For the present example of mAb A, the distribution is shown as magenta line in ), and the corresponding fit to the raw sedimentation data is shown in ). In this nonideal distribution analysis, hydrodynamic shape parameters can generally be fixed to those measured in dilute solution (hereby keeping f/f0 = 1.6 constant). The distribution cNI(s0) reports sedimentation coefficients in the same units s0 as in infinite dilution, and therefore measurements across different concentrations can be directly compared. Thus, the slight shift of the cNI(s0) peak at 37 mg/mL (magenta) compared to the measured value at 100-fold lower concentrations (dashed line in )) is indicative of ultra-weak self-association of mAb A. Although this shift may be close to the limit of precision, it is supported by measurements across different concentrations shown in ), and in the isotherm fit of . By inherently correcting for Johnston-Ogston distortions, cNI(s0) represents all species equally well including the trace aggregates (shaded areas in ). In addition, cNI(s0) analysis reveals an average nonideality coefficient kS and kD, which can be interpreted in the context of interparticle distance distributions and virial coefficients.Citation45 In the present case, the best-fit kS = 5 mL/g and kD = 1 mL/g, which yield a second virial coefficient B2 of 3 mL/g, suggest slightly attractive interactions.
Figure 2. Comparison of measured sedimentation boundaries of mAb A (a) and mAb D (b). Concentrations are 37 mg/mL for mAb A and 46 mg/mL for mAb D, and sedimentation at 45,000 rpm is represented by every 10th data point (points) of every 3rd scan (time intervals of 120 sec). The solid line is the best-fit nonideal cNI(s0) model fixing the frictional ratio f/f0 at the value measured in dilute solution, while refining the best-fit values for kS and kD (see Table 1). This results in a ratio of rmsd/loading signal of 0.42% for mAb A and 0.41% for mAb D. The corresponding best-fit sedimentation coefficient distributions cNI(s0) are shown in Figure 3.
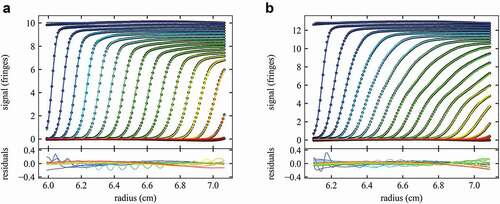
Figure 3. Different protein interactions exhibited by a panel of different mAbs A – E. Shown are concentration-dependent sedimentation coefficient distributions cNI(s0) of the mAb at concentrations indicated in the legend. Insets expand scale > 7 S.
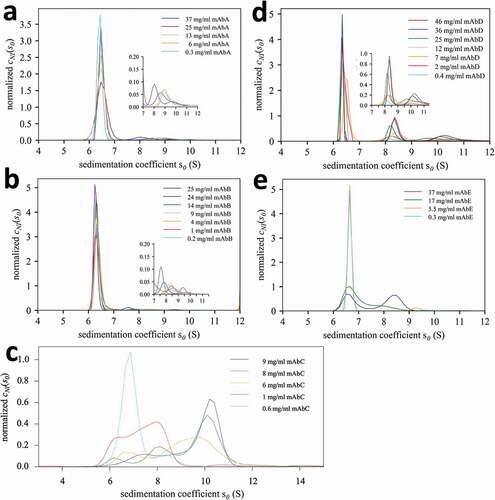
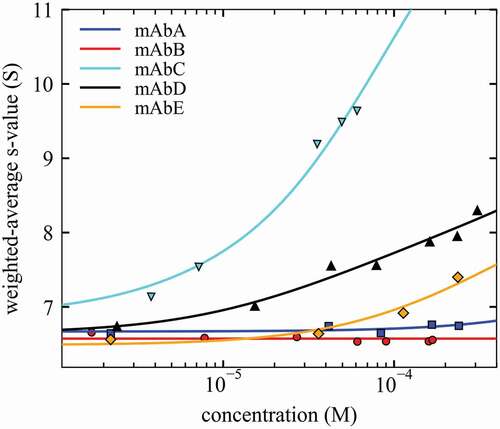
Figure 4. Isotherms of weighted-average sedimentation coefficients sw (symbols) and best-fit self-association models (lines) for different mAbs. sw-values were determined by integration of the cNI(s0) distribution of Figure 3. For best-fit self-association parameters, see Table 1.
As described previously, a limitation in the maximum protein concentration arises from refractive index gradients in the sedimentation boundaries and concomitant lensing artifacts.Citation23 This can be suppressed effectively by using centerpieces with short optical pathlengths. With IgGs, in this work, we found that solutions up to ~20 mg/mL can be studied distortion-free in commercial 3 mm pathlength centerpieces, and up to ~45 mg/mL in the most recent custom 3D-printed centerpiecesCitation53 with 1 mm optical pathlength. Above these concentrations, we observed overly sharp concentration profiles characteristic of lensing artifacts, as well as integral fringe offsets in neighboring camera pixels characteristic for imaging excessively steep refractive index gradients. In the absence of optical aberrations, a welcome side effect of working at high concentration is the remarkable signal/noise ratio and the low sensitivity to refractive index signals from sedimenting buffer salts.
Comparison of sedimentation patterns of different mAbs dependent on concentration
The nonideal cNI(s0) distribution is a seamless extension of the standard c(s) analysis widely used for dilute solutions, and the results can be interpreted in the same way since all nonideality effects are computationally absorbed in the nonideality coefficient kS and kD. This opens a window of opportunity to observe and interpret in a straightforward manner the rich details of various self-association and aggregation behavior exhibited by mAbs, much closer to formulation conditions than previously possible. Although, at first, boundary sharpening effects would seem to represent an analytical difficulty and nuisance, it turns out that the suppression of apparent diffusional broadening and retardation of the boundaries can greatly improve the hydrodynamic resolution for detecting different species, compensating for the decreased signal amplitudes suffered by faster sedimenting species (as a result of the Johnston-Ogston effect).
As an example for the sedimentation behavior exhibited by different mAbs at high concentration, contrasts the sedimentation patterns at 45,000 rpm of mAb A at 37 mg/mL ()) with those of mAb D at 46 mg/mL ()). We have already pointed out above the sloping plateaus of mAb A reflecting populations of faster sedimenting oligomeric species ()). By contrast, mAb D shows a substantially different behavior with much stronger oligomerization, as may be discerned visually from the multi-modal boundary pattern reflecting significant populations of faster-sedimenting oligomers ()). This is borne out in the corresponding sedimentation coefficient distributions shown in (,d), respectively). At this point of inspecting the sedimentation patterns and their modeling, it is important to note again that exquisite fits with rmsd of a small fraction of 1% of the loading signal can be achieved to all data. This supports both the validity of the mean-field approximation of nonideality underlying the cNI(s0) model, as well as the detailed interpretation of the resulting sedimentation coefficient distributions (below). The remaining residuals stem from systematic errors rather than stochastic noise, as a result of the very large loading signal.
An important question is whether the detected faster-sedimenting states are stable aggregates, or species in slow or rapid self-association equilibrium. This can be addressed in a concentration series allowing samples to attain chemical equilibrium at different dilutions of stock solutions prior to the SV experiment. When studying samples across a large concentration range that spans ideal and strongly nonideal sedimentation behavior, it is useful to recognize that for IgG samples at low concentrations (below 0.5 mg/mL) nonideality is typically virtually absent and diffusion behavior can be measured well, whereas for high concentrations (above 10 mg/mL) diffusion information is obscured by dominant boundary self-sharpening originating from nonideality. Therefore, we applied a 3-step strategy. Initially, we carried out a conventional ideal c(s) analysis of the most diluted sample still with significant signal (e.g., at 0.3 mg/mL) to determine the average frictional ratio f/f0. Next, this was inserted and kept fixed as prior knowledge in the cNI(s0) analysis of the most concentrated sample (where diffusion is masked most by self-sharpening). This provides a good estimate of the nonideality of sedimentation kS, since the highest concentrations are maximally exhibiting nonideality. SV experiments do not carry as much information on kD as they do on kS, since nonideality of diffusion becomes a second-order effect when diffusion is largely masked. Therefore, in this step, we found the best strategy to achieve convergence to the best-fit model is to initially constrain kD (e.g., to a small value of log10(kD) = −3 or −2.5) while optimizing kS, followed by a release of the constraint on kD and optimizing both kS and kD. In rare cases we found it advantageous to release the constraint in f/f0, to allow for the effect that rapid chemical conversion of species on the time-scale of sedimentation can enhance boundary broadening in excess of solely diffusion-based estimates. Finally, since the scale of sedimentation coefficients (s0-values) returned in cNI(s0) depends chiefly on kS, it is important that this parameter is well defined. For this reason, in the analysis of the intermediate concentrations we fixed kS (and kD) to the value obtained in the analysis of the highest sample concentration, which reflects best the nonideality of the solution. For low concentrations, this parameter would not be well defined. If the highest sample concentration was below ~10 mg/mL, we found that kS may best be fixed to average expectation values for mAbs. This strategy allows for nonideality corrections to samples under close-to-ideal conditions.
The resulting sedimentation coefficient distributions cNI(s0) for a panel of five different mAbs (A – E) are shown in . The comparison highlights rich information on different behavior that can already be visually discerned, including weak and strong self-association, size and stability of oligomers, and the presence of trace oligomers. As should be expected, they all exhibit the monomer peak at the correct position (in contrast to other methods, as shown in )). As is the case with c(s),Citation27,Citation54 in cNI(s0) sedimentation coefficients of trace aggregates will not be as well defined as the major peaks, though peak integrals are more faithful than s-values. Nevertheless, irreversible dimeric aggregates can be discerned clearly in the small peaks at 8–10 S in panels 3a and 3b, based on the observation that their relative population (integral) does not change very much across the wide concentration range studied. Kinetically stable but concentration-dependent reversible dimer and higher oligomer formation is indicated by the ≈8 S and ≈10 S peaks in panel 3d. Finally, we note the peak patterns conforming more with the expected shifts in position and amplitude of rapidly reversible oligomerization in panels 3 c and 3e.
Quantitation of interaction properties of different mAbs
Interactions can (1) act on the molecular distance distribution in solution, or (2) they can lead to physical contacts and reversible formation of oligomeric complexes, or (3) they can create stable oligomeric species (aggregates).
First, modulations of the molecular distance distribution can be attractive or repulsive, and may be driven, for example, by steric volume exclusion, electrostatic, or hydrodynamic interactions. Such interactions are captured in the nonideality coefficients kS and kD resulting from the cNI(s0) analysis, which are listed for the panel of mAbs in . They may be assessed by comparison with values expected for hypothetical molecules purely exhibiting volume exclusion. Rowe has suggested the hydrodynamic volume as a gross estimate for hydrodynamic volume exclusion effects, which, together with Batchelor’s theory of the hydrodynamic interactions in suspensions of noninteracting spheres, leads to an estimate of kS ≈ 4.8×(f/f0)3.Citation45,Citation55 Based on this estimate, the kS-values from project slightly attractive interactions for all mAbs, and stronger attractive interactions for mAb E.
Table 1. Best-fit binding parameters from the analysis of concentration-dependence of sedimentation.
Second, similar to sedimentation in sufficiently dilute solutions that render physical nonideality negligible,Citation37 reversible complex formation will increase the time-average sedimentation velocity of the sedimenting protein molecules. This is reflected in the weighted-average sedimentation coefficient sw, which can be measured – independent of the complex lifetime – by integration of cNI(s0). Since all nonideality is already absorbed into the parameters kS and kD, just as in dilute solution,Citation37 the isotherm of sw as a function of loading concentration can be interpreted as a reflection of mass action law shifting the time-average population of different states. These isotherms of sw(c) are shown in .
A qualitative ranking of self-association can be easily established visually on the basis of increasing sw-values, even without quantitative analysis, with self-association of mAb B < A < E < D < C. For the quantitative analysis, a mass action law model must be invoked. For the selection of the model, the cNI(s0) distributions in may be inspected, as mentioned above, following the same principles as interpreting ideal c(s) distributions.Citation37 In principle, for long-lived complexes cNI(s0) peaks represent species s-values, with different amplitudes representing different species populations. By contrast, for short-lived transient oligomers, the cNI(s0) peaks represent time-average s-values representative of different sections of the sedimentation boundary. While for the weakest self-association processes the simplest model of a monomer-dimer self-association may be invoked (B, A, E), the discrete peaks of cNI(s0) for mAb D demonstrate the presence of higher-order oligomers such as trimers or tetramers. Thus, mAb D was modeled with an isodesmic self-association model. For mAb C, the multimodal peak structure with the strong peak at >10 S suggests a two-step self-association that we have modeled as a monomer-dimer-tetramer system. The resulting KD-values representing the affinities of these binding interfaces are shown in (as customary, using notation of upper case KD for the equilibrium dissociation constant and lower case kD for the nonideality coefficients of diffusion); they follow the empirical ranking from comparison of the isotherms, the weakest one for mAb A with KD > 10 mM, and the strongest one for mAb C with KD ≈ 40 µM. mAb D was found to exhibit a strong dimerization followed by weak further self-assembly to higher-order oligomers with KD ≈ 1 mM.
Third, to the extent that irreversible aggregates elevate the sw-values, and assuming that the aggregate populations are concentration-independent, at least on the time-scale of the SV experiments, it is possible to obtain an estimate of irreversible aggregate fractions from the isotherm analysis. This can be achieved by constraining the monomer s-value in the isotherm model to the cNI(s0) peak of the monomer, as measured, for example, in the most dilute conditions. Then, the mass action law model in the isotherm can be extended by an oligomeric fraction incompetent of participating in the concentration-dependent chemical equilibrium. The fraction of mAb dimer so obtained (where possible) was consistent within 2% with that from the estimate provided by c(s) integration at the lowest concentration ().
Discussion
The solution behavior of concentrated macromolecular suspensions is of wide interest in many fields, ranging from colloidal chemistry to cell biology and biotechnology. Their study, however, is significantly hampered by the lack of techniques that can observe macromolecular size distributions, in addition to short-lived complex formation and modulations of intermolecular distance distribution, under hydrodynamically and thermodynamically nonideal conditions. In particular, this poses a methodological problem for the characterization of therapeutic proteins under formulation conditions. The experimental simplicity of using centrifugal force to achieve hydrodynamic resolution of macromolecular states migrating free in solution provides a unique opportunity to combine the description of polydispersity and nonideality.
Here, we have demonstrated the application of SV to characterize protein interactions and polydispersity of mAbs at concentrations up to ~45 mg/mL. This brings a substantially higher concentration range into view for characterization by SV than previously possible. The increase is driven by a new computational approach for nonideality cNI(s0),Citation23 and leveraged by recently developed experimental improvements for thin sample holders.Citation53 The panel of antibodies we used here to test the new methodology was previously characterized by some of us.Citation4,Citation15,Citation18,Citation46-Citation49 Since self-association and nonideality properties depend on formulation conditions,Citation13,Citation46 we have chosen phosphate-buffered saline (PBS) for comparability with previous studies of these molecules. With regard to their distinct self-association properties, the current results are generally in good agreement, within the caveats arising from different observables and limitations in different techniques.
In particular, the strongest self-association was observed for mAb C, consistent with previous measurements.Citation15,Citation46,Citation47 Even though prior work comes to conflicting conclusions with regard to the self-association scheme, which is notoriously hard to determine, the results agree that there is a first step exhibiting an (effective) KD in the few tens of μM, the fact that self-association extends to at least two states, and that the second step (effective) KD is similar or slightly weaker. The present results are consistent with this, and inspection of the concentration-dependent peaks in the cNI(s0) profiles and the range of s-values observed leads us to an isotherm model with monomer-dimer-tetramer system, with best-fit KD-values of 39 μM and 33 μM for first and second step, respectively. It was not possible, however, to raise the concentration to 45 mg/mL as with the other mAbs; this would have significantly increased the population of the larger species, which may have clarified the nature of the larger oligomers.
The second strongest self-association was found with mAb D. In the most quantitative previous study, a monomer-dimer-irreversible dimer model was applied leading to an estimate of KD of 600 μM, in the presence of 2% irreversible dimer.Citation15 At the previously highest concentration of 15 mg/mL, this model implies the population of the reversible dimer to be only 7% (mass fraction). Such a low abundance makes precise measurement of reversible and irreversible dimers quite difficult. This situation is more favorable in the present study, where at the highest concentration of ~35 mg/mL the reversible dimer fraction is projected to be >30%, allowing for improved quantitation. Our result from modeling the sw-isotherm also suggests a significantly stronger dimerization with KD of 80 μM, coexisting with 6.4% irreversible aggregate. In addition, the cNI(s0) profiles clearly resolve additional larger oligomers, which fit to a weak isodesmic growth model with KD of ≈1 mM. This highlights the advantage in sensitivity when higher concentrations can be used.
All other mAbs exhibit only very weak self-association, if any. For mAb E we observe dimerization with a best-fit KD of 0.9 mM, close to the previously reported value of 1.03 mM.15 Similar to mAb D, the increased concentration in the present work approximately doubles the population of the dimer, aiding in the accuracy of its characterization. Whereas both mAbs A and B were previously found to be non-interacting,Citation15 the higher concentrations now possible allowed us to detect ultra-weak dimerization for A with a best-fit KD of 13 mM. The latter is confirmed in light scattering experiments (manuscript submitted).
Turning to the nonideality coefficients that describe interparticle distance distributions, it is important to note that the new cNI(s0) analysis absorbs hydrodynamic nonideality into the best-fit coefficients kS. Therefore, within the framework of cNI(s0) distributions these nonideality coefficients do not consider as part of nonideality those complexes that are resolved in cNI(s0) as faster-sedimenting species. The best-fit kS-values were all slightly below the theoretical values of 6.55 for non-interacting spheres with the measured hydrodynamic radius (with the exception of mAb E, which was significantly below), suggesting the presence of attractive interactions modulating particle distance distributions in addition to the reversible complex formation discussed above.
The comparison of these values with those observed in other techniques and with other analysis tools, however, is problematic. A major difficulty arises from the operational definition of nonideality coefficients and the question to what extent self-association states are recognized and separately accounted for. For example, in dynamic light scattering (DLS) a nonideality coefficient of diffusion is customarily determined from the concentration-dependence of the overall z-average diffusion coefficient, whereas in the analysis of static light scattering, similar to SV, the self-association in different oligomeric states can be explicitly modeled.Citation56 As a result, all kD values from the entire panel of mAbs, measured by DLS were previously found to be negative,Citation15 whereas those from SV in the same previous work (and also those in the present work) are positive. Similar differences in the thermodynamic reference frame have long been discussed for second virial coefficients for self-associating molecules.Citation22 Even in the interpretation of SV, diverging approaches have been taken. In one approach, kS is assigned to be simply the concentration-dependence of experimental sw-values,Citation57 whereas in another approach using explicit sedimentation models any self-association is not considered part of the nonideality.Citation15 These are valid, but different concepts, and will lead to very different results that are mutually incompatible. We will examine the interrelationship between self-association and nonideality models in application to different techniques in a forthcoming communication.
Finally, the only mAb in this study for which no self-association was detected and these confounding factors should not apply is mAb B. The best-fit kS from cNI(s0) analysis was 6.5 mL/g (±0.2 mL/g, 68% confidence interval), slightly lower than the value of 8.8 mL/g reported previously.Citation15 The origin for the difference is unknown, but small differences will arise from different concentration measurements (in cNI(s0) entirely based on refractometric signal increment of 2.75 fringes×(mg/mL)−1× cm−1) and potentially from different framework for buffer density and viscosity corrections, which in cNI(s0) is solvent-based consistent with statistical fluid mechanics picture of Batchelor.Citation23,Citation58
From a methodological point of view, the new SV approach can replace a two-step analysis for concentrated antibody solutions proposed recently.Citation15,Citation57 Previously, in a first step, polydispersity was approximately assessed in an apparent sedimentation coefficient distribution g*(s). Lacking both diffusion and nonideality corrections, this distribution can only reveal a limited, qualitative picture of the sedimentation process.Citation27,Citation59 Critical drawbacks of this step are that oligomers are hydrodynamically poorly resolved, their peak amplitudes underrepresent true populations due to Johnston-Ogston effects, and that reversible self-association is masked – sometimes entirely – by opposing effects of nonideality on the sedimentation velocity. This makes g*(s) distributions even qualitatively difficult to interpret. This was followed by a second step that models SV data with computational solutions to the Lamm equation explicitly accounting for the spatio-temporal evolution of the sedimentation/diffusion/reaction process. This step is more rigorous in that it can include nonideality, but it is bound by the well-known problems and limitations of discrete Lamm equation modeling, chiefly the lack of accounting for polydispersity and microheterogeneity.Citation27,Citation34,Citation60 Such neglect of polydispersity is a critical point, in particular, when raising the experimental concentrations with concomitant increased propensity for aggregation. Previously both steps could be applied only to small data subsets, and thus did not take advantage of the information in the full temporal evolution of sedimentation profiles.
The new cNI(s0) analysis overcomes these limitations. It is appealing because it enables seamless extension of workflows well-known in the characterization of ideal solutions by SV, and can fit remarkably well scan data representing the entire sedimentation process. In the cNI(s0) analysis all effects of nonideality are absorbed into the mean-field nonideality coefficients kS and kD, which are available for separate interpretation. As in standard c(s) analysis, stable species can be resolved in cNI(s0) with high hydrodynamic resolution, their s-values can be assessed directly based on mass and friction as in dilute solution, and the integrated cNI(s0) peaks are proportional to weight concentrations. Thus, it can be applied very similar to the widely used analysis of trace aggregates of mAbs by c(s) analysis, and the interpretation of self-association can proceed identically to the well-known analyses of more dilute interacting systems. For reversible systems, the concentration-dependence of peaks reflects on the kinetic stability, and the thermodynamic analysis of binding models can be based as usual on sw-isotherms derived from integration of sedimentation coefficient distributions.Citation34,Citation37
It should be noted that Rayleigh interference optical, refractive index-based detection must be used for nonideal cNI(s0) analysis, since detection of the evolution of the total macromolecular concentration is essential for the mean-field approximation at the core of cNI(s0). From this optical requirement derives the currently limiting factor for protein concentrations, which is lensing aberrations in the optical detection in the presence of strong refractive index gradients associated with steep sedimentation boundaries. This is strongly dependent on the optical pathlength. For molecules the size of IgG sedimenting at 45,000 rpm, we found maximal concentration to be ~20 mg/mL in Epon 3 mm pathlength centerpieces (Beckman Coulter, Indianapolis, IN; or Spin Analytical, Berwick, ME), or ~45 mg/mL when using 3D-printed 1 mm pathlength centerpieces, and we assume intermediate concentration limits will apply for commercial 1.5 mm pathlength titanium centerpieces (Nanolytics Instruments, Potsdam, Germany).
Interestingly, the fluorescence optical detection system (FDS, Aviv Instruments, Lakewood, NJ) was proposed to provide superior performance for sedimentation analysis of fluorescently labeled mAbs in concentrated solutions.Citation57,Citation61-Citation64 A well-known technical concern when working with extrinsic fluorescent tags is the extent of alteration of the macromolecular behavior due to fluorescent labeling.Citation65 This question becomes more pertinent when studying highly concentrated macromolecular solutions, where weak ‘nonspecific’ interactions and ultimately even contributions of the tag to excluded volume may alter the macromolecular properties under study. Even if this can be experimentally controlled, a more fundamental problem arises in the study of nonideality using tracer molecules in SV in the presence of other untagged macromolecules, since nonideality is due to volume occupancy of all macromolecules in solution, not only those that are detected. In the special case that the fluorescence signal represents an even fraction of the total sedimenting material, it may be possible to apply cNI(s0) to FDS data analysis, although the effects of existing refractive index gradients on FDS data and the applicable concentration limits still remain unclear. If, on the other hand, the non-fluorescent material is sedimenting differently from the fluorescent molecules, then the sedimentation boundaries and back-diffusion profiles of this majority ‘invisible’ material will dynamically modulate nonideality of the visible molecules to an unknown extent, and this will make a quantitative sedimentation analysis problematic with any method. In fact, it is precisely the ability to monitor the total concentration and its evolution with time that makes the cNI(s0) analysis of polydispersity and nonideality possible, and this is one major difference between the FDS approach and the refractive-index-based method presented here.
In summary, we demonstrate the utility of a new approach of SV analysis for nonideal mAb solutions at concentrations up to ~45 mg/mL. It overcomes the existing limitations of mutual exclusivity between nonideality and polydispersity analysis, and therefore can report simultaneously on size-distributions of irreversible aggregates, as well as a wide spectrum of reversible self-association, including formation of complexes ranging from strong to ultra-weak. The ability to work at high concentrations and to achieve hydrodynamic resolution of different size species provides the opportunity to distinguish these oligomerization events better from nonideality parameters that reflect slightly attractive or repulsive modulations of interparticle distance distributions. This positions nonideal SV analysis uniquely among biophysical techniques for the characterization of mAbs colloidal solution state.
Materials and methods
Antibodies
All five mAbs A-E described here were provided by AstraZeneca (Gaithersburg), purified by a series of chromatography and membrane separation steps. Each mAb was dialyzed into PBS (137 mM NaCl, 2.7 mM KCl, 10 mM Na2HPO4, and1.8 mM KH2PO4, pH 7.4) overnight at 2–8°C, after which the stock concentration was measured by UV spectrophotometric analysis at 280 nm as described previously.Citation15 All mAbs were of subclass IgG1 except mAb D, which was IgG2.
Sedimentation velocity analytical ultracentrifugation
SV experiments were carried out using a ProteomeLab analytical ultracentrifuge (Beckman Coulter, Indianapolis). Samples in concentrations ranging from 0.2 to 46 mg/mL were diluted from stock in PBS, mixed well and kept to equilibrate overnight at 4°C. They were then loaded into cell assemblies with sapphire windows and two-sector Epon centerpieces with 12 mm pathlength for samples below 1 mg/mL, Epon centerpieces with 3 mm pathlength for samples between 1 and 14 mg/mL, or 3D-printed Microfine Green centerpieces with 1 mm pathlengthCitation53 for concentrations >14 mg/mL, respectively. Next, the assemblies were placed in an 8-hole An-50 Ti rotor, and temperature equilibrated at a set point of 20°C while resting in vacuum in the rotor chamber for at least 2 h. Independently measured rotor temperatures in the different instruments used for different experiments were 19.6°C (mAbA), 19.8°C (mAbB and mAbD), 20.1°C (mAbC) and 21.6°C (mAbE), respectively.Citation26,Citation66 After acceleration to 45,000 rpm data acquisition commenced using the Rayleigh interference optical detection system.
Data were corrected for scan time errorsCitation67 using the software REDATE (kindly provided by Dr. Chad Brautigam), analyzed using the cNI(s0) model in SEDFITCitation23 versions 16.2– 16.34, corrected for temperature and radial calibration errors as described,Citation66 and followed by sW isotherm analysis using different binding models in SEDPHAT version 15.2e, and results plotted with GUSSICitation68 (kindly provided by Dr. Chad Brautigam). For comparison, apparent sedimentation coefficient distributions g*(s) were calculated by DCDT+Citation69 version 2.4.3 (kindly provided by Dr. John Philo).
Nonideal sedimentation coefficient distribution analysis
The recently introduced mean-field approximation for nonideal sedimentation coefficient distribution analysis cNI(s0) is key for enabling our study at high concentrations.Citation23 We briefly recapitulate the basic structure of the analysis model. Analogous to the well-known ideal case of c(s) analysis,Citation27 it is rooted in a Fredholm integral equation defining the distribution:
i.e., we model the complete evolution of observed signal a(r,t) as a superposition with weights cNI(s0) for each s0-value, where ε is an extinction coefficient and d the optical pathlength, and χNI denotes the species spatio-temporal sedimentation pattern at unit concentration based on its sedimentation and diffusion coefficient, the latter as usual approximated via a hydrodynamic scaling law characterized by a common translational frictional ratio fr.Citation27
The key problem in nonideal sedimentation is that motion of all molecules is coupled, which strictly makes the distribution problem intractable. The extension of the standard c(s) model into the nonideal regime becomes possible with a mean-field approximation. This is based on the recognition that sedimentation nonideality is the dominant factor in SV, and that more than 80% of the magnitude of kS is due to solvent backflow,Citation70 which, in turn, depends principally on the total hydrodynamic volume occupied by all sedimenting species, with lesser dependency on precise shape and charge heterogeneity. In this first-order approximation of nonideality effects across the particle size distribution, the sedimentation χi,NI(r,t) of each class of particles follows the Lamm partial differential equationCitation71
with species sedimentation and diffusion coefficients locally dependent on the local total macromolecular concentration χtot(r,t) following
The latter dependence on the entire sedimentation coefficient distribution still reflects the interdependence of sedimentation patterns, but can be taken as a recursive recipe for calculating cNI(s0). In the limit of low concentrations, the nonideality terms vanish and the Lamm equation approaches the ideally sedimenting case. Fitting of cNI(s0) was combined with maximum entropy regularization to achieve the most parsimonious distribution consistent with experimental data.Citation27 Other than the incorporation of nonideality coefficients into the sedimentation model, the interpretation of cNI(s0) follows the same principles as c(s).
Analysis of self-association equilibria
The analysis of self-association can proceed analogously to the analysis of self-association in ideal solutions.Citation37,Citation72 Integration of cNI(s0) across peaks reflecting interacting species provides well-defined signal weighted-average s-values, sw, which can be assembled into binding isotherms as a function of total concentration ctot.Citation27 Generally, the isotherm for self-associating systems can be modeled based on the laws of mass conservation and mass action for formation of an oligomer of size i from monomers at concentration c1 with equilibrium association constant Ki
with sedimentation si for the different oligomers (and using the definition K1 = 1). For convenience, ctot was taken in molar protomer concentration units. In theory, small corrections to the ‘effective’ loading concentrations may be applied that reflect slight dilution of the sedimentation boundary in the sector-shaped solution column.Citation27,Citation37,Citation73 Here, we considered these corrections negligible compared with uncertainties of protein concentration measurements, uncertainties in the binding models, and typical confidence intervals of best-fit equilibrium constants.
In the analysis of the isotherms with the model EquationEq. 4(4)
(4) , it may be observed that the best-fit monomer s-value can be inconsistent with the known s-value from the monomer peak of the sedimentation coefficient distribution. This can be a result of irreversible aggregates that do not participate in the reversible oligomerization. Thus, the isotherm analysis in SEDPHAT can be extended by considering a fraction of irreversible, association-incompetent material in a certain oligomeric state. In this way, irreversible dimer fractions can be estimated from the isotherm analysis if the monomer s-value is constrained to the known c(s) or cNI(s0) peak value ().
Author contributions
SKC, KJ-M, AN, HZ, and PS designed and carried out experiments; AP, SD-O, RE provided materials. SKC, and KJ-M performed data analyses; SKC, AP, KJ-M, TV-J, SD-O, HZ, RE and PS wrote the paper.
Disclosure of potential conflicts of interest
No potential conflicts of interest were disclosed.
Abbreviations
Acknowledgments
This work was supported by the Intramural Research Program of the National Institute of Biomedical Imaging and Bioengineering, National Institutes of Health. KJ-N and TV-J were supported by a NOVA grant from Aarhus University Research Foundation.
Additional information
Funding
References
- Geng SB, Cheung JK, Narasimhan C, Shameem M, Tessier PM. Improving monoclonal antibody selection and engineering using measurements of colloidal protein interactions. J Pharm Sci. 2014;103:3356–12. doi:https://doi.org/10.1002/jps.24130.
- Mahler HC, Friess W, Grauschopf U, Kiese S. Protein aggregation: pathways, induction factors and analysis. J Pharm Sci. 2009;98:2909–34. doi:https://doi.org/10.1002/jps.21566.
- Roberts CJ. Protein aggregation and its impact on product quality. Curr Opin Biotechnol. 2014;30:211–17. doi:https://doi.org/10.1016/j.copbio.2014.08.001.
- Geoghegan JC, Fleming R, Damschroder M, Bishop SM, Sathish HA, Esfandiary R. Mitigation of reversible self-association and viscosity in a human IgG1 monoclonal antibody by rational, structure-guided Fv engineering. MAbs. 2016;8:941–50. doi:https://doi.org/10.1080/19420862.2016.1171444.
- Blanco MA, Hatch HW, Curtis JE, Shen VK. Evaluating the effects of hinge flexibility on the solution structure of antibodies at concentrated conditions. J Pharm Sci. 2019;108:1663–74. doi:https://doi.org/10.1016/j.xphs.2018.12.013.
- Baek Y, Zydney AL. Intermolecular interactions in highly concentrated formulations of recombinant therapeutic proteins. Curr Opin Biotechnol. 2018;53:59–64. doi:https://doi.org/10.1016/j.copbio.2017.12.016.
- Shire SJ. Formulation and manufacturability of biologics. Curr Opin Biotechnol. 2009;20:708–14. doi:https://doi.org/10.1016/j.copbio.2009.10.006.
- Yearley EJ, Godfrin PD, Perevozchikova T, Zhang H, Falus P, Porcar L, Nagao M, Curtis JE, Gawande P, Taing R, et al. Observation of small cluster formation in concentrated monoclonal antibody solutions and its implications to solution viscosity. Biophys J. 2014;106:1763–70. doi:https://doi.org/10.1016/j.bpj.2014.02.036.
- Agrawal NJ, Helk B, Kumar S, Mody N, Sathish HA, Samra HS, Buck PM, Li L, Trout BL. Computational tool for the early screening of monoclonal antibodies for their viscosities. MAbs. 2016;8:43–48. doi:https://doi.org/10.1080/19420862.2015.1099773.
- Calero-Rubio C, Saluja A, Roberts CJ. Coarse-grained antibody models for “weak” protein-protein interactions from low to high concentrations. J Phys Chem B. 2016;120:6592–605. doi:https://doi.org/10.1021/acs.jpcb.6b04907.
- Skar-Gislinge N, Ronti M, Garting T, Rischel C, Schurtenberger P, Zaccarelli E, Stradner A, Colloid A. Approach to Self-Assembling Antibodies. Mol Pharm. 2019;16:2394–404. doi:https://doi.org/10.1021/acs.molpharmaceut.9b00019.
- Castellanos MM, Mattison K, Krueger S, Curtis JE. Characterization of the NISTmAb reference material using small-angle scattering and molecular simulation. Anal Bioanal Chem. 2018;410:2161–71. doi:https://doi.org/10.1007/s00216-018-0869-1.
- Xu AY, Castellanos MM, Mattison K, Krueger S, Curtis JE. Studying excipient modulated physical stability and viscosity of monoclonal antibody formulations using small-angle scattering. Mol Pharm. 2019;16:4319–38. doi:https://doi.org/10.1021/acs.molpharmaceut.9b00687.
- Jiménez M, Rivas G, Minton AP. Quantitative characterization of weak self-association in concentrated solutions of immunoglobulin G via the measurement of sedimentation equilibrium and osmotic pressure. Biochemistry. 2007;46:8373–78. doi:https://doi.org/10.1021/bi7005515.
- Hopkins MM, Lambert CM, Bee JS, Parupudi A, Bain DL. Determination of interaction parameters for reversibly self-associating antibodies: A comparative analysis. J Pharm Sci. 2018;107:1820–30. doi:https://doi.org/10.1016/j.xphs.2018.03.011.
- Blanco MA, Sahin E, Li Y, Roberts CJ. Reexamining protein-protein and protein-solvent interactions from Kirkwood-Buff analysis of light scattering in multi-component solutions. J Chem Phys. 2011;134:225103. doi:https://doi.org/10.1063/1.3596726.
- Gohon Y, Agarwal S, Arthur K, Bepperling A, Day ES, Filoti D, Greene DG, Hayes DB, Kroe-Barrett R, Laue TM, et al. Biophysical techniques for characterizing the higher order structure and interactions of monoclonal antibodies. Schiel J, Davis D, Borisov O, editors. State-of-the-art and emerging technologies for therapeutic monoclonal antibody characterization volume 2. Biopharmaceutical characterization: the NISTmAb case studyACS Symposium Series, Vol. 1201, Chapter 6, 2015; 285–327. doi:https://doi.org/10.1021/bk-2015-1201.ch006
- Luo H, Macapagal N, Newell K, Man A, Parupudi A, Li Y, Li Y. Effects of salt-induced reversible self-association on the elution behavior of a monoclonal antibody in cation exchange chromatography. J Chromatogr A. 2014;1362:186–93. doi:https://doi.org/10.1016/j.chroma.2014.08.048.
- Maddux NR, Joshi SB, Volkin DB, Ralston JP, Middaugh CR. Multidimensional methods for the formulation of biopharmaceuticals and vaccines. J Pharm Sci. 2011;100:4171–97. doi:https://doi.org/10.1002/jps.22618.
- Connolly BD, Petry C, Yadav S, Demeule B, Ciaccio N, Moore JMR, Shire SJ, Gokarn YR. Weak interactions govern the viscosity of concentrated antibody solutions: high-throughput analysis using the diffusion interaction parameter. Biophys J. 2012;103:69–78. doi:https://doi.org/10.1016/j.bpj.2012.04.047.
- Amin S, Barnett GV, Pathak JA, Roberts CJ, Sarangapani PS. Protein aggregation, particle formation, characterization & rheology. Curr Opin Colloid Interface Sci. 2014;19:438–49. doi:https://doi.org/10.1016/j.cocis.2014.10.002.
- Hill TL, Chen Y-D. Theory of aggregation in solution. I. General equations and application to the stacking of bases, nucleosides, etc. Biopolymers. 1973;12:1285–312. doi:https://doi.org/10.1002/bip.1973.360120608.
- Chaturvedi SK, Ma J, Brown PH, Zhao H, Schuck P. Measuring macromolecular size distributions and interactions at high concentrations by sedimentation velocity. Nat Commun. 2018;9:4415. doi:https://doi.org/10.1038/s41467-018-06902-x.
- Berkowitz SA. Role of analytical ultracentrifugation in assessing the aggregation of protein biopharmaceuticals. Aaps J. 2006;8:E590–605. doi:https://doi.org/10.1208/aapsj080368.
- Gabrielson JP, Brader ML, Pekar AH, Mathis KB, Winter G, Carpenter JF, Randolph TW. Quantitation of aggregate levels in a recombinant humanized monoclonal antibody formulation by size exclusion chromatography, asymmetrical flow field flow fractionation, and sedimentation velocity. J Pharm Sci. 2007;96:268–79. doi:https://doi.org/10.1002/jps.20760.
- Schuck P, Zhao H, Brautigam CA, Ghirlando R. Basic principles of analytical ultracentrifugation. Boca Raton (FL): CRC Press; 2015.
- Schuck P. Sedimentation velocity analytical ultracentrifugation: discrete species and size-distributions of macromolecules and particles. Boca Raton (FL): CRC Press; 2016.
- Arakawa T, Ejima D, Li T, Philo JS. The critical role of mobile phase composition in size exclusion chromatography of protein pharmaceuticals. J Pharm Sci. 2010;99:1674–92. doi:https://doi.org/10.1002/jps.21974.
- Gandhi AV, Pothecary MR, Bain DL, Carpenter JF. Some lessons learned from a comparison between sedimentation velocity analytical ultracentrifugation and size exclusion chromatography to characterize and quantify protein aggregates. J Pharm Sci. 2017;106:2178–86. doi:https://doi.org/10.1016/j.xphs.2017.04.048.
- Rosenberg AS. Effects of protein aggregates: an immunologic perspective. Aaps J. 2006;8:E501–7. doi:https://doi.org/10.1208/aapsj080359.
- Moussa EM, Panchal JP, Moorthy BS, Blum JS, Joubert MK, Narhi LO, Topp EM. Immunogenicity of Therapeutic Protein Aggregates. J Pharm Sci. 2016;105:417–30. doi:https://doi.org/10.1016/j.xphs.2015.11.002.
- Uchiyama S, Noda M, Krayukhina E. Sedimentation velocity analytical ultracentrifugation for characterization of therapeutic antibodies. Biophys Rev. 2018;10:259–69. doi:https://doi.org/10.1007/s12551-017-0374-3.
- Gabrielson JP, Randolph TW, Kendrick BS, Stoner MR. Sedimentation velocity analytical ultracentrifugation and SEDFIT/c(s): limits of quantitation for a monoclonal antibody system. Anal Biochem. 2007;361:24–30. doi:https://doi.org/10.1016/j.ab.2006.11.012.
- Schuck P, Zhao H. Sedimentation velocity analytical ultracentrifugation: interacting systems. Boca Raton (FL): CRC Press; 2017.
- Schachman HK. Ultracentrifugation in biochemistry. New York (NY): Academic Press; 1959.
- Correia JJ. Analysis of weight average sedimentation velocity data. Methods Enzymol. 2000;321:81–100.
- Schuck P. On the analysis of protein self-association by sedimentation velocity analytical ultracentrifugation. Anal Biochem. 2003;320:104–24. doi:https://doi.org/10.1016/S0003-2697(03)00289-6.
- Sontag CA, Stafford WF, Correia JJ. A comparison of weight average and direct boundary fitting of sedimentation velocity data for indefinite polymerizing systems. Biophys Chem. 2004;108:215–30. doi:https://doi.org/10.1016/j.bpc.2003.10.029.
- Schuck P. Sedimentation patterns of rapidly reversible protein interactions. Biophys J. 2010;98:2005–13. doi:https://doi.org/10.1016/j.bpj.2009.12.4336.
- Chaturvedi SK, Sagar V, Zhao H, Wistow G, Schuck P. Measuring ultra-weak protein self-association by nonideal sedimentation velocity. J Am Chem Soc. 2019;141:2990–96. doi:https://doi.org/10.1021/jacs.8b11371.
- Calero-Rubio C, Ghosh R, Saluja A, Roberts CJ. Predicting protein-protein interactions of concentrated antibody solutions using dilute solution data and coarse-grained molecular models. J Pharm Sci. 2018;107:1269–81. doi:https://doi.org/10.1016/j.xphs.2017.12.015.
- Saluja A, Fesinmeyer RM, Hogan S, Brems DN, Gokarn YR. Diffusion and sedimentation interaction parameters for measuring the second virial coefficient and their utility as predictors of protein aggregation. Biophys J. 2010;99:2657–65. doi:https://doi.org/10.1016/j.bpj.2010.08.020.
- Quigley A, Williams DR. The second virial coefficient as a predictor of protein aggregation propensity: A self-interaction chromatography study. Eur J Pharm Biopharm. 2015;96:282–90. doi:https://doi.org/10.1016/j.ejpb.2015.07.025.
- Saito S, Hasegawa J, Kobayashi N, Kishi N, Uchiyama S, Fukui K. Behavior of monoclonal antibodies: relation between the second virial coefficient (B2) at low concentrations and aggregation propensity and viscosity at high concentrations. Pharm Res. 2012;29:397–410. doi:https://doi.org/10.1007/s11095-011-0563-x.
- Chaturvedi SK, Schuck P. A reappraisal of sedimentation nonideality coefficients for the analysis of weak interactions of therapeutic proteins. Aaps J. 2019;21:35. doi:https://doi.org/10.1208/s12248-019-0307-0.
- Esfandiary R, Hayes DB, Parupudi A, Casas-Finet J, Bai S, Samra HS, Shah AU, Sathish HA. A systematic multitechnique approach for detection and characterization of reversible self-association during formulation development of therapeutic antibodies. J Pharm Sci. 2013;102:3089–99. doi:https://doi.org/10.1002/jps.23654.
- Esfandiary R, Parupudi A, Casas-Finet J, Gadre D, Sathish H. Mechanism of reversible self-association of a monoclonal antibody: role of electrostatic and hydrophobic interactions. J Pharm Sci. 2014;104:577–86. doi:https://doi.org/10.1002/jps.24237.
- Arora J, Hu Y, Esfandiary R, Sathish HA, Bishop SM, Joshi SB, Middaugh CR, Volkin DB, Weis DD. Charge-mediated Fab-Fc interactions in an IgG1 antibody induce reversible self-association, cluster formation, and elevated viscosity. MAbs. 2016;8:1561–74. doi:https://doi.org/10.1080/19420862.2016.1222342.
- Sarangapani PS, Weaver J, Parupudi A, Besong TMD, Adams GG, Harding SE, Manikwar P, Castellanos MM, Bishop SM, Pathak JA. Both reversible self-association and structural changes underpin molecular viscoelasticity of mAb solutions. J Pharm Sci. 2016;105:3496–506. doi:https://doi.org/10.1016/j.xphs.2016.08.020.
- Solovyova A, Schuck P, Costenaro L, Ebel C. Non-ideality by sedimentation velocity of halophilic malate dehydrogenase in complex solvents. Biophys J. 2001;81:1868–80. doi:https://doi.org/10.1016/S0006-3495(01)75838-9.
- Weiss GH, Yphantis DA. Rectangular approximation for concentration-dependent sedimentation in the ultracentrifuge. J Chem Phys. 1965;42:2117–23. doi:https://doi.org/10.1063/1.1696254.
- Johnston JP, Ogston AG. A boundary anomaly found in the ultracentrifugal sedimentation of mixtures. Trans Faraday Soc. 1946;42:789–99. doi:https://doi.org/10.1039/tf9464200789.
- To SC, Brautigam CA, Chaturvedi SK, Bollard MT, Krynitsky J, Kakareka JW, Pohida TJ, Zhao H, Schuck P. Enhanced sample handling for analytical ultracentrifugation with 3D-printed centerpieces. Anal Chem. 2019;91:5866–73. doi:https://doi.org/10.1021/acs.analchem.9b00202.
- Brown PH, Balbo A, Schuck PA. Bayesian approach for quantifying trace amounts of antibody aggregates by sedimentation velocity analytical ultracentrifugation. Aaps J. 2008;10:481–93. doi:https://doi.org/10.1208/s12248-008-9058-z.
- Rowe AJ. The concentration dependence of transport processes: A general description applicable to the sedimentation, translational diffusion, and viscosity coefficients of macromolecular solutes. Biopolymers. 1977;16:2595–611. doi:https://doi.org/10.1002/bip.1977.360161202.
- Some D. Light-scattering-based analysis of biomolecular interactions. Biophys Rev. 2013;5:147–58. doi:https://doi.org/10.1007/s12551-013-0107-1.
- Yang D, Correia JJ, Stafford WF, Roberts CJ, Singh S, Hayes DB, Kroe-Barrett R, Nixon A, Laue TM. Weak IgG self- and hetero-association characterized by fluorescence analytical ultracentrifugation. Protein Sci. 2018;27:1334–48. doi:https://doi.org/10.1002/pro.3422.
- Harding SE, Johnson P. The concentration-dependence of macromolecular parameters. Biochem J. 1985;231:543–47. doi:https://doi.org/10.1042/bj2310543.
- Schuck P, Rossmanith P. Determination of the sedimentation coefficient distribution by least-squares boundary modeling. Biopolymers. 2000;54:328–41. doi:https://doi.org/10.1002/1097-0282(20001015)54:5<328::AID-BIP40>3.0.CO;2-P.
- Schuck P. Analytical ultracentrifugation as a tool for studying protein interactions. Biophys Rev. 2013;5:159–71. doi:https://doi.org/10.1007/s12551-013-0106-2.
- Wright RT, Hayes DB, Stafford WF, Sherwood PJ, Correia JJ. Characterization of therapeutic antibodies in the presence of human serum proteins by AU-FDS analytical ultracentrifugation. Anal Biochem. 2018;550:72–83. doi:https://doi.org/10.1016/j.ab.2018.04.002.
- Kroe RR, Laue TM. NUTS and BOLTS: applications of fluorescence-detected sedimentation. Anal Biochem. 2009;390:1–13. doi:https://doi.org/10.1016/j.ab.2008.11.033.
- Demeule B, Shire SJ, Liu J. A therapeutic antibody and its antigen form different complexes in serum than in phosphate-buffered saline: A study by analytical ultracentrifugation. Anal Biochem. 2009;388:279–87. doi:https://doi.org/10.1016/j.ab.2009.03.012.
- Wright RT, Hayes DB, Sherwood PJ, Stafford WF, Correia JJ. AUC measurements of diffusion coefficients of monoclonal antibodies in the presence of human serum proteins. Eur Biophys J. 2018;47:709–22. doi:https://doi.org/10.1007/s00249-018-1319-x.
- Zhao H, Lomash S, Glasser C, Mayer ML, Schuck P. Analysis of high affinity self-association by fluorescence optical sedimentation velocity analytical ultracentrifugation of labeled proteins: opportunities and limitations. PLoS One. 2013;8:e83439. doi:https://doi.org/10.1371/journal.pone.0083439.
- Ghirlando R, Balbo A, Piszczek G, Brown PH, Lewis MS, Brautigam CA, Schuck P, Zhao H. Improving the thermal, radial, and temporal accuracy of the analytical ultracentrifuge through external references. Anal Biochem. 2013;440:81–95. doi:https://doi.org/10.1016/j.ab.2013.05.011.
- Zhao H, Ghirlando R, Piszczek G, Curth U, Brautigam CA, Schuck P. Recorded scan times can limit the accuracy of sedimentation coefficients in analytical ultracentrifugation. Anal Biochem. 2013;437:104–08. doi:https://doi.org/10.1016/j.ab.2013.02.011.
- Brautigam CA. Calculations and publication-quality illustrations for analytical ultracentrifugation data. Methods Enzymol. 2015;562:109–33.
- Philo JS. A method for directly fitting the time derivative of sedimentation velocity data and an alternative algorithm for calculating sedimentation coefficient distribution functions. Anal Biochem. 2000;279:151–63. doi:https://doi.org/10.1006/abio.2000.4480.
- Batchelor GK. Sedimentation in a dilute dispersion of spheres. J Fluid Mech. 1972;52:245–68. doi:https://doi.org/10.1017/S0022112072001399.
- Lamm O. Die Differentialgleichung der Ultrazentrifugierung. Ark Mat Astr Fys. 1929;21B:1–4.
- Chaturvedi SK, Ma J, Zhao H, Schuck P. Use of fluorescence-detected sedimentation velocity to study high-affinity protein interactions. Nat Protoc. 2017;12:1777–91. doi:https://doi.org/10.1038/nprot.2017.064.
- Patel TR, Winzor DJ, Scott DJ. Allowance for radial dilution in evaluating the concentration dependence of sedimentation coefficients for globular proteins. Eur Biophys J. 2017;47:291–95. doi:https://doi.org/10.1007/s00249-017-1259-x.