
ABSTRACT
Ensuring consistent high yields and product quality are key challenges in biomanufacturing. Even minor deviations in critical process parameters (CPPs) such as media and feed compositions can significantly affect product critical quality attributes (CQAs). To identify CPPs and their interdependencies with product yield and CQAs, design of experiments, and multivariate statistical approaches are typically used in industry. Although these models can predict the effect of CPPs on product yield, there is room to improve CQA prediction performance by capturing the complex relationships in high-dimensional data. In this regard, machine learning (ML) approaches offer immense potential in handling non-linear datasets and thus are able to identify new CPPs that could effectively predict the CQAs. ML techniques can also be synergized with mechanistic models as a ‘hybrid ML’ or ‘white box ML’ to identify how CPPs affect the product yield and quality mechanistically, thus enabling rational design and control of the bioprocess. In this review, we describe the role of statistical modeling in Quality by Design (QbD) for biomanufacturing, and provide a generic outline on how relevant ML can be used to meaningfully analyze bioprocessing datasets. We then offer our perspectives on how relevant use of ML can accelerate the implementation of systematic QbD within the biopharma 4.0 paradigm.
Introduction
Biopharmaceuticals such as monoclonal antibodies (mAbs) and fusion proteins are currently the most lucrative drugs in the market: 7 of the top 10 drugs in 2019 are biopharmaceuticals.Citation1 Unlike small molecules, biopharmaceuticals are large, complex drugs that are typically produced using live mammalian cells.Citation2 The biological activity of biopharmaceuticals is extremely sensitive to variations in their critical quality attributes (CQAs), such as the N-glycosylation, charge distribution and aggregation.Citation3–6 The biopharmaceutical product quality is also extremely sensitive to changes in the underlying biomanufacturing operating conditions and raw materials. Even a minor variation in bioreactor physicochemical conditions such as pH, temperature, dissolved oxygen (dO2) and cell culture media can lead to significant alterations in different product quality attributes. For example, cell culture pH has been shown to greatly affect multiple quality attributes of the mAbs, including N-glycosylation,Citation7–10 aggregation,Citation10,Citation11 and charge variations.Citation10,Citation12 Therefore, biomanufacturing is highly regulated to ensure the safety and efficacy of biologic products.
In traditional biomanufacturing, product quality in biopharmaceuticals is evaluated using a quality by testing approach.Citation13 However, significantly higher wastage (more than 50% in some cases) and the subsequent inability to understand the root cause of inefficient bioprocesses have prompted drug regulators such as US Food and Drug Administration (FDA) and European Medicines Agency (EMA) to recommend the adoption of the Quality by Design (QbD) approach.Citation14 QbD approaches rely on the comprehensive understanding of the product and the associated manufacturing processes where the CQAs of the product and its yield would be viewed as a function of various critical process parameters (CPPs). Bioprocesses are now routinely designed following the QbD paradigm,Citation15 whereby the CPPs that affect the product yield and CQAs are first identified and the manufacturing process is regulated and monitored accordingly. In QbD, design of experiments (DoE) is first used to conduct experiments in a structured manner with variations in CPPs such as pH, temperature, and cell culture media and to measure the corresponding variations in product yield, CQAs and cell growth. Multi-variate data analysis (MVDA) techniques are then used to model the multivariate and multi-collinear relationships between the CPPs and CQAs from the datasets generated using DoE.Citation15,Citation16
In this review, we first summarize how mathematical modeling, both statistical and mechanistic approaches, are used in QbD with respect to upstream mammalian cell culture design in biomanufacturing. Particularly, we analyze and report the various statistical modeling approaches used to examine examined the CQAs-CPPs relationships in biopharmaceutical manufacturing from published studies. Next, we highlight the advantage of ML algorithms and hybrid ML-mechanistic modeling approaches in a bid to increase the accuracy of model predictions, explain the relationships between CPPs and CQAs and to reduce the number of experiments required during a change in process condition and/or product. Finally, we describe the challenges and provide our perspectives on establishing sophisticated ML and hybrid models to enhance upstream bioprocess designs.
Biomanufacturing QbD tour de force by multivariate analysis
Initially proposed by the FDA’s Office of Biotechnology Products in the 2000s,Citation14 QbD was quickly adopted by the biopharmaceutical industry for designing and monitoring mammalian cell cultures. A wide array of CPPs, such as dO2, pH, temperature, and cell culture medium (i.e., the composition of various biochemical compounds in which the cells are cultured), were shown to influence the various performance indicators of the cell culture, i.e., cell growth, biopharmaceutical productivity and its quality (). The majority of such published mammalian QbD studies have used MVDA techniques to mathematically model the multi-factorial and multi-collinear relationships among and between the input (CPPs) and output (titer, cell growth and CQAs) variables (; Suppl. ). MVDA methods are popular because of their simplicity and the ease of use: several software tools such as Minitab® (Minitab Inc., State College, PA), MODDOE® and SIMCA® (Umetrics AB, Kinnelon, NJ) are available and facilitate the systematic implementation of DoE and MVDA together for industrial processes.
Table 1. The pros and cons of MVDA and machine learning
Figure 1. Historical trends of QbD in biomanufacturing. A comprehensive literature survey was performed focussing on studies which employed QbD in upstream bioprocessing to analyze the CPP, titer and CQA inter-relationships. (a) Conventional QbD framework: Selected process parameters are varied within a range as guided by DoE and the corresponding variations in titer and CQAs are measured, and the CPP – titer/CQA interrelationship is analyzed using statistical approaches. (b) Historical trends in the focus of process outputs and the statistical methods used to establish mathematical models.
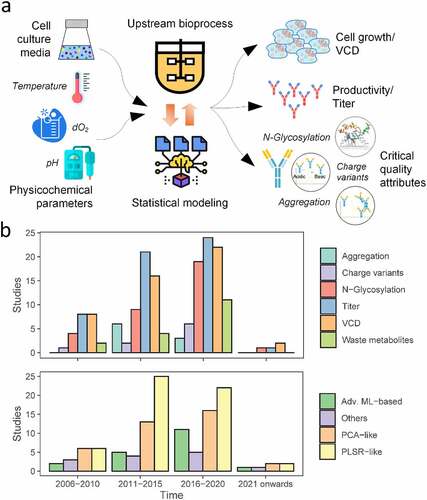
Among various MVDA approaches, principal component analysis (PCA) is a technique commonly used to understand the major trends and patterns from mammalian bioprocesses. In this method, the original dataset is orthogonally projected into a low-dimensional space of new uncorrelated variables, called principal components (PCs), to better describe the relationships among different variables in the original dataset. PCs corresponding to the variables that vary together tend to cluster together in the transformed space. Various studies have used PCA to mine historical bioprocess datasets and identified the CQAs (N-glycan species, charge variants and aggregates) that are correlated with one another.Citation17–22 Other studies used PCA to identify similar trends in specific amino acid consumption profiles in mammalian cell culture,Citation23–26 as well as metabolites that vary together with the cell culture progression.Citation27–30 It should be noted that identification of such common trends within the CQAs (for example, N-glycans that always vary together) and CPPs (for example, amino acids that consistently show a similar consumption pattern) could be helpful in reducing the resources spent on monitoring each of those CQA and CPP during biomanufacturing.
Partial least-squares regression (PLSR), which is also a commonly used technique, is very similar to PCA. In this method, the original dataset is first projected onto an orthogonal low-dimensional space and linear regression is performed to establish the relations and interactions among different variables. PLSR is extensively used to identify CQAs-CPPs correlation/relationship in biomanufacturing QbD: several studies have particularly used PLSR to explore the effect of individual components in the cell culture medium (e.g., glucose, glutamine, glutamate, other amino acids) on various process outcomes such as viable cell density (VCD)/cell growth,Citation23,Citation31–33 titer,Citation17,Citation19,Citation22,Citation23,Citation25,Citation32–35 toxic by-product (lactate and ammonia) accumulation,Citation23,Citation31,Citation34 and CQAs such as N-glycosylation,Citation17,Citation18,Citation21,Citation22,Citation25,Citation35,Citation36 aggregation,Citation17,Citation18 and charge variants.Citation17,Citation18 Other studies have also associated the impact of cell culture pHCitation19,Citation34,Citation37–39 and dO2Citation34,Citation39 with process outcomes using this method. PLSR is the most popular technique used in process analytical technologies (PAT) for interpreting the real-time indirect measurements of media components, CQAs and cell density based on in situ spectra methods such as 2D fluorescence, dielectric capacitance, near-infrared, mid-infrared, and Raman. The most common PAT and associated data analysis techniques are discussed in several comprehensive reviews.Citation16,Citation40,Citation41
Moving beyond conventional MVDA for implementing QbD
Toward building advanced ML models
As mentioned earlier, MVDA methods such as PCA and PLSR are commonly used to analyze cell culture data and to uncover the CQAs-CPPs inter-relationship. MVDA methods transform the data into a low-dimensional space and subsequently reduce the number of dimensions from the original dataset. This could result in loss of some information from the original dataset during transformation. Moreover, since biological processes are inherently complex, it is likely that the relationships between CCP and CQAs are non-linear in nature, especially as the number of CPPs grow larger with improved characterization of bioreactor read-outs. Consequently, the use of linear models such as PCA and PLSR could be insufficient to capture the underlying CQAs-CPPs relationships. In addition, the accuracy of MVDA methods in relating CPP and CQAs could also be significantly lower than the accepted norms.Citation37 Therefore, more sophisticated approaches based on advanced machine learning (ML) algorithms can be developed to overcome these issues. For instance, with the emergence of new variables derived from more thorough analysis of media components, feeding strategies and omics studies, advanced ML algorithms may increase QbD potential compared to classical statistics. A list of the advantages and disadvantages of MVDA and ML are provided in . In certain applications, MVDA could be the best approach, particularly when the number of input variables (CPPs) is small.
Despite the advantages of ML in certain applications, few articles describing ML-based prediction of attributes such as titer, viable cell density and glycosylation have been published. This suggests that ML is still in its infancy for QbD applications. In one such work, Artificial Neural Networks (ANNs) were combined with DOE to predict the percentage of cell doublings (i.e., cell growth) from cell seeding density, media supplement percentage, media exchange volume during routine feeding, and media exchange.Citation42 The ANN-DOE model was shown to have significantly improved predictive accuracy compared to models developed using standard linear regression. In another article, ANNs were again used to predict CQAs of etanercept, a recombinant protein, expressed in a mammalian cell culture.Citation43 In particular, the mAb concentration was predicted using inputs consisting of daily data points of fluorescence excitation-emission matrices. Again, the ANN was shown to be superior to PLS due to its non-linear modeling capabilities. Schmidberger et al. developed a forecasting model based on PLSR and multiple ML methods such as random forests (RF), radial basis function neural network (RBF-ANN) and support vector machines (SVM) to predict product titer, charge variants and glycoforms using physiochemical CPP inputs from several days before harvesting of the cells from the bioreactor.Citation35 Interestingly, in this case, it was found that both ML (SVM, RF and ANNs) and PLSR performed equally well for predicting VCD and titer, suggesting that MVDA can be sufficient for these variables. However, the PLSR model showed decreased performance compared with ML models while predicting N-glycosylation. Another study compared the predictive performance of PLSR with ML models such as SVM, Gaussian process regression (GPR), regression trees (RT) and ensemble trees (ET) for predicting the titer from various CPPs, and noted the performance PLSR and GPR were better than ML models.Citation44 Finally, we anticipate the number of ML applications to grow in the coming years due to ongoing interest from the biopharmaceutical industry.Citation45 To help explain how ML can be applied to QbD and to stimulate discussion, we have provided an example case showing the construction and use of a model to simulate CQAs based on different feeding and physiochemical variables ().
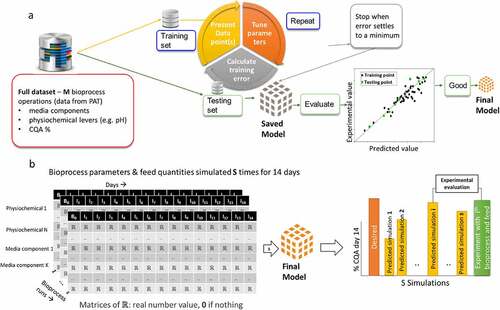
Figure 2. Example ML application for simulating CQAs using different feeding and physiochemical variables. (a) The training and testing strategy to develop the final feeding and physiochemical model. From the full dataset of M fed-batch cultures, split it into a training set used for model optimization and a testing set used to evaluate the performance of the model. The final model is the one that performs best on the test set; (b) If the model performance is acceptable in (A), then it can be used to simulate what media components and physiochemical variables can be used for a desired CQA prediction. In this example, “s” simulations are performance with the ith showing closest match to the desired CQA. A final validation of the model can be done by using the ith CPPs in the fed batch process to confirm experimentally that the desired CQA was achieved.
Toward mechanistic-ML hybrid modeling approaches
One of the major limitations when using purely statistical modeling approaches for QbD is that such methods merely correlate the CPPs and CQAs in an empirical manner and do not provide information on the causal relationships between them. As such, this approach has to be exhaustively repeated for each bioprocess campaign to account for even a minor variation in media, feed, pH, and similar class of products, such as biosimilars with identical manufacturing conditions. This will inevitably inflate the costs of bioprocess development and biomanufacturing. Developing a QbD framework that relies on the mechanistic understanding of the underlying processes could allow it to be applied across different bioprocessing campaigns and would be a major step toward enabling real-time, adaptive control of CQAs during the biomanufacturing process. In this regard, although various comprehensive mechanistic models exist for some of the cellular processes associated with protein synthesis in mammalian cells (see refs.Citation46–49 for available mechanistic models on metabolism and N-glycosylation), the integration of these models is quite challenging due to the varying mathematical approaches (e.g., kinetic, constraint-based and Bayesian modeling approaches), incomplete parameterization and the different units/scales used to model each of the cellular process.
In order to address the above-mentioned challenges, the development of hybridized ML or white box ML models could be an useful alternative, as these models can adopt the known underlying mechanisms to model certain cellular processes such as metabolism while relying on the ML-based approaches to model other less investigated processes.Citation50 Here, it should be highlighted that while the concept of hybrid models in bioprocessing existed from the 1990s and has been implemented for bacteria and yeast cell-based systems, studies that hybridized MVDA or ML approach with mechanistic models to investigate mammalian cell cultures started to appear only around 2010. Comprehensive reviews on mammalian cell culture hybrid models and their genesis are available.Citation50–52 In one such study, Zalai and colleagues built a hybrid model by combining metabolic flux analysis and PLSR to identify the key intracellular fluxes that are associated with lactate accumulation and recombinant product synthesis.Citation53 Recently, Kotidis and Kontravadi developed a hybrid model whereby ANNs and kinetic model were merged to link the key CQA, N-glycosylation, with cellular metabolism.Citation54 This hybrid model was able to successfully predict the variations in N-glycosylation of two fusion proteins (Fc-DAO and EPO-Fc) and two IgG mAbs upon changes in nucleotide sugar and trace metal supplementation in cell culture media more accurately with a smaller number of parameters than a fully mechanistic model.Citation55 Moreover, this model provides mechanistic insights on how various intracellular pathways are affected by media additives, which in turn affect the N-glycosylation. Similarly, another study recently reported a hybrid model that combining ANNs and material balance-based process models to predict the cell growth and titer from various process variables, and the performance of this model was shown to be superior to PLSR models.Citation56 The authors used ANNs to approximate the unknown uptake/secretion rates of cell culture metabolites from various process measurements such as pH, pO2, pCO2, osmolality, glutamine, and glutamate concentrations, which were then used in the process models to predict the final titer of the product.
The art of developing a successful ML model to advance QbD
Presently, with the readily available open-source ML programming libraries such as Scikit-learn,Citation57 an efficient ML model to advance QbD can be developed. However, implementing an ML algorithm correctly for a biomanufacturing process is not as simple as downloading a library and optimizing it using a bioprocessing dataset. There are various challenges in the development of the model and in testing its performance. Here, we describe two of the most common ML approaches used, the types of input and output for QbD ML, and the most critical factors when developing correct ML algorithms.
Selection of supervised vs unsupervised ML:
In what is known as supervised ML, models are presented with the input and output variables and learning proceeds by optimizing parameters so that the model predictions are as close as possible to the output variables. That is, the output variable is used to supervise the model optimization. On the other hand, if the output target variable is unknown, and the input variables are solely used to find clusters or patterns in the data that may correspond to the underlying process, then it is classified as unsupervised ML. The selection of supervised versus unsupervised methods depends on the nature of the question being addressed. Supervised ML is the most suitable approach to identify the non-linear relationship between CPPs and CQAs, whereas unsupervised ML can be used to identify CQAs that are correlated with each other. Discussion of the most common ML algorithms can be found in ref.Citation58
ML input and output in QbD:
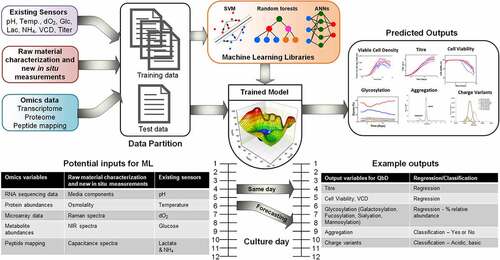
shows an example of a supervised ML model in which CQAs (output target variables) are to be predicted using different measurements available from cell culture media and physicochemical parameters such as pH and temperature as input variables. Note that a wide range of input variables, such as direct measurements of cell density, titer, and other basic metabolites, and in situ measurements using spectroscopy or other soft sensor measurements, physicochemical parameters (e.g., pH, dO2, pO2, pCO2 or temperature) and even intra and extracellular omics data (e.g., transcriptome, proteome, metabolome), can also be used in any combination. In brief, the goal of any ML algorithm is to identify a model (or function) that uses a specific combination of the input variables (CPPs) to predict a CQA value that is as close as possible to the experimentally determined CQA target.
Developing ML algorithms that are useful in QbD:
It is straightforward to develop ML algorithms incorrectly, resulting in models that do not perform accurately on new data. A complete set of community-wide recommendations that aim to establish requirements for ML validation in biology was published recently by Walsh et al.Citation59 The recommendations are split into four core areas of ML: data, optimization, the model, and evaluation of the final model. Topics relevant to QbD ML modeling include splitting datasets correctly, avoiding overfitting when optimizing, and how to evaluate the performance of the ML algorithm using appropriate metrics. To ensure correctness and reproducibility of ML methods, summary table of how the ML algorithm was constructed should be provided in the supporting information of any ML QbD study, as per previously established guidelines.Citation59
One of the most influential factors in deciding the type of ML algorithm to use is the number of data points available from the cell culture vs. the number of parameters to tune in the ML algorithm. A data point is an experiment at a particular time in the culture that determines an input and output variable (). For example, metabolite quantities (input) at day 5 and titer (output in mg/L) at day 5 is a single data point. A parameter is internal to the model and is a configurable variable that is estimated from the data points. If the number of data points is extremely large, then deep learning approaches that need tuning of large amounts of parametersCitation60 could be used – a rough estimate for such approaches would be more than 1000 data points. Algorithms with a smaller number of parameters are more suitable for datasets with lesser data points. Multi-layer perceptronCitation61 and/or RFCitation62 are examples of algorithms with typically fewer parameters to optimize compared to deep learning methods such as ANNs. In the example ML problem considered here (), the use of random forests would be appropriate for such medium-size data.
In supervised ML, data should be divided into independent parts before training. This usually involves creating a training set for parameter optimization and a test set for measuring the predictive performance. In the example ML considered here (), independent train/test splits could be training data from five separate culture experiments and test data from additional two different culture experiments. A third set could be also used, called a validation set, to tune hyper-parameters (e.g., the number of layers in a neural network). The best option, if the size of the data permits, is to do N-fold cross validation where there are N repeats of N-1 partitions for training and the other for testing.Citation63 When N equals the number of data points, N-fold cross validation is known as leave one out validation because there is a single test point in each of the N repeated trainings.
Feature selection:
The number of input variables can be large in bioprocessing operations, especially when considering in situ measurements and multi-omics data.Citation10 Finding and using the most relevant factors and ignoring the redundant ones is the goal of feature selection (FS) algorithms.Citation64 FS has numerous advantages in ML such as reducing the chance of over-fitting, reducing computational cost and in some cases improving prediction performance. In QbD approaches, FS is very important, as the identification of the important variables/features may provide new knowledge on the key levers to control the bioreactor. An example of a FS method known as nonparametric regression with Gaussian kernel (NRGK) was previously used to improve product titer.Citation65 In this work, the authors also proved that the NRGK selection (an ML approach) of the CPPs was superior to PLSR.
Types of prediction:
There are two useful prediction types when modeling QbD of biologics expressed in a cell culture: real-time prediction (“at the moment” the data arrive from the bioreactor via an instrument) or the prediction of future CQA values using data currently collected from the bioreactor, which are labeled “same day” and “forecasting” in , respectively. For truly real-time prediction, the models used would need instantaneous input from real-time bioreactor assays and data extracted from instruments (e.g., peak picking, identification, and quantitation of bioreactor molecules using LC-MS). Forecasting has received little attention to date, perhaps because of its difficulty, yet it is very important for manufacturing because it enables preemptive action to be taken when the forecast outlook is undesirable. Further, prediction can be divided into two types of output: regression, where the models produce a real numbered CQA value (e.g., titer in mg/L) and classification, where events or labels can be assigned to a bioreactor state (e.g., desired vs. undesired N-glycosylation).
Figure 3. Hypothetical ML model and their multiple applications in QbD. The tables show all CPPs and CQAs found in the literature, whether the CQAs are a regression or classification ML problem. Real-time models are trained to predict the output variables on the same day (or same moment) the input variables are collected. Forecasting involves using data from the current day and previously to predict a future days CQA.
Challenges in building an accurate and reproducible ML-based QbD framework
While ML models offer potential over conventional MVDA in identifying significant CPPs within an allowable range that affect CQAs with good accuracy, one notable limitation is the large data requirement for a model to be well-trained and able to produce desirable predictions on unseen data. Generation of large amounts of biomanufacturing data is highly challenging, as each bioprocessing campaign is quite expensive. Companies must invest in automated samplers, digitization, and high-throughput technologies to generate large amounts of data with minimal human effort. Moreover, substantial resources and investment are required to store the historical data in an organized manner so that it can be both expanded and continuously used to improve the model predictions successively. In order to achieve this goal, pharmaceutical companies are now investing in both digitization technologies and big data management services such as cloud data storage and Internet of Things (IoT).Citation66 While investing in data accumulation over a period of time can reap benefits for individual players, establishing a consortium among both public and private biomanufacturing data generators could accelerate the pace at which data are generated and could benefit the wider community. Such efforts require the pharmaceutical companies to work together while still protecting their sensitive information. Academia must also play a role to release datasets for the public to use freely.
Adding to the data availability problem is the large diversity of data used in current QbD modeling. For instance, there may be multiple datasets with different cell expression systems, products, culture CPP variables, culture durations and time point intervals analyzed. This makes the cross comparison of models almost impossible. A solution that is also gaining traction in other ML fields is to have a consensus from the QbD modeling community on a standard data format, an ontology or minimum informationCitation67,Citation68 required for a QbD modeling experiment. This will greatly enhance the reproducibility of models, and laboratories with the capabilities to develop sophisticated models can use the standardized datasets to compare their performance against current baselines.
Apart from the technical issues in adopting ML models for QbD, concerns related to regulatory approval also exist. Even if a newly designed process that integrate the models is shown to improve its efficiency compared to the previously designed ones based on MVDA, the lack of prior knowledge in obtaining regulatory approvals using the ML models could still prohibit its successful adoption. Another challenge in revising an existing bioprocess is the requirement of multiple filings across different regulators, such as FDA and EMA. In this regard, while obtaining post-approval regulatory changes could be a substantial challenge for improving an existing originator drug biomanufacturing process, it could be easier to adopt ML-based models in the innovator or new biosimilar/biobetter process design campaigns.
Future perspectives
With the accumulation of large-scale data in biomanufacturing and PAT, the adoption of ML models in place of MVDA methods is increasing. Apart from increasing the accuracy and capturing non-linearity between CPPs and CQAs, ML models can expand the scope further. This has been achieved in other areas such as proteomics where sophisticated ML models already exist for predicting protein structure from their sequence.Citation69 However, to achieve the same ML performance for CQA prediction of a protein therapeutic from their sequence, measurements from bioreactor should also be considered. For instance, both the intrinsic sequence/structure properties and experimental conditions (extrinsic factors) need to be considered for predicting protein aggregation. Yet most current models for aggregation, only use information from sequence-based input and in some cases protein structure,Citation70 but ignore the extrinsic factors such as cell culture pH, dO2, temperature, salt content and final formulation (to name a few), which also must be considered in the development of future QbD models predicting aggregation. Furthermore, existing models are mainly developed for amyloid-type aggregation in disease and they often assume the presence of hydrogen bonding, hydrophobicity, electrostatic, and solvation energetics,Citation71,Citation72 whereas aggregation of biologics is heavily influenced by charge variants.Citation73,Citation74 Again, this emphasizes the current need for newer aggregation models specifically tuned for biologics in bioprocessing operations.
The biological activity of protein biologics is often affected by a multitude of post-translational modifications that can influence charge distribution. Similar to aggregation, ML models can also play a role in predicting charge variants. Nikita et al. described a reinforcement ML algorithm where they formulated a maximization problem using cation exchange chromatography for separation of charge variants by optimization of the process flowrate.Citation75 Mechanistic models such as general rate models were shown to predict elution peaks in ion-exchange process chromatography.Citation76 The proposed model can be used to predict the separation of charge variants, allowing optimization and control of preparative scale chromatography. However, literature on models for charge variant characterization is limited and further work is required in this space, particularly to incorporate ML into the characterization.
Apart from the full ML models, we also earlier highlighted the useful nature of hybrid ML models. The establishment of a hybrid ML model is advantageous, as it enables a paradigm shift in QbD, which is currently product centric, into a knowledge centric one. In one of the hybrid ML model described previously,Citation54 the changes in product yield and the nucleotide sugar precursors are systematically predicted from the mechanistic model of metabolism, while the changes in N-glycosylation are then predicted as a function of mechanistic model elements. Since this model already captures the metabolic pathways that influence the product synthesis and cell growth, a change in product will not require it to be retrained as long as the biosynthetic machinery of the host cell line remains the same. Complex hybrid models can also be established with the help of ML techniques whereby multiple mechanistic models of various cellular processes are combined that otherwise cannot be integrated directly due to the differences in units/scales used to model each process. For instance, the mechanistic models of metabolismCitation77–80 and N-glycosylationCitation81–84 can be combined via ML techniques to systematically predict the variations in CQAs upon changes in CPPs. Moreover, since hybrid ML models provide mechanistic insights on the CQA–CPP interrelationships, it can facilitate efficient real-time prediction and control by leveraging on appropriate bioprocess levers, rapidly evaluate clone performances and guide rational cell-line engineering by targeting the relevant/sensitive pathways.
Overall, we believe that the recent developments in the PAT and bioprocess data digitization are poised to accelerate the systematic QbD with the help of sophisticated ML models, which will ultimately result in a more sustainable and economical way of biomanufacturing.
Abbreviations
Supplemental Material
Download Zip (87.1 KB)Acknowledgments
This review was supported by Biomedical Research Council of A*STAR (Agency for Science, Technology and Research), Singapore and Industry Alignment Funds (H20H8a0003 to Y.S.H., S.K.N. and M.L.; I1901E0047 to S.K.N. and M.L.; H19H6a0026 to Y.S.H.) funded by National Research Foundation, Singapore and A*STAR, Singapore. I. W. is supported by the Career Development Award (No. C210112057) from A*STAR, Singapore.
Disclosure statement
No potential conflict of interest was reported by the author(s).
Supplementary material
Supplemental data for this article can be accessed on the publisher’s website.
Additional information
Funding
References
- Urquhart L. Top companies and drugs by sales in 2019. Nat Rev Drug Discov. 2020;19(4):228. doi:10.1038/d41573-020-00047-7.
- Wurm FM. Production of recombinant protein therapeutics in cultivated mammalian cells. Nat Biotechnol. 2004;22(11):1393–11. doi:10.1038/nbt1026.
- Pereira NA, Chan KF, Lin PC, Song Z. The “less-is-more” in therapeutic antibodies: afucosylated anti-cancer antibodies with enhanced antibody-dependent cellular cytotoxicity. mAbs. 2018;10(5):693–711. doi:10.1080/19420862.2018.1466767.
- Goetze AM, Liu YD, Zhang Z, Shah B, Lee E, Bondarenko PV, Flynn GC. High-mannose glycans on the Fc region of therapeutic IgG antibodies increase serum clearance in humans. Glycobiology. 2011;21:949–59.
- Li B, Tesar D, Boswell CA, Cahaya HS, Wong A, Zhang J, Gloria M, Eigenbrot C, Pantua H, Diao J, et al. Framework selection can influence pharmacokinetics of a humanized therapeutic antibody through differences in molecule charge. mAbs. 2014;6(5):1255–64. doi:10.4161/mabs.29809.
- Igawa T, Tsunoda H, Tachibana T, Maeda A, Mimoto F, Moriyama C, Nanami M, Sekimori Y, Nabuchi Y, Aso Y, et al. Reduced elimination of IgG antibodies by engineering the variable region. Protein Eng Des Sel. 2010;23(5):385–92. doi:10.1093/protein/gzq009.
- Aghamohseni H, Ohadi K, Spearman M, Krahn N, Moo-Young M, Scharer JM, Butler M, Budman HM. Effects of nutrient levels and average culture pH on the glycosylation pattern of camelid-humanized monoclonal antibody. J Biotechnol. 2014;186:98–109. doi:10.1016/j.jbiotec.2014.05.024.
- Ivarsson M, Villiger TK, Morbidelli M, Soos M. Evaluating the impact of cell culture process parameters on monoclonal antibody N-glycosylation. J Biotechnol. 2014;188:88–96. doi:10.1016/j.jbiotec.2014.08.026.
- Jiang R, Chen H, Xu S. pH excursions impact CHO cell culture performance and antibody N-linked glycosylation. Bioprocess Biosyst Eng. 2018;41(12):1731–41. doi:10.1007/s00449-018-1996-y.
- Lee AP, Kok YJ, Lakshmanan M, Leong D, Zheng L, Lim HL, Chen S, Mak SY, Ang KS, Templeton N, et al. Multi-omics profiling of a CHO cell culture system unravels the effect of culture pH on cell growth, antibody titer and product quality. Biotechnol Bioeng. 2021;bit:27899.
- Paul AJ, Handrick R, Ebert S, Hesse F. Identification of process conditions influencing protein aggregation in Chinese hamster ovary cell culture. Biotechnol Bioeng. 2018;115(5):1173–85. doi:10.1002/bit.26534.
- Xie P, Niu H, Chen X, Zhang X, Miao S, Deng X, Liu X, Tan WS, Zhou Y, Fan L. Elucidating the effects of pH shift on IgG1 monoclonal antibody acidic charge variant levels in Chinese hamster ovary cell cultures. Appl Microbiol Biotechnol. 2016;100(24):10343–53. doi:10.1007/s00253-016-7749-4.
- Zhang L, Mao S. Application of quality by design in the current drug development. Asian J Pharm Sci. 2017;12(1):1–8. doi:10.1016/j.ajps.2016.07.006.
- Rathore AS, Winkle H. Quality by design for biopharmaceuticals. Nat Biotechnol. 2009;27(1):26–34. doi:10.1038/nbt0109-26.
- Sadowski MI, Grant C, Fell TS. Harnessing QbD, programming languages, and automation for reproducible biology. Trends Biotechnol. 2016;34(3):214–27. doi:10.1016/j.tibtech.2015.11.006.
- Mercier SM, Diepenbroek B, Wijffels RH, Streefland M. Multivariate PAT solutions for biopharmaceutical cultivation: current progress and limitations. Trends Biotechnol. 2014;32(6):329–36. doi:10.1016/j.tibtech.2014.03.008.
- Sokolov M, Morbidelli M, Butté A, Souquet J, Broly H. Sequential multivariate cell culture modeling at multiple scales supports systematic shaping of a monoclonal antibody toward a quality target. Biotechnol J. 2018;13(4):e1700461.
- Sokolov M, Ritscher J, MacKinnon N, Souquet J, Broly H, Morbidelli M, Butté A. Enhanced process understanding and multivariate prediction of the relationship between cell culture process and monoclonal antibody quality. Biotechnol Prog. 2017;33(5):1368–80. doi:10.1002/btpr.2502.
- Sokolov M, Soos M, Neunstoecklin B, Morbidelli M, Butté A, Leardi R, Solacroup T, Stettler M, Broly H. Fingerprint detection and process prediction by multivariate analysis of fed-batch monoclonal antibody cell culture data. Biotechnol Prog. 2015;31(6):1633–44. doi:10.1002/btpr.2174.
- Sokolov M, Ritscher J, MacKinnon N, Bielser JM, Brühlmann D, Rothenhäusler D, Thanei G, Soos M, Stettler M, Souquet J, et al. Robust factor selection in early cell culture process development for the production of a biosimilar monoclonal antibody. Biotechnol Prog. 2017;33(1):181–91. doi:10.1002/btpr.2374.
- Zürcher P, Sokolov M, Brühlmann D, Ducommun R, Stettler M, Souquet J, Jordan M, Broly H, Morbidelli M, Butté A. Cell culture process metabolomics together with multivariate data analysis tools opens new routes for bioprocess development and glycosylation prediction. Biotechnol Prog. 2020;36(5):e3012. doi:10.1002/btpr.3012.
- Powers DN, Trunfio N, Velugula-Yellela SR, Angart P, Faustino A, Agarabi C. Multivariate data analysis of growth medium trends affecting antibody glycosylation. Biotechnol Prog. 2020;36(1):e2903. doi:10.1002/btpr.2903.
- Selvarasu S, Kim DY, Karimi IA, Lee DY. Combined data preprocessing and multivariate statistical analysis characterizes fed-batch culture of mouse hybridoma cells for rational medium design. J Biotechnol. 2010;150(1):94–100. doi:10.1016/j.jbiotec.2010.07.016.
- De Alwis DM, Dutton RL, Scharer J, Moo-Young M. Statistical methods in media optimization for batch and fed-batch animal cell culture. Bioprocess Biosyst Eng. 2007;30(2):107–13. doi:10.1007/s00449-006-0107-7.
- Green A, Glassey J. Multivariate analysis of the effect of operating conditions on hybridoma cell metabolism and glycosylation of produced antibody. J Chem Technol Biotechnol. 2015;90(2):303–13. doi:10.1002/jctb.4481.
- Powers DN, Wang Y, Fratz-Berilla EJ, Velugula-Yellela SR, Chavez B, Angart P, Trunfio N, Yoon S, Agarabi C. Real-time quantification and supplementation of bioreactor amino acids to prolong culture time and maintain antibody product quality. Biotechnol Prog. 2019;35(6):e2894. doi:10.1002/btpr.2894.
- Chong WPK, Goh LT, Reddy SG, Yusufi FNK, Lee DY, Wong NSC, Heng CK, Yap MGS, Ho YS. Metabolomics profiling of extracellular metabolites in recombinant Chinese Hamster Ovary fed-batch culture. Rapid Commun Mass Spectrom. 2009;23(23):3763–71. doi:10.1002/rcm.4328.
- Dietmair S, Hodson MP, Quek LE, Timmins NE, Chrysanthopoulos P, Jacob SS, Gray P, Nielsen LK. Metabolite profiling of CHO cells with different growth characteristics. Biotechnol Bioeng. 2012;109(6):1404–14. doi:10.1002/bit.24496.
- Sternisha SM, Mukherjee P, Alex A, Chaney EJ, Barkalifa R, Wan B, Lee JH, Rico-Jimenez J, Žurauskas M, Spillman DR, et al. Longitudinal monitoring of cell metabolism in biopharmaceutical production using label-free fluorescence lifetime imaging microscopy. Biotechnol J. 2021;16(7):2000629. doi:10.1002/biot.202000629.
- Walther J, Lu J, Hollenbach M, Yu M, Hwang C, McLarty J, Brower K. Perfusion cell culture decreases process and product heterogeneity in a head-to-head comparison with fed-batch. Biotechnol J. 2019;14(2):1700733. doi:10.1002/biot.201700733.
- Kirdar AO, Green KD, Rathore AS. Application of multivariate data analysis for identification and successful resolution of a root cause for a bioprocessing application. Biotechnol Prog. 2008;24(3):720–26. doi:10.1021/bp0704384.
- Rouiller Y, Périlleux A, Collet N, Jordan M, Stettler M, Broly H. A high-throughput media design approach for high performance mammalian fed-batch cultures. mAbs. 2013;5(3):501–11. doi:10.4161/mabs.23942.
- Hakemeyer C, Strauss U, Werz S, Folque F, Menezes JC. Near-infrared and two-dimensional fluorescence spectroscopy monitoring of monoclonal antibody fermentation media quality: aged media decreases cell growth. Biotechnol J. 2013;8(7):835–46. doi:10.1002/biot.201200355.
- Le H, Kabbur S, Pollastrini L, Sun Z, Mills K, Johnson K, Karypis G, Hu WS. Multivariate analysis of cell culture bioprocess data—Lactate consumption as process indicator. J Biotechnol. 2012;162(2–3):210–23. doi:10.1016/j.jbiotec.2012.08.021.
- Schmidberger T, Posch C, Sasse A, Gülch C, Huber R. Progress toward forecasting product quality and quantity of mammalian cell culture processes by performance-based modeling. Biotechnol Prog. 2015;31(4):1119–27. doi:10.1002/btpr.2105.
- Rathore AS, Kumar Singh S, Pathak M, Read EK, Brorson KA, Agarabi CD, Khan M. Fermentanomics: relating quality attributes of a monoclonal antibody to cell culture process variables and raw materials using multivariate data analysis. Biotechnol Prog. 2015;31(6):1586–99. doi:10.1002/btpr.2155.
- Rouiller Y, Solacroup T, Deparis V, Barbafieri M, Gleixner R, Broly H, Eon-Duval A. Application of Quality by Design to the characterization of the cell culture process of an Fc-Fusion protein. Eur J Pharm Biopharm. 2012;81(2):426–37. doi:10.1016/j.ejpb.2012.02.018.
- Ohadi K, Legge RL, Budman HM. Intrinsic fluorescence-based at situsoft sensor for monitoring monoclonal antibody aggregation. Biotechnol Prog. 2015;31(5):1423–32. doi:10.1002/btpr.2140.
- Brunner M, Fricke J, Kroll P, Herwig C. Investigation of the interactions of critical scale-up parameters (pH, pO 2 and pCO 2) on CHO batch performance and critical quality attributes. Bioprocess Biosyst Eng. 2017;40(2):251–63. doi:10.1007/s00449-016-1693-7.
- Glassey J, Gernaey KV, Clemens C, Schulz TW, Oliveira R, Striedner G, Mandenius CF. Process analytical technology (PAT) for biopharmaceuticals. Biotechnol J. 2011;6(4):369–77. doi:10.1002/biot.201000356.
- Teixeira AP, Oliveira R, Alves PM, Carrondo MJT. Advances in on-line monitoring and control of mammalian cell cultures: supporting the PAT initiative. Biotechnol Adv. 2009;27(6):726–32. doi:10.1016/j.biotechadv.2009.05.003.
- Rodriguez-Granrose D, Jones A, Loftus H, Tandeski T, Heaton W, Foley KT, Silverman L. Design of experiment (DOE) applied to artificial neural network architecture enables rapid bioprocess improvement. Bioprocess Biosyst Eng. 2021;44(6):1301–08. doi:10.1007/s00449-021-02529-3.
- Chiappini FA, Teglia CM, Forno ÁG, Goicoechea HC. Modelling of bioprocess non-linear fluorescence data for at-line prediction of etanercept based on artificial neural networks optimized by response surface methodology. Talanta. 2020;210:120664. doi:10.1016/j.talanta.2019.120664.
- Bayrak ES, Wang T, Tulsyan A, Coufal M, Undey C. Product attribute forecast: adaptive model selection using real-time machine learning. IFAC-PapersOnLine. 2018;51(18):121–25. doi:10.1016/j.ifacol.2018.09.286.
- Narayanan H, Luna MF, M Von S, Bournazou MNC, Polotti G, Morbidelli M, Butté A, Sokolov M. Bioprocessing in the digital age: the role of process models. Biotechnol J. 2020;15(1):1900172. doi:10.1002/biot.201900172.
- Kyriakopoulos S, Ang KS, Lakshmanan M, Huang Z, Yoon S, Gunawan R, Lee DY. Kinetic modeling of mammalian cell culture bioprocessing: the quest to advance biomanufacturing. Biotechnol J. 2018;13(3):e1700229. doi:10.1002/biot.201700229.
- Galleguillos SN, Ruckerbauer D, Gerstl MP, Borth N, Hanscho M, Zanghellini J. What can mathematical modelling say about CHO metabolism and protein glycosylation? Comput Struct Biotechnol J. 2017;15:212–21. doi:10.1016/j.csbj.2017.01.005.
- Kontoravdi C, Jimenez Del Val I. Computational tools for predicting and controlling the glycosylation of biopharmaceuticals. Curr Opin Chem Eng. 2018;22:89–97. doi:10.1016/j.coche.2018.08.007.
- Štor J, Ruckerbauer DE, Széliová D, Zanghellini J, Borth N. Towards rational glyco-engineering in CHO: from data to predictive models. Curr Opin Biotechnol. 2021;71:9–17. doi:10.1016/j.copbio.2021.05.003.
- Von Stosch M, Davy S, Francois K, Galvanauskas V, Hamelink JM, Luebbert A, Mayer M, Oliveira R, O’Kennedy R, Rice P, et al. Hybrid modeling for quality by design and PAT-benefits and challenges of applications in biopharmaceutical industry. Biotechnol J. 2014;9(6):719–26. doi:10.1002/biot.201300385.
- Tsopanoglou A, Jiménez Del Val I. Moving towards an era of hybrid modelling: advantages and challenges of coupling mechanistic and data-driven models for upstream pharmaceutical bioprocesses. Curr Opin Chem Eng. 2021;32:100691. doi:10.1016/j.coche.2021.100691.
- Sokolov M, Von Stosch M, Narayanan H, Feidl F, Butté A. Hybrid modeling — a key enabler towards realizing digital twins in biopharma? Curr Opin Chem Eng. 2021;34:100715. doi:10.1016/j.coche.2021.100715.
- Zalai D, Koczka K, Párta L, Wechselberger P, Klein T, Herwig C. Combining mechanistic and data-driven approaches to gain process knowledge on the control of the metabolic shift to lactate uptake in a fed-batch CHO process. Biotechnol Prog. 2015;31(6):1657–68. doi:10.1002/btpr.2179.
- Kotidis P, Kontoravdi C. Harnessing the potential of artificial neural networks for predicting protein glycosylation. Metab Eng Commun. 2020;10:e00131. doi:10.1016/j.mec.2020.e00131.
- Kotidis P, Jedrzejewski P, Sou SN, Sellick C, Polizzi K, Del Val IJ, Kontoravdi C. Model-based optimization of antibody galactosylation in CHO cell culture. Biotechnol Bioeng. 2019;116(7):1612–26. doi:10.1002/bit.26960.
- Narayanan H, Sokolov M, Butté A, Butté A. A new generation of predictive models: the added value of hybrid models for manufacturing processes of therapeutic proteins. Biotechnol Bioeng. 2019;116(10):2540–49. doi:10.1002/bit.27097.
- Pedregosa F, Varoquaux G, Gramfort A, Michel V, Grisel O, Blondel M, Prettenhofer P, Weiss R, Dubourg V, Vanderplas J, et al. Scikit-learn: machine Learning in Python. J Mach Learn Res. 2011;12:2825–30.
- Mahesh B. Machine Learning Algorithms-A Review. Int J Sci Res. 2018;7(3):1174-1179.
- Walsh I, Fishman D, Garcia-Gasulla D, Titma T, Pollastri G, Harrow J, Psomopoulos FE, Tosatto SCE. DOME: recommendations for supervised machine learning validation in biology. Nat Methods. 2021;18(10):1122-1127. doi: 10.1038/s41592-021-01205-4.
- LeCun Y, Bengio Y, Hinton G. Deep learning. Nat. 2015;521(7553):436-44. 5217553;. doi:10.1038/nature14539.
- Rumelhart DE, Hinton GE, Williams RJ. Learning representations by back-propagating errors. Nat. 1986;323:533–36;():. doi:10.1038/323533a0.
- Breiman L. Random Forests. Mach Learn. 2001;45(1):5–32. . doi:10.1023/A:1010933404324.
- Kohavi R. A study of cross-validation and bootstrap for accuracy estimation and model selection. Proc 14th Internat Jt Conf Artif Intell. 1995;14:1137–45.
- Guyon I, Elisseeff A. An introduction to variable and feature selection. J Mach Learn Res. 2003;3:1157–82.
- Zou M, Zhou ZW, Fan L, Zhang WJ, Zhao L, Liu XP, Bin WH, Tan WS. A novel method based on nonparametric regression with a Gaussian kernel algorithm identifies the critical components in CHO media and feed optimization. J Ind Microbiol Biotechnol. 2020;47:63–72. doi: 10.1007/s10295-019-02248-5.
- Demesmaeker M, Kopec D, Arsénio AM. Bioprocessing 4.0 – where are we with smart manufacturing in 2020? [Internet]. 2020; Available from: https://www.pharmoutsourcing.com/Featured-Articles/568001-Bioprocessing-4-0-Where-Are-We-with-Smart-Manufacturing-in-2020/
- Hernandez-Boussard T, Bozkurt S, Ioannidis JPA, Shah NH. MINIMAR (MINimum Information for Medical AI Reporting): developing reporting standards for artificial intelligence in health care. J Am Med Informatics Assoc. 2020;27(12):2011–15. doi:10.1093/jamia/ocaa088.
- Brazma A, Hingamp P, Quackenbush J, Sherlock G, Spellman P, Stoeckert C, Aach J, Ansorge W, Ball CA, Causton HC, et al. Minimum information about a microarray experiment (MIAME)—toward standards for microarray data. Nat Genet. 2001;29(4):365–71. 294. doi:10.1038/ng1201-365.
- Tunyasuvunakool K, Adler J, Wu Z, Green T, Zielinski M, Žídek A, Bridgland A, Cowie A, Meyer C, Laydon A, et al. Highly accurate protein structure prediction for the human proteome. Nature. 2021;596(7873):590–96. doi:10.1038/s41586-021-03828-1.
- Santos J, Pujols J, Pallarès I, Iglesias V, Ventura S. Computational prediction of protein aggregation: advances in proteomics, conformation-specific algorithms and biotechnological applications. Comput Struct Biotechnol J. 2020;18:1403–13. doi:10.1016/j.csbj.2020.05.026.
- Walsh I, Seno F, Tosatto SCE, Trovato A. PASTA 2.0: an improved server for protein aggregation prediction. Nucleic Acids Res. 2014;42(W1):W301–W307. doi:10.1093/nar/gku399.
- Fernandez-Escamilla A-M, Rousseau F, Schymkowitz J, Serrano L. Prediction of sequence-dependent and mutational effects on the aggregation of peptides and proteins. Nat Biotechnol. 2004 2210;22(10):1302–06. doi:10.1038/nbt1012.
- Le Basle Y, Chennell P, Tokhadze N, Astier A, Sautou V. Physicochemical Stability of Monoclonal Antibodies: a Review. J Pharm Sci. 2020;109(1):169–90. doi:10.1016/j.xphs.2019.08.009.
- Meyer RM, Berger L, Nerkamp J, Scheler S, Nehring S, Friess W. Identification of monoclonal antibody variants involved in aggregate formation – part 1: charge variants. Eur J Pharm Biopharm. 2021;158:123–31. doi:10.1016/j.ejpb.2020.10.020.
- Nikita S, Tiwari A, Sonawat D, Kodamana H, Rathore AS. Reinforcement learning based optimization of process chromatography for continuous processing of biopharmaceuticals. Chem Eng Sci. 2021;230:116171. doi:10.1016/j.ces.2020.116171.
- Kumar V, Leweke S, Von Lieres E, Rathore AS. Mechanistic modeling of ion-exchange process chromatography of charge variants of monoclonal antibody products. J Chromatogr A. 2015;1426:140–53. doi:10.1016/j.chroma.2015.11.062.
- Hefzi H, Ang KS, Hanscho M, Bordbar A, Ruckerbauer D, Lakshmanan M, Orellana CA, Baycin-Hizal D, Huang Y, Ley D, et al. A consensus genome-scale reconstruction of chinese hamster ovary cell metabolism. Cell Syst. 2016;3(5):434–443.e8. doi:10.1016/j.cels.2016.10.020.
- Yeo HC, Hong JK, Lakshmanan M, Lee D-Y. Enzyme capacity-based genome scale modelling of CHO cells. Metab Eng. 2020;60:138–47. doi:10.1016/j.ymben.2020.04.005.
- Altamirano C, Illanes A, Casablancas A, Gámez X, Cairó JJ, Gòdia C. Analysis of CHO cells metabolic redistribution in a glutamate-based defined medium in continuous culture. Biotechnol Prog. 2001;17(6):1032–41. doi:10.1021/bp0100981.
- Martínez VS, Buchsteiner M, Gray P, Nielsen LK, Quek L-E. Dynamic metabolic flux analysis using B-splines to study the effects of temperature shift on CHO cell metabolism. Metab Eng Commun. 2015;2:46–57. doi:10.1016/j.meteno.2015.06.001.
- Krambeck FJ, Bennun SV, Narang S, Choi S, Yarema KJ, Betenbaugh MJ. A mathematical model to derive N-glycan structures and cellular enzyme activities from mass spectrometric data. Glycobiology. 2009;19(11):1163–75. doi:10.1093/glycob/cwp081.
- Bennun SV, Yarema KJ, Betenbaugh MJ, Krambeck FJ. Integration of the transcriptome and glycome for identification of glycan cell signatures. PLoS Comput Biol . 2013;9(1):e1002813.
- Spahn PN, Hansen AH, Hansen HG, Arnsdorf J, Kildegaard HF, Lewis NE. A Markov chain model for N-linked protein glycosylation - towards a low-parameter tool for model-driven glycoengineering. Metab Eng. 2016;33:52–66. doi:10.1016/j.ymben.2015.10.007.
- Hutter S, Villiger TK, Brühlmann D, Stettler M, Broly H, Soos M, Gunawan R. Glycosylation flux analysis reveals dynamic changes of intracellular glycosylation flux distribution in Chinese hamster ovary fed-batch cultures. Metab Eng. 2017;43:9–20. doi:10.1016/j.ymben.2017.07.005.