
 ?Mathematical formulae have been encoded as MathML and are displayed in this HTML version using MathJax in order to improve their display. Uncheck the box to turn MathJax off. This feature requires Javascript. Click on a formula to zoom.
ABSTRACT
Advances in antibody engineering have enabled the construction of novel molecular formats in diverse shapes and sizes, providing new opportunities for biologic therapies and expanding the need to understand how various structural aspects affect their distribution properties. To assess the effect of antibody size on systemic pharmacokinetics (PK) and tissue distribution with or without neonatal Fc receptor (FcRn) binding, we evaluated a series of non-mouse-binding anti-glycoprotein D monoclonal antibody formats, including IgG [~150 kDa], one-armed IgG [~100 kDa], IgG-HAHQ (attenuated FcRn binding) [~150 kDa], F(ab’)2 [~100 kDa], and F(ab) [~50 kDa]. Tissue-specific concentration–time profiles were corrected for blood content based on vascular volumes and normalized based on interstitial volumes to allow estimation of interstitial concentrations and interstitial:serum concentration ratios. Blood correction demonstrated that the contribution of circulating antibody on total uptake was greatest at early time points and for highly vascularized tissues. Tissue interstitial PK largely mirrored serum exposure profiles. Similar interstitial:serum ratios were obtained for the two FcRn-binding molecules, IgG and one-armed IgG, which reached pseudo-steady-state kinetics in most tissues. For non-FcRn-binding molecules, interstitial:serum ratios changed over time, suggesting that these molecules did not reach steady-state kinetics during the study. Furthermore, concentration–time profiles of both intact and catabolized molecule were measured by a dual tracer approach, enabling quantification of tissue catabolism and demonstrating that catabolism levels were highest for IgG-HAHQ. Overall, these data sets provide insight into factors affecting preclinical distribution and may be useful in estimating interstitial concentrations and/or catabolism in human tissues.
Introduction
The toolbox of molecular entities available for biologic drug development has greatly expanded beyond standard immunoglobulin G (IgG) formats in the past decade due to advances in protein engineering.Citation1 The efficacy and safety profiles of a therapeutic antibody are often intimately related to selective localization within target tissue(s). Factors affecting monoclonal antibody pharmacokinetics (PK)Citation2–4 have been extensively studied with additional focus on their distributionCitation5 and eliminationCitation6 properties. Among these, neonatal Fc receptor (FcRn) bindingCitation7 and molecular sizeCitation8 have been shown to significantly affect the overall systemic PK of antibodies. Faster clearing formats are often pursued in instances when systemic tolerability is a concern or when pulsatile target engagement is sufficient for achieving efficacy (e.g., immune agonists).Citation9
Beyond immunotherapeutic applications, antibodies can also be used as diagnostic imaging agents in single photon (immuno SPECT) or positron (immuno PET) emission tomography. Achieving ideal PK for diagnosis often requires a rapid ‘washout’ from circulation to enable high signal:background ratios on a same-day timespan. Pursuit of such tracers has prompted the study of a variety of molecular sizes,Citation10 including F(ab’)2 (~100 kDa),Citation11,Citation12 minibodies (~80 kDa),Citation13 diabodies (~55 kDa),Citation14 F(ab)s (~50 kDa),Citation12,Citation15,Citation16 nanobodies (~15 kDa),Citation17 and affibodies (~6 kDa).Citation18 High renal signal is evident when imaging with antibody fragments, particularly when using residualizing (radiometal-chelate) labels,Citation19 due to retention within renal proximal tubules following reabsorption and lysosomal degradation.Citation20 In general, systemic exposure of antibody fragments increases and renal signal decreases with increasing molecular weight.
It is common to express tissue uptake of antibodies in terms of a lump sum measure of uptake in residual serum/plasma, interstitial fluid, and cells. However, emphasis should often be placed on expressing antibody tissue concentrations in terms of interstitial concentrations, as most tissue-resident cell surface receptors are exposed to concentrations within the interstitium, an extracellular fluid compartment between cells wherein drug concentrations are distinct from plasma concentrations.Citation21–23 Accordingly, we have developed methods for measuring vascular and interstitial volumes in tissues to allow for blood correction and expression of data in terms of interstitial concentrations.Citation24–27 More recent efforts have addressed nonspecific antibody distribution in terms of tissue-specific intrinsic clearancesCitation28 or through physiologically based pharmacokinetic (PBPK) models that simulate tissue-specific antibody PK in the interstitial space.Citation29
PBPK models describe distribution of full-length IgG, as well as antibody fragments (e.g., F(ab’)2, F(ab)), to tissues based on organ volumes, blood flow rates, vascular permeabilities and other parameters, often to allow prediction of human distribution based on rodent data.Citation30–33 Covell and coworkers described the PK, distribution, catabolism, and excretion of an IgG1 and its F(ab’)2 and F(ab) fragments following intravenous (IV) administration in mice by such a model and demonstrated higher interstitial:plasma (I:P) concentration ratios for F(ab) than for IgG.Citation30 More recent efforts have been made toward developing PBPK models that can predict the PK and disposition of molecules of various sizes beyond IgG and F(ab)s, including scFv-Fc, minibody, scFv2, diabody, scFv and nanobody.Citation34–36
Studies using molecules with point mutationsCitation37 or FcRn knockout miceCitation38 have shown differential tissue:blood exposures across tissues, suggesting that FcRn plays a role in antibody distribution. Considerable efforts have been made toward characterizing the relationship between molecular size and distribution/PK properties.Citation34–36,Citation39–41 However, many of these efforts have relied on pooling various data sets from historical studies involving antibodies against different targets. There have been few studies that systematically evaluated, in a single comprehensive experiment, the roles of both FcRn binding and molecular size on antibody tissue partitioning. Therefore, we generated antibody variants that differed by size/and or FcRn-binding status and evaluated the PK profiles following a single IV administration in mice. All molecules contain an anti-glycoprotein D (gD) binding paratope, where gD is a structural component of the herpes simplex virus envelope and absent in mice. We selected this target to avoid any confounding effect of target binding to our study interpretation.
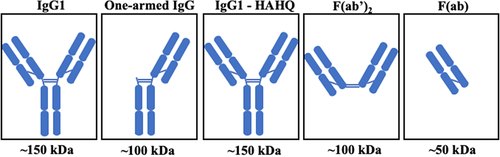
Herein, we take a systematic approach in which the same non-binding complementary-determining region is present on all five molecules whose PK and distribution properties were measured in a single mouse study. The five antibody variants are depicted in . To independently evaluate the role of molecule size on PK and distribution, we analyzed full-length IgG (~150 kDa) and a one-armed IgG (~100 kDa),Citation42 both of which have intact Fc regions, along with three molecules that are deficient in FcRn binding: F(ab) (~50 kDa), F(ab’)2 (~100 kDa), both of which lack the Fc region, and a full-length IgG with two point mutations, H310A and H435Q, in the Fc region that ablate FcRn binding, IgG1-HAHQ (~150 kDa).Citation43,Citation44 To evaluate the role of FcRn binding on PK and distribution, including the added complexities associated with lysosomal catabolism versus endosomal recycling, we compared the profiles of IgG1 and IgG1-HAHQ (both ~150 kDa; differing in FcRn binding). Furthermore, comparisons across differently sized molecules can be made between IgG and one-armed IgG (~150 versus 100 kDa; both FcRn binders), as well as among IgG-HAHQ, F(ab)’2 and F(ab) (~150 versus 100 versus 50 kDa; all non-FcRn binding). Importantly, comparisons across molecules of varying sizes should be restricted to molecules that do, or do not, bind FcRn. As the systemic half-lives of antibody fragments are typically lower than those of their full-length counterparts, we varied the in-life study duration and sampling time points in order to best capture both distribution and elimination profiles of each of these molecules. Importantly, by normalizing interstitial tissue concentrations to systemic concentration, one can derive I:S or I:P ratios from preclinical data. These ratios allow for prediction of estimated drug exposure in human tissues based on clinical serum or plasma PK data alone.
Figure 1. Schematic of molecules. IgG1-HAHQ has mutations H310A and H435Q in the Fc region that ablate FcRn binding. F(ab’)2 and F(ab) have no Fc region.
Results
Construction, expression and purification
All five constructs, IgG, one-armed IgG, IgG-HAHQ, F(ab’)2 and F(ab), were successfully expressed with acceptable yields after two column purifications. All formats were monomeric with less than 5% aggregation. Size-exclusion chromatography with UV chromatograms for purity is shown in Supplemental Figure S1.
Radiochemistry
Antibodies were labeled with 111In labeled 1,4,7,10-tetraazacyclododecane-1,4,7,10-tetraacetic acid (DOTA) through lysines and 125I through tyrosines in separate reactions and combined with unlabeled molecules to create final dosing material (5 mg/kg). Specific activities before dilution with unlabeled material were 6.2–10.3 μCi/μg for 111In-labeling and 10.6–12.7 μCi/μg for 125I-labeling. Size-exclusion radio-chromatograms for all 111In-DOTA-labeled and 125I-labeled molecules (Supplemental Figure S2) demonstrate that virtually all radiometal/radioiodine was incorporated into the immunoconjugate.
PK and distribution
Blood and tissue time–activity curves are shown in terms of both 125I () and 111In () signals, which give readouts of intact and total (intact plus catabolized), respectively. Uncorrected tissue exposures largely mirror blood and serum profiles. These data allow assessment of the effect of molecular size in the absence of FcRn binding using non-FcRn-binding antibody variants IgG1-HAHQ (~150 kDa), F(ab’)2 (~100 kDa) and F(ab) (~50 kDa), as well as by comparing the two FcRn-binding molecules, IgG (~150 kDa) and one-armed IgG (~100 kDa). Serum and blood exposure of non-FcRn-binding molecules, particularly F(ab), appears to be higher for 125I-derived data than for 111In-derived data (Supplemental Figure S4). This result, however, is an artifact due to the rapid renal filtration, lysosomal degradation, and partial recirculation of non-residualized 125I-containing catabolites but not 111In-containing catabolites (see Discussion).
Figure 2. continued.
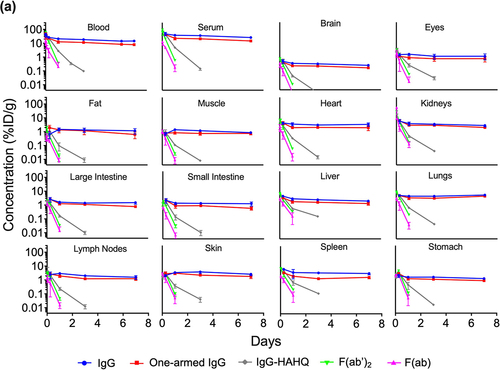
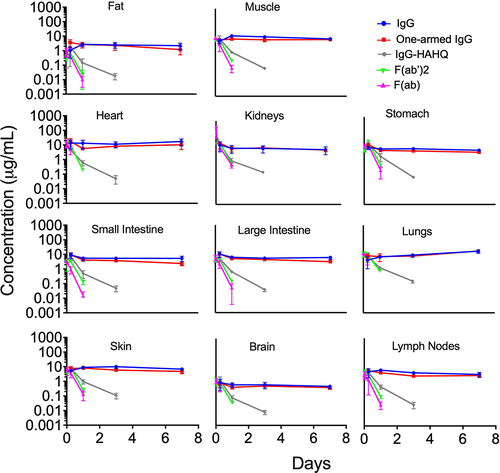
Figure 2. Blood, serum, and uncorrected tissue concentration–time profiles of antibody variants detected by radioactivity in terms of (a) 125I (intact only) or (b) 111In (intact plus catabolized) after a single IV injection (5 mg/kg) in C57Bl/6 mice. Concentrations are reported in %ID/mL or %ID/g.
Total tissue PK calculated as percent injected dose per gram (%ID/g) (EquationEquation 1(1)
(1) ) was corrected for blood content using known literature values for vascular volume and converted from %ID/g to µg/g units (see EquationEquations 2 and
(2)
(2) Equation3
(3)
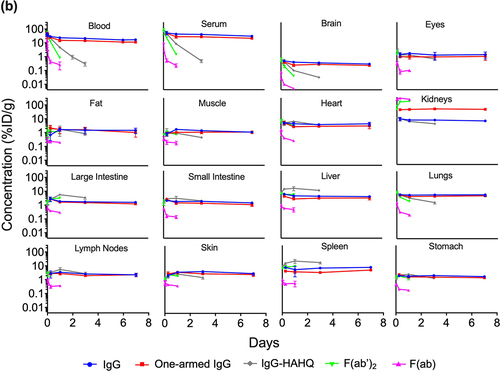
(3) ). To graphically depict residual blood content of each tissue, blood–corrected tissue concentrations were plotted on the same graph as total concentrations with shading to highlight the contribution of circulating antibody to total tissue content (). Blood correction was more impactful for the FcRn-binding molecules, IgG and one-armed IgG, than for the non-FcRn-binding molecules due to higher levels of circulating antibodies. Furthermore, this correction affected blood-rich tissues such as kidneys and liver (60% and 30% reduction from non-corrected uptake, respectively, for IgG at d 1) to a greater extent than blood poor tissues such as muscle, small intestine, and skin (9%, 22% and 3%, respectively).
Figure 3. Blood correction of selected tissue concentration–time profiles of antibody variants detected by radioactivity in terms of 125I (intact only) after a single IV injection (5 mg/kg) in C57Bl/6 mice. Solid circles are uncorrected while hollow circles are blood corrected values. The proportion of antibody in blood and interstitial compartments is depicted in red and green, respectively. Concentrations are reported in %ID/g.
Blood-corrected tissue PK was converted to interstitial PK using known literature values for interstitial volume (see EquationEquation 4)(4)
(4) . The interstitial concentrations over time showed a similar trend as observed in the total tissue PK, but with higher values overall due the interstitial volume correction (). For example, the blood-corrected concentrations were 1.28 and 1.19 µg/g, whereas the interstitial concentrations were 13.9 and 5.44 µg/g in muscle and small intestines, respectively, for IgG at d 1. Importantly, this calculation was not performed for liver and spleen, as we agree with previous assertions by Eigenmann and colleagues that the interstitial and vascular compartments of these organs cannot be distinguished from one another due to highly fenestrated capillaries.Citation29
Figure 4. Tissue interstitial fluid concentration–time profiles of antibody variants detected by radioactivity in terms of 125I (intact only) after a single IV injection (5 mg/kg) in C57Bl/6 mice. Interstitial concentrations were not calculated for tissues with highly fenestrated capillaries (e.g., liver, spleen) or for eyes that are composed mostly of vitreous matter. Concentrations are reported in µg/mL.
Interstitial concentrations from 125I-derived tissue data were normalized by serum concentrations to obtain interstitial fluid:serum (I:S) ratios (see EquationEquation 5)(5)
(5) . Normalization was performed using 125I-derived serum concentrations when calculating I:S ratio for all molecules except for F(ab), for which we chose to normalize by 111In-derived serum concentrations to avoid possible contamination from circulating catabolites as discussed above. The I:S ratios were plotted over time, demonstrating pseudo-steady-state equilibrium for molecules that bind FcRn () but not for the ones that do not bind FcRn (), at least for the time points collected. For muscle, fat and skin, there was an increase in I:S ratio from 6 to 24 h followed by a plateau, suggesting that steady state was achieved by 1 d (). In contrast, for intestines and brain, it appears that steady state may have been achieved even earlier than 6 h. In general, there was an inverse trend of increased I:S ratio with decreasing molecular size across most tissues. However, it is important to reiterate that these molecules vary greatly in their exposures, and some of them do not achieve steady-state equilibrium. I:S ratios, expressed as percentages, are presented in for the FcRn-binding molecules showing higher I:S ratios for one-armed IgG [~100 kDa] compared to IgG [~150 kDa]. The I:S ratios for the fast-clearing non-FcRn-binding molecules are not included in because they do not reach pseudo-steady-state equilibrium and therefore the values are of questionable utility for clinical translation. For IgG, I:S ratios at pseudo-steady-state equilibrium (1–7 d) for most tissues ranged from ~15-35% of serum concentrations except for fat (7–8%) and heart and lungs, which rose to higher levels at 7 d. Interpretation of lung data at 7 d for IgG and one-armed IgG (, 4 and 5a) should be exercised with caution. We noted that harvested lung weights for these molecules at 7 d were statistically higher than at all other time points (data not shown), suggesting a higher content of pooled and/or clotted residual blood due to technical inconsistencies. As such, 7-d data have been excluded from the I:S ranges reported for lung in .
Figure 5. continued.
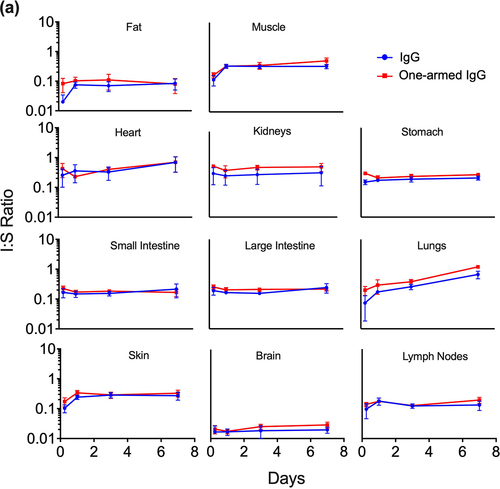
Figure 5. Tissue interstitial:serum concentration ratios over time for FcRn-binding (a) and FcRn-non-binding (b) antibody variants after a single IV injection (5 mg/kg) in C57Bl/6 mice. Interstitial concentrations detected by radioactivity in terms of 125I (intact only) were normalized to serum concentrations (125I) for all molecules except for F(ab), for which 111In serum concentrations were used for normalization due to contamination of 125I serum signal by catabolites escaping the kidneys.
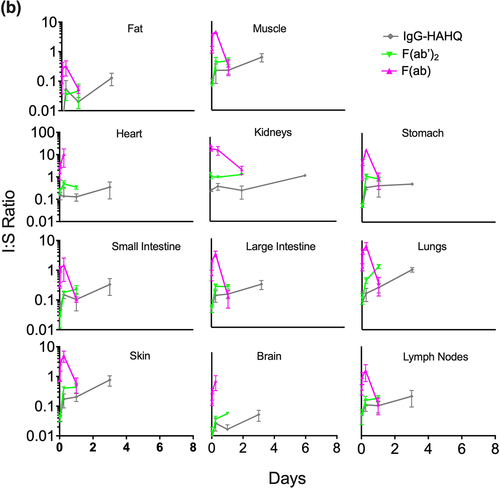
Table 1. Concentration of antibody variant in the interstitial fluid space divided by the respective serum concentration. Interstitial fluid:serum (I:S) ratios are reported as a range between d 1 and 7. Interstitial concentrations detected by radioactivity in terms of 125I (intact only) were normalized to serum concentrations (125I) for all molecules except for F(ab), for which 111In serum concentrations were used for normalization due to contamination of 125I serum signal by catabolites escaping the kidneys.
While the effects of FcRn binding on degradation have been studied previously,Citation37 our new data were collected alongside size variants in the same study for direct quantitative comparison at selected overlapping time points. Here, the molecules were radiolabeled with both iodine-125 (non-residualizing) and indium-111 (residualizing) radionuclides to obtain information regarding both distribution and metabolism, respectively.Citation19,Citation24 Catabolism (degradation) of the antibody variants was measured by subtracting 125I signal from the 111In signal (see EquationEquation 6)(6)
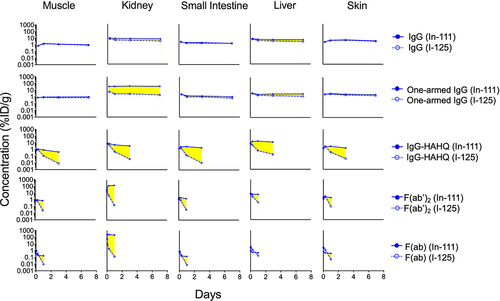
(6) and was plotted for selected tissues in . Catabolism for one-armed IgG was similar to that of IgG in all tissues except for kidney where higher catabolism was observed, in agreement with our previous observations.Citation45 IgG1-HAHQ demonstrated much higher catabolism in all tissues compared to IgG1, consistent with the known impact of impaired FcRn binding on antibody distribution.Citation37 F(ab) and F(ab’)2 also showed significant catabolism due to lack of FcRn binding. Calculation of tissue catabolism (111In – 125I) for non-FcRn-binding molecules, particularly F(ab), resulted in negative values at early time points; however, this is an artifact caused by rapid renal filtration, lysosomal degradation, and partial recirculation of non-residualized 125I-containing catabolites but not 111In-containing catabolites (see Discussion).
Figure 6. Effect of molecule size on tissue catabolism of antibody variants. Tissue catabolism may be approximated as the difference (highlighted in yellow) between 111In (intact plus catabolized) and 125I (intact only) after a single IV injection (5 mg/kg) in C57Bl/6 mice. Concentrations are reported in %ID/g. Data for intact (125I) F(ab) (bottom row, hollow symbols) should be interpreted with caution as tissue levels are contaminated by 125I-labeled catabolites escaping the kidneys.
Compartmental modeling
Supplemental Figure S5 shows the final per-animal fits (V1 estimated on a per-animal basis) of the model (EquationEquations 7(7)
(7) –Equation10
(10)
(10) ) to blood and plasma PK data for the 5 antibodies considered in this study, and shows the corresponding population mean fits to the same data. lists the fitted PK parameter values for each antibody, where CL, CLd, and V2 vary across molecules and V1 and Hct have the same population mean value for all molecules and animals (
;
). Inter-animal variability in V1 was estimated to be approximately 29% (Supplemental Figures S5 and S6). The area under the curve of molecule concentration in blood
increases from approximately 21% ID/g
h for F(ab) to approximately 3530 %ID/g
h for IgG. The F(ab’)2 fragment, IgG-HAHQ and one-armed IgG have AUC’s of approximately 227, 513 and 2609 %ID/g
h (). Cmax values are not reported due to variation in the first time-point of blood collection across molecules.
Figure 7. Population mean compartmental model fits to all available blood (red curves and circles) and plasma (blue curves and circles) PK data. Supplemental Table 1 shows final fitted population mean parameter values and AUC0-168h values for each molecule.
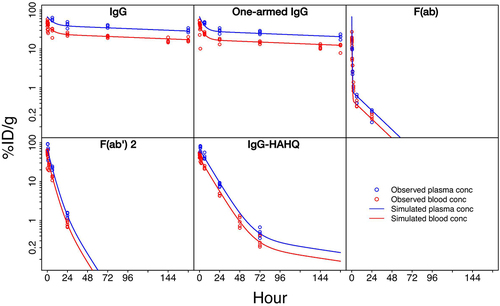
Table 2. Fitted model parameters and AUCs for In-111 derived blood PK. Central distribution volume (V1) and hematocrit were fitted to the same population mean value across all animals and molecules. Elimination clearance (CL), distribution clearance (CLd) and peripheral distribution volume (V2) were allowed to vary between molecules but were fitted to the same population mean value for all animals within each molecule test group. Inter-animal variability was estimated for V1. Area under the curve of antibody blood concentration was calculated based on the fitted model, from t = 0 to t = 7 d.
Discussion
Our preclinical data allow us to examine distribution trends across size in two separate conditions: with and without FcRn recycling. The I:S ratio is an important metric that allows for normalization of tissue distribution data for molecules that vary widely in their systemic exposures and for the estimation of drug exposure in human tissues based on clinical serum PK data alone. In the absence of FcRn binding, we observed an inverse trend in which I:S ratios increased with decreasing size (), but with the caveat that these are non-steady-state values for molecules that differ greatly in their serum exposures (IgG-HAHQ > F(ab)’2 > F(ab)). Similarly, I:S ratios for one-armed IgG were generally higher than for IgG (, ), but caution should be exercised in interpreting our results given that only two FcRn-binding variants were evaluated.
Molecule size, target antigen affinity and FcRn binding are some of the key factors determined to affect molecule disposition into and within tissues.Citation5 There have been several reports studying or modeling either the role of molecule sizeCitation8,Citation39–41 or FcRn-binding statusCitation37,Citation38 on the tissue distribution of exogenously administered antibodies. For instance, Schmidt and Wittrup developed a mechanistic model relating molecular size and affinity to tumor uptake and reported a U-shaped trend in which intermediate-sized targeting agents (~25 kDa) have the lowest uptake, with better uptake achieved by larger and smaller agents, assuming sufficiently tight binding affinities for the latter.Citation8 Another report studying the effect of both size and FcRn binding on antibody PK largely utilized extracted data from the literature to generate a unified model,Citation40 but differences in experimental conditions and methodologies often confound such pooled analysis studies. Importantly, there are no reports, to our knowledge, that simultaneously evaluate the combined effects of both molecule size and FcRn binding in a single experimental study.
In this study, we examined the distribution of five distinct molecules that varied in size and/or FcRn binding (). All molecules were generated using similar methodologies, and a unified measure of serum PK and tissue distribution was applied across all formats in a single radiometric study. We applied a systematic approach in which total tissue uptake was first measured () followed by a series of calculations, including blood correction (), interstitial correction (), and normalization to serum concentration (). We also calculated catabolism within tissues, taking advantage of the 125I and 111In dual labeling approach (). Finally, the exposure data was fitted to a linear compartmental PK model ().
The primary systemic clearance of antibody fragments, including F(ab) and F(ab’)2 is through renal filtration. In contrast, full-length IgG is cleared primarily by widespread fluid-phase pinocytosis into endothelial cells, leading to lysosomal degradation or FcRn recycling.Citation2,Citation5 Like IgG, Fc-containing immunoglobulins and albumin have long circulating half-lives due to their ability to bind FcRn, which prevents their lysosomal degradation through a pH-dependent recycling mechanism.Citation7
The higher exposure of 125I-labeled, compared to 111In-labeled, non-FcRn-binding molecules, particularly F(ab), is presumed to be attributed to the rapid degradation of F(ab) in kidneys and to the non-residualizing nature of [125I]iodotyrosine and/or associated metabolites ( and Supplemental Figure S4), as reported elsewhere.Citation46 F(ab)s and other small antibody fragments may display disparity between 125I and 111In signal due to rapid renal filtration, lysosomal degradation, and partial recirculation of non-residualized 125I-containing catabolites but not 111In-containing catabolites. F(ab) is expected to undergo glomerular filtration in kidneys due to small molecular size, followed by eventual reabsorption of non-protein-associated 125I (in the form of iodotyrosine and/or other catabolites) post protein degradation of F(ab) in renal proximal tubules. However, there is potential for release and partial recirculation of non-protein-associated 125I upon renal filtration and degradation of a radioiodinated F(ab). In contrast, the 111In-containing catabolites of a radiometal-labeled F(ab) will remain sequestered within lysosomes of renal proximal tubules, rendering them unable to produce artifactually high systemic levels of radioactivity. In previous work, we characterized this phenomenon for another F(ab) using trichloroacetic acid precipitation to confirm the presence of non-F(ab)-associated radioiodine, especially at earlier time points (between 0.25 and 2 d) that may lead to modest overrepresentation of exposure when not corrected for free 125I as specified using serum PK data.Citation46 Similar behavior is evident in our current data, particular for F(ab), in that the 125I exposure data in serum/blood is higher than the respective 111In data (Supplemental Figure S4). However, trichloroacetic acid correction was not performed in this study due to the experimental complexity of the dual isotope (111In plus 125I) approach. Instead, we chose to normalize our interstitial concentrations to 125I serum concentrations for all molecules except for F(ab), for which 111In serum concentrations were used for normalization due to contamination of 125I serum signal by catabolites escaping the kidneys ( and ). In addition, this phenomenon gives artifactually negative values for catabolism (). Taken together, these observations suggest that radioiodine derived distribution data of small fragments, such as F(ab), should be used with caution and with appropriate correction for non-protein associated radioactivity.
We chose to correct our lump sum tissue concentrations for residual blood pool (EquationEquation 2(2)
(2) ) using vascular volumes measured by 99mTc-labeled red blood cells (). Others have argued that this results in over-correction of data and opted for using albumin distribution at early time points,Citation29 but we maintain that use of albumin distribution as a blood pool marker, even at early time points, is worrisome due to the very rapid distribution of this serum protein from vascular to extracellular/interstitial compartments, particularly in the distribution phase. Overall, we believe that use of red blood cell derived vascular volume data for blood correction is appropriate as long as consistent tissue distribution methodology is applied to both red blood cell labeling and antibody distribution experiments.
Blood-corrected lump sum tissue concentrations in %ID/g were converted to µg/g (EquationEquation 3(3)
(3) ) and subsequently corrected for interstitial volume (EquationEquation 4
(4)
(4) ) to derive interstitial concentrations (). Importantly, interstitial volume correction was not performed for liver and spleen, as we agree with previous assertions that the interstitial and vascular compartments of these organs cannot be distinguished from one another due to highly fenestrated capillaries.Citation29 However, Eigenmann and colleagues also chose not to calculate interstitial concentrations for brain and kidney as they argued that antibodies are restricted to the vascular spaces in these organs. While we agree that the blood–brain and glomerular filtration barriers limit the extravasation of antibodies into the interstitial spaces of brain and kidney, we do not agree that it is completely restricted, particularly for some of the smaller antibody formats tested in this study. Therefore, we do report interstitial concentrations for brain and kidney, but not for liver and spleen.
Consistent with prior work,Citation45 we observed that a one-armed IgG (113 kDa), a monovalent format pursued for cancer therapy to avoid crosslinking liabilities of bivalent antibodiesCitation42 and more recently for diagnostic purposes,Citation47–49 was more susceptible to glomerular filtration, tubular reabsorption, and subsequent catabolism in vivo relative to conventional (bivalent) IgG (). This phenomenon could be explained by considering antibodies not as singular spherical proteins but rather as smaller proteins (F(ab)s and Fcs), molecules known to cross the glomerular barrier individually, tethered together, such that branched antibodies exhibit less renal filtration than non-branched molecules.Citation45 Although the molecular weight cutoff for glomerular filtration is often approximated to be consistent with albumin (~67 kDa), the robust renal filtration of F(ab’)2 (100 kDa) and even carbon nanotubes that are 10–20 times the alleged cutoffCitation50 suggest that shape may play a more prominent role than size.
Factors such as glycosylation and charge are important in antibody structure and function. We acknowledge the caveat that our one-armed IgG was produced in E.coli while full-length IgG was produced in Chinese hamster ovary (CHO) cells. Consequently, the one-armed IgG is not glycosylated, a modification necessary for Fc-gamma receptor (FcγR) binding, while the full-length IgG is glycosylated and able to bind FcγR. However, a study comparing the PK of antibodies with and without glycosylation demonstrated that altered FcγR binding affinity does not affect PK.Citation51 Furthermore, the theoretical pIs for all five molecules are as follows (from highest to lowest at physiological pH): F(ab’)2 (8.59), IgG-HAHQ (8.55), F(ab) (8.34), IgG (8.16), one-armed IgG (8.06). While we did not measure pI values experimentally, it is unlikely that differences in electrostatic charge among these molecules is driving the differences in disposition given that the range of theoretical pI values spans less than a single pI unit.Citation52
Interstitial concentrations were normalized by serum concentrations (EquationEquation 5(5)
(5) ) to derive interstitial to serum (I:S) ratios ( and ). Covell et al. previously reported model-simulated steady-state interstitial to plasma (I:P) ratios of 0.54, 0.66, and 0.68 for IgG in gut, kidney, and lung, respectively.Citation30 However, the data from which these values were derived was obtained for only a limited duration of 24 h.Citation53 Our experimentally measured I:S values trended lower at 0.15–0.24, 0.28–0.36, and 0.17–0.26, respectively ( and ). Covell et al. also reported steady-state I:P ratios for F(ab’)2 and F(ab), but we do not feel that comparison is appropriate as our values changed over time, suggesting that steady-state equilibrium was never reached. Rather than reporting calculated I:P or I:S values based on interstitial correction, Eigenmann et al. chose to directly assay interstitial fluid concentrations by centrifugation of tissue samples on a mesh in a humidity chamber and found I:P ratios of ~0.5–0.6 in both skin and muscle for an anti-IL17 IgG.Citation29 Our I:S ranges of 0.34–0.35 and 0.24–0.29 for muscle and skin, respectively, were significantly lower than the I:P values obtained by centrifugation.
Shah and colleagues have reported a simpler, non-physiological approach in which total, uncorrected tissue concentrations are divided by plasma concentrations to yield “antibody biodistribution coefficients”. Specifically, they demonstrated a linear relationship between the plasma and tissue concentrations of non-binding antibodies irrespective of concentration, time, and animal species based on analysis of distribution data collected from diverse literature. The resulting total (lump sum) tissue concentrations expressed as percentages of plasma concentrations were as follows: lung 14.9%, heart 10.2%, kidney 13.7%, muscle 3.97%, skin 15.7%, small intestine 5.22%, large intestine 5.03%, spleen 12.8%, liver 12.1%, stomach 4.98%, lymph node 8.46%, adipose 4.78%, brain 0.351%.Citation54 These values agree quite well with our corresponding lump sum tissue:plasma ratios (Supplemental Table S1): lung 12–14%, heart 9–14%, kidney 10–11%, muscle 3–4%, skin 9–11%, small intestine 4–6%, large intestine 4–6%, spleen 10–13%, liver 8–9%, stomach 4–5%, lymph nodes 6–8%, fat 4–5% and brain 0.9%. This ‘biodistribution coefficient’ approach was explored in the context of various sized antibody fragmentsCitation40 and was recently extended to tissue interstitial concentrations.Citation55 Li and colleagues used two orthogonal approaches, non-compartmental analysis and 2-compartment modeling, to establish the relationship between the molecular size and systemic clearance of antibody fragmentsCitation39 and more recently used a two-pore PBPK model to predict (a priori) the systemic PK of various sized antibody constructs.Citation41
Using antibodies labeled with radioactive metals through lysine-conjugated chelates, the in vivo fate of antibodies can be tracked due to the residualizing properties of the resulting metabolites. By pairing this approach with a non-residualizing iodine probe, we are able to determine the level of catabolism in tissues (EquationEquation 6(6)
(6) and ). Several investigations including analyses of urine samples from clinical trials demonstrate that [111In]DOTA-ε-amino-lysine is the major radioactive catabolite of 111In-DOTA-modified antibodiesCitation56,Citation57 and, when injected intravenously into mice, this catabolite rapidly cleared into the urine without kidney retention.Citation57 Using in vitro studies, Shih and colleagues concluded that the prolonged retention of 111In relative to 125I is due to intracellular retention of catabolic products containing 111In, perhaps within lysosomes, not due to deiodination of iodine conjugates.Citation58 These observations, along with the residualizing properties of [111In]DOTA-ε-amino-lysine, strongly favor the intracellular production and trapping of this catabolite within renal proximal tubules as opposed to redistribution of this catabolite from other tissues. Similar contrasts in uptake between 111In and 125I-labeled antibodies in receptor expressing tissues have been demonstrated in numerous in vivo studies.Citation19,Citation59–62 While dehalogenation has been a general concern for radioiodinated proteins in vivo, previous work has suggested little to no differences among an 125I-labeled IgG, F(ab’)2 and F(ab) when labeled by electrophilic addition to tyrosines (similar to the current method) versus labeling through lysines using a dehalogenase-resistant method.Citation63
The linear compartmental PK model (EquationEquations 7(7)
(7) –Equation10
(10)
(10) ) was able to characterize both blood and plasma PK of all five molecules considered here, with qualitatively good fits to both pooled () and per-mouse (Supplemental Figure S5) data. Sparse sampling across a relatively large number of mice (n = 98) allowed estimation of both the population mean and associated inter-animal variability for the central blood distribution volume (V1). The estimated population mean of V1 was 2.5 mL (), which is close to the nominal physiologic blood volume of 2 mL, and inter-animal variability in V1 was 29% ( and Supplemental Figure S6). The fitted mean value of blood hematocrit was 0.40, which is close to the nominal hematocrit value for C57BL-6 mice (). As expected, due to the significant role that FcRn plays in rescuing antibodies from degradation and extending half-life,
values were approximately five to seven times higher for the full-length (150 kDa) and one-armed (100 kDa) FcRn-binding antibodies versus the FcRn non-binding full-length molecule (150 kDa) (). A 50% reduction in molecular weight resulted in an approximately 10 times reduction in
when comparing the F(ab’)2 (100 kDa) and F(ab) (50 kDa) fragments due to kidney filtration as a significant route of elimination for the F(ab) fragment.
In conclusion, our results show that molecule size is a primary determinant of tissue partitioning from blood after systemic administration. Consistent with other studies previously mentioned, we observed an inverse trend of increased I:S ratios with decreasing molecular size, irrespective of tissue vascularity. However, the molecules examined vary greatly in their exposures, and some of them do not exhibit steady-state kinetics (F(ab), F(ab’)2 and IgG-HAHQ). We demonstrate that I:S ratios reach pseudo-steady-state equilibrium for molecules that bind FcRn (IgG and one-armed IgG), but not for the ones that do not bind FcRn (F(ab), F(ab’)2, IgG-HAHQ). The clearest role of FcRn binding was its impact on antibody degradation within tissues, where antibody variants without FcRn binding were catabolized more than FcRn-binding antibodies. Overall, these findings highlight differences in tissue interstitial PK and systemic exposure between differently sized antibody molecules that may have important implications in the efficacy and safety profiles of cancer immunotherapeutic candidates.
Materials and methods
Construction, expression and purification
Antibody constructs were cloned by standard molecular biology techniques into either mammalian expression vectorsCitation64 (full-length IgG, F(ab’)2, IgG-HAHQ) or an E. coli expression vectorCitation65,Citation66 (F(ab), one-armed IgG) as previously described, where IgG, IgG1-HAHQ and F(ab’)2 were expressed in CHO cells.Citation67 Expression in E. coli cell culture was carried out as previously described.Citation66 After expression, the cells were pelleted by gravity. To isolate the antibodies expressed in E. coli, the cell pellet was resuspended, micro-fluidized and the supernatant was clarified prior to loading on a Protein-A (GE Healthcare) column. To isolate the antibodies expressed in CHO cells, the culture supernatants containing the secreted antibodies were collected and directly loaded on to Protein-A columns, while F(ab) and F(ab’)2 containing supernatants were loaded onto Protein-G (GE Healthcare) columns. Each capture pool was then loaded onto an SP HP strong cation exchanger (GE Healthcare) column. Fractions were collected and analyzed for identity using mass spectrometry and for aggregation by size-exclusion chromatography (Supplemental Figure S1) as previously described.Citation68 Briefly, data were acquired using an Agilent 1290 Infinity ultra performance liquid chromatography in tandem with an Agilent 6230 electrospray ionization time-of-flight mass spectrometer, operating in positive ion mode. Unconjugated protein was loaded onto a reverse phase (RP) PLRP-S column (Agilent) with dimension of 4.6 × 50 mm. Mobile phase A consisted of 0.05% trifluoroacetic acid while mobile phase B consisted of 0.05% trifluoroacetic acid and 80% acetonitrile, and was used for the gradient between 20% and 90% mobile phase B. Fractions were pooled to render preparations with the correct molecular weight and aggregation level below <5%. Each pool was then buffer exchanged into phosphate-buffered saline (PBS) pH 7.2 using size-exclusion chromatography. Samples were concentrated ≥1 mg/mL using spin concentrators with a molecular weight cutoff of 10 kDa (Pierce).
Radiochemistry
Radiosynthesis of 111In-labeled proteins was achieved through incubation of 111InCl3 and DOTA-conjugated (randomly through lysines) proteins in 0.3 mol/L ammonium acetate pH 7 at 37°C for 1 h. Radiosynthesis of 125I-labeled proteins was achieved through indirect iodination through tyrosine residues.Citation69 Purification of all radioimmunoconjugates was achieved using NAP-5 columns equilibrated in PBS and confirmed by size-exclusion chromatography (Supplemental Figure S2).
Each molecule was labeled in separate reactions with two radionuclides, iodine-125 (125I) and indium-111 (111In), and the purified tracers were later combined for IV administration. The dual-tracer approach differentiates between intact and internalized/degraded molecules.Citation19,Citation59 When iodinated antibodies are internalized and degraded, the free-radioactive iodide and/or iodotyrosine rapidly diffuses from the cell and is cleared from the systemic circulation.Citation24 Consequently, the 125I signal represents primarily intact antibody. In contrast, the same internalization and lysosomal degradation of 111In-labeled antibodies yields an 111In-DOTA-amino acid adduct that is cell impermeable and accumulates over time. Therefore, subtracting 125I signal from 111In signal can be used to approximate the total internalized/degraded (catabolized) antibody.Citation70
Pharmacokinetic analysis
All animal experiments were conducted in accordance with, and approval of, the American Association for Accreditation of Laboratory Animal Care and the Genentech Institutional Animal Care and Use Committee (IACUC). To prevent thyroid sequestration of 125I, 100 μL of 30 mg/mL of sodium iodide was administered intraperitoneally 1 and 24 hours prior to dosing. Female C57Bl-6 mice (~20 g) were randomly assigned to groups (n = 5) and administered an IV bolus consisting of a mixture of 125I- and 111In-labeled antibody/antibody fragment tracers (5 μCi of each) plus the respective unmodified antibody for a total dose of 5 mg/kg. Blood and tissue samples collected (time points listed in Supplemental Figure S3) were counted for radioactivity using a 1480 WIZARD Gamma Counter in the energy windows for 111In (245 keV; decay t1/2 = 2.8 d) and 125I (35 keV; decay t1/2 = 59.4 d) with automatic background and decay correction. Of note, all animals weighed between 17.5 and 22.1 g with a median range of 20 g. Study duration for antibody fragments were varied to account for differences in systemic half-lives reported previously.Citation30,Citation53 F(ab) and F(ab’)2 (the fastest cleared) were assayed up to d 1, IgG1-HAHQ was assayed up to d 3, and IgG1 was assayed up to d 7. Catabolism can be approximated as the difference between 111In (intact plus residualized) and 125I (intact only) signals.Citation24,Citation59 However, this method does not provide a proper readout of catabolism for all organs, particularly for those with fast cell turnover rates or cellular efflux mechanisms.
The serum concentration–time data from each animal were analyzed by compartmental modeling (see Compartmental modeling section below). Total tissue concentrations in dose-normalized units were calculated according to EquationEquation 1(1)
(1) :
where %ID/g denotes the percentage of the injected dose per gram of tissue, CPMt and CPMID denote the radioactive counts per minute in the harvested tissue and in the total injected dose, respectively, and masst denotes the mass of the harvested tissue in grams. Total tissue concentrations were corrected for blood volume and interstitial volume. Given that we used non-targeting antibodies, the assumption made is that internalization is minimal (limited to pinocytosis), and that the majority of the antibody is located extracellularly in the interstitial and vascular spaces. EquationEquation 2(2)
(2) was used to correct for blood volume based on known literature valuesCitation27:
where %ID denotes the percentage of injected dose (per gram of tissue or mL of blood), Vv denotes vascular volume, and Cb denotes blood concentration.
Then, EquationEquation 3(3)
(3) was used to convert %ID/g units to µg/g units,
In order to get the interstitial concentration (Ci), we applied EquationEquation 4(4)
(4) ,
To obtain the interstitial:serum (I:S) concentration ratio, EquationEquation 5(5)
(5) was used:
Finally, to estimate the catabolized portion of the molecules, EquationEquation 6(6)
(6) was utilized:
Tissue concentrations were corrected for antibody circulating within residual blood volume using Vv values reported for mouse (DBA/2 strain) except for eyes, for which the value for monkey from the same reference was used.Citation27 Blood-corrected tissue concentrations were corrected for fractional interstitial volume using Vi values reported for mouse (DBA/2 strain)Citation27 except for kidney, brain, eyes, liver and spleen. A Vi value of 0.14 was used for kidney; this value was derived by assuming that the interstitium accounts for approximately 8% of the total parenchymal volume in the cortex and up to 40% in the inner medulla,Citation71 and that the medulla and cortex occupy approximately 20 and 80% of renal mass, respectively (i.e. 0.8×0.8 + 0.4x0.2 = 0.14).Citation72 A Vi value of 0.18 was used for brain.Citation73 Interstitial correction was not performed for eyes because these organs are mostly comprised of acellular vitreous humor.Citation46 Interstitial concentrations were not calculated for spleen and liver because the interstitial and vascular spaces within these leaky tissues cannot be distinguished from one another.Citation29
Compartmental modeling
A standard two-compartment linear PK model was fitted simultaneously to all blood and plasma data collected in this study, where model equations are
and simulated blood (b) and plasma (p) concentrations fitted to data are
X1 and X2 represent amount of antibody in the central and peripheral distribution compartments in units of percent total injected dose (%ID) and CL, CLd, V1, V2 and Hct are elimination clearance, distribution clearance, central blood distribution volume, peripheral distribution volume and hematocrit, respectively. Units for clearance and volume parameters are mL/h and mL, respectively. Cb(t) and Cp(t) are blood and plasma antibody concentrations in units of %ID/g, where we assume 1 g = 1 mL. All model equations were implemented using Matlab Simbiology R2018b for EquationEquations 7(7)
(7) –Equation10
(10)
(10) and parameters were estimated using the nonlinear mixed-effects algorithm with an exponential error model. CL, CLd and V2 were fitted to a single population mean value for each antibody considered in this study, while V1 and Hct were fitted to single population mean value across all molecules. Inter-animal variability was estimated for V1. The final fitted model was used to estimate the population mean area under the curve of Cb(t) from
to
d (
) for each molecule.
Abbreviations
Immunoglobulin G (IgG), pharmacokinetics (PK), neonatal Fc receptor (FcRn), single photon emission tomography (SPECT), positron emission tomography (PET), physiologically based pharmacokinetic (PBPK), intravenous (IV), interstitial:plasma (I:P), glycoprotein D (gD), 1,4,7,10-tetraazacyclododecane-1,4,7,10-tetraacetic acid (DOTA), interstitial fluid:serum (I:S), Chinese hamster ovary (CHO)
Supplemental Material
Download Zip (3.3 MB)Disclosure statement
All authors were employees of Genentech, a member of the Roche Group, at the time they contributed to the experiments in this manuscript.
Supplementary material
Supplemental data for this article can be accessed online at https://doi.org/10.1080/19420862.2022.2085535
Additional information
Funding
References
- Brinkmann U, Kontermann RE. The making of bispecific antibodies. mAbs. 2017;9(2):182–15. doi:10.1080/19420862.2016.1268307.
- Ryman JT, Meibohm B. Pharmacokinetics of monoclonal antibodies. CPT: Pharmacometrics & Syst Pharmacol. 2017;6:576–88.
- Wang W, Wang EQ, Balthasar JP. Monoclonal antibody pharmacokinetics and pharmacodynamics. Clin Pharmacol Ther. 2008;84(5):548–58. doi:10.1038/clpt.2008.170.
- Lobo ED, Hansen RJ, Balthasar JP. Antibody pharmacokinetics and pharmacodynamics. J Pharm Sci. 2004;93(11):2645–68. doi:10.1002/jps.20178.
- Tabrizi M, Bornstein GG, Suria H. Biodistribution mechanisms of therapeutic monoclonal antibodies in health and disease. AAPS J. 2010;12(1):33–43. doi:10.1208/s12248-009-9157-5.
- Tabrizi MA, Tseng CM, Roskos LK. Elimination mechanisms of therapeutic monoclonal antibodies. Drug Discov Today. 2006;11(1–2):81–88. doi:10.1016/S1359-6446(05)03638-X.
- Roopenian DC, Akilesh S. FcRn: the neonatal Fc receptor comes of age. Nat Rev Immunol. 2007;7(9):715–25. doi:10.1038/nri2155.
- Schmidt MM, Wittrup KD. A modeling analysis of the effects of molecular size and binding affinity on tumor targeting. Mol Cancer Ther. 2009;8(10):2861–71. doi:10.1158/1535-7163.MCT-09-0195.
- Betts A, van der Graaf PH. Mechanistic quantitative pharmacology strategies for the early clinical development of bispecific antibodies in oncology. Clin Pharmacol Ther. 2020;108(3):528–41. doi:10.1002/cpt.1961.
- Fu R, Carroll L, Yahioglu G, Aboagye EO, Miller PW. Antibody fragment and affibody immunoPET imaging agents: radiolabelling strategies and applications. ChemMedChem. 2018;13(23):2466–78. doi:10.1002/cmdc.201800624.
- Sham JG, Kievit FM, Grierson JR, Chiarelli PA, Miyaoka RS, Zhang M, Yeung RS, Minoshima S, Park JO. Glypican-3–Targeting F(ab′)2 for 89 Zr PET of hepatocellular carcinoma. J Nucl Med. 2014;55(12):2032–37. doi:10.2967/jnumed.114.145102.
- Heskamp S, van Laarhoven HW, Molkenboer-Kuenen JD, Bouwman WH, van der Graaf WT, Oyen WJ, Boerman OC. Optimization of IGF-1R SPECT/CT imaging using 111 in-labeled F(ab′) 2 and fab fragments of the monoclonal antibody R1507. Mol Pharm. 2012;9(8):2314–21. doi:10.1021/mp300232n.
- Olafsen T, Kenanova VE, Sundaresan G, Anderson AL, Crow D, Yazaki PJ, Li L, Press MF, Gambhir SS, Williams LE, et al. Optimizing radiolabeled engineered Anti-p185 HER2 antibody fragments for in vivo imaging. Cancer Res. 2005;65(13):5907–16. doi:10.1158/0008-5472.CAN-04-4472.
- Olafsen T, Sirk SJ, Olma S, Shen CK, Wu AM. ImmunoPET using engineered antibody fragments: fluorine-18 labeled diabodies for same-day imaging. Tumour biol:J Int Soc Oncodevelopmental Biol Med. 2012;33(3):669–77. doi:10.1007/s13277-012-0365-8.
- Chakravarty R, Goel S, Valdovinos HF, Hernandez R, Hong H, Nickles RJ, Cai W. Matching the decay Half-Life with the biological Half-Life: immunoPET imaging with 44 Sc-Labeled cetuximab fab fragment. Bioconjug Chem. 2014;25(12):2197–204. doi:10.1021/bc500415x.
- Holloway CM, Scollard DA, Caldwell CB, Ehrlich L, Kahn HJ, Reilly RM. Phase I trial of intraoperative detection of tumor margins in patients with HER2-positive carcinoma of the breast following administration of 111In-DTPA-trastuzumab fab fragments. Nucl Med Biol. 2013;40(5):630–37. doi:10.1016/j.nucmedbio.2013.03.005.
- Xavier C, Vaneycken I, D’Huyvetter M, Heemskerk J, Keyaerts M, Vincke C, Devoogdt N, Muyldermans S, Lahoutte T, Caveliers V, et al. Synthesis, preclinical validation, dosimetry, and toxicity of 68 Ga-NOTA-Anti-HER2 nanobodies for iPET imaging of HER2 receptor expression in cancer. J Nucl Med. 2013;54(5):776–84. doi:10.2967/jnumed.112.111021.
- Sandstrom M, Lindskog K, Velikyan I, Wennborg A, Feldwisch J, Sandberg D, Tolmachev V, Orlova A, Sörensen J, Carlsson J, et al. Biodistribution and radiation dosimetry of the Anti-HER2 affibody molecule 68 Ga-ABY-025 in breast cancer patients. J Nucl Med. 2016;57(6):867–71. doi:10.2967/jnumed.115.169342.
- Boswell CA, Marik J, Elowson MJ, Reyes NA, Ulufatu S, Bumbaca D, Yip V, Mundo EE, Majidy N, Van Hoy M, et al. Enhanced tumor retention of a radiohalogen label for site-specific modification of antibodies. J Med Chem. 2013;56(23):9418–26. doi:10.1021/jm401365h.
- Vegt E, de Jong M, Wetzels JF, Masereeuw R, Melis M, Oyen WJ, Gotthardt M, Boerman OC. Renal toxicity of radiolabeled peptides and antibody fragments: mechanisms, impact on radionuclide therapy, and strategies for prevention. J Nucl Med. 2010;51(7):1049–58. doi:10.2967/jnumed.110.075101.
- Levitt DG. The pharmacokinetics of the interstitial space in humans. BMC Clin Pharmacol. 2003;3(1):3. doi:10.1186/1472-6904-3-3.
- Wiig H, Tenstad O, Iversen PO, Kalluri R, Bjerkvig R. Interstitial fluid: the overlooked component of the tumor microenvironment? Fibrogenesis Tissue Repair. 2010;3(1):12. doi:10.1186/1755-1536-3-12.
- Benias PC, Wells RG, Sackey-Aboagye B, Klavan H, Reidy J, Buonocore D, Miranda M, Kornacki S, Wayne M, Carr-Locke DL, et al. Structure and distribution of an unrecognized interstitium in human tissues. Sci Rep. 2018;8(1):4947. doi:10.1038/s41598-018-23062-6.
- Boswell CA, Bumbaca D, Fielder PJ, Khawli LA. Compartmental tissue distribution of antibody therapeutics: experimental approaches and interpretations. AAPS J. 2012;14(3):612–18. doi:10.1208/s12248-012-9374-1.
- Boswell CA, Ferl GZ, Mundo EE, Bumbaca D, Schweiger MG, Theil FP, Fielder PJ, Khawli LA. Effects of anti-VEGF on predicted antibody biodistribution: roles of vascular volume, interstitial volume, and blood flow. PloS one. 2011;6(3):e17874. doi:10.1371/journal.pone.0017874.
- Boswell CA, Ferl GZ, Mundo EE, Schweiger MG, Marik J, Reich MP, Theil, FP, Fielder, PJ, Khawli, LA . Development and evaluation of a novel method for preclinical measurement of tissue vascular volume. Mol Pharm. 2010;7(5):1848–57. doi:10.1021/mp100183k.
- Mandikian D, Figueroa I, Oldendorp A, Rafidi H, Ulufatu S, Schweiger MG, Couch JA, Dybdal N, Joseph SB, Prabhu S, et al. Tissue physiology of cynomolgus monkeys: cross-Species comparison and implications for translational pharmacology. AAPS J. 2018;20(6):107. doi:10.1208/s12248-018-0264-z.
- Eigenmann MJ, Fronton L, Grimm HP, Otteneder MB, Krippendorff BF. Quantification of IgG monoclonal antibody clearance in tissues. mAbs. 2017;9(6):1007–15. doi:10.1080/19420862.2017.1337619.
- Eigenmann MJ, Karlsen TV, Krippendorff BF, Tenstad O, Fronton L, Otteneder MB, Wiig H. Interstitial IgG antibody pharmacokinetics assessed by combined in vivo - and physiologically-based pharmacokinetic modelling approaches. J Physiol. 2017;595(24):7311–30. doi:10.1113/JP274819.
- Covell DG, Barbet J, Holton OD, Black CD, Parker RJ, Weinstein JN. Pharmacokinetics of monoclonal immunoglobulin G1, F(ab’)2, and Fab’ in mice. Cancer Res. 1986;46:3969–78.
- Weinstein JN, Eger RR, Covell DG, Black CD, Mulshine J, Carrasquillo JA, Larson SM, Keenan AM. The pharmacology of monoclonal antibodies. Ann N Y Acad Sci. 1987;507(1 Biological Ap):199–210. doi:10.1111/j.1749-6632.1987.tb45802.x.
- Baxter LT, Zhu H, Mackensen DG, Jain RK. Physiologically based pharmacokinetic model for specific and nonspecific monoclonal antibodies and fragments in normal tissues and human tumor xenografts in nude mice. Cancer Res. 1994;54:1517–28.
- Baxter LT, Zhu H, Mackensen DG, Butler WF, Jain RK. Biodistribution of monoclonal antibodies: scale-up from mouse to human using a physiologically based pharmacokinetic model. Cancer Res. 1995;55:4611–22.
- Li Z, Li Y, Chang HP, Chang HY, Guo L, Shah DK. Effect of size on solid tumor disposition of protein therapeutics. Drug Metab Dispos. 2019;47(10):1136–45. doi:10.1124/dmd.119.087809.
- Li Z, Li Y, Chang HP, Yu X, Shah DK. Two-pore physiologically based pharmacokinetic model validation using whole-body biodistribution of trastuzumab and different-size fragments in mice. J Pharmacokinet Pharmacodyn. 2021;48(5):743–62. doi:10.1007/s10928-021-09772-x.
- Li Z, Yu X, Li Y, Verma A, Chang HP, Shah DK. A Two-Pore physiologically based pharmacokinetic model to predict subcutaneously administered Different-Size antibody/antibody fragments. AAPS J. 2021;23(3):62. doi:10.1208/s12248-021-00588-8.
- Yip V, Palma E, Tesar DB, Mundo EE, Bumbaca D, Torres EK, Reyes NA, Shen BQ, Fielder PJ, Prabhu S, et al. Quantitative cumulative biodistribution of antibodies in mice: effect of modulating binding affinity to the neonatal Fc receptor. mAbs. 2014;6(3):689–96. doi:10.4161/mabs.28254.
- Chen N, Wang W, Fauty S, Fang Y, Hamuro L, Hussain A, Prueksaritanont T. The effect of the neonatal Fc receptor on human IgG biodistribution in mice. mAbs. 2014;6(2):502–08. doi:10.4161/mabs.27765.
- Li Z, Krippendorff BF, Shah DK. Influence of molecular size on the clearance of antibody fragments. Pharm Res. 2017;34(10):2131–41. doi:10.1007/s11095-017-2219-y.
- Li Z, Krippendorff BF, Sharma S, Walz AC, Lave T, Shah DK. Influence of molecular size on tissue distribution of antibody fragments. mAbs. 2016;8(1):113–19. doi:10.1080/19420862.2015.1111497.
- Li Z, Shah DK. Two-pore physiologically based pharmacokinetic model with de novo derived parameters for predicting plasma PK of different size protein therapeutics. J Pharmacokinet Pharmacodyn. 2019;46(3):305–18. doi:10.1007/s10928-019-09639-2.
- Merchant M, Ma X, Maun HR, Zheng Z, Peng J, Romero M, Huang A, Yang N-Y, Nishimura M, Greve J, et al. Monovalent antibody design and mechanism of action of onartuzumab, a MET antagonist with anti-tumor activity as a therapeutic agent. Proc Natl Acad Sci U S A. 2013;110(32):E2987–96. doi:10.1073/pnas.1302725110.
- Kenanova V, Olafsen T, Crow DM, Sundaresan G, Subbarayan M, Carter NH, Ikle DN, Yazaki PJ, Chatziioannou AF, Gambhir SS. Tailoring the pharmacokinetics and positron emission tomography imaging properties of anti-carcinoembryonic antigen single-chain Fv-Fc antibody fragments. Cancer Res. 2005;65:622–31.
- Kenanova V, Olafsen T, Williams LE, Ruel NH, Longmate J, Yazaki PJ, Shively JE, Colcher D, Raubitschek AA, Wu AM. Radioiodinated versus radiometal-labeled anti-carcinoembryonic antigen single-chain Fv-Fc antibody fragments: optimal pharmacokinetics for therapy. Cancer Res. 2007;67(2):718–26. doi:10.1158/0008-5472.CAN-06-0454.
- Rafidi H, Estevez A, Ferl GZ, Mandikian D, Stainton S, Sermeño L, Williams SP, Kamath AV, Koerber JT, Boswell CA, et al. Imaging reveals importance of shape and flexibility for glomerular filtration of biologics. Mol Cancer Ther. 2021;20(10):2008–15. doi:10.1158/1535-7163.MCT-21-0116.
- Shivva V, Boswell CA, Rafidi H, Kelley RF, Kamath AV, Crowell SR. Antibody format and serum disposition govern ocular pharmacokinetics of intravenously administered protein therapeutics. Front Pharmacol. 2021;12:601569. doi:10.3389/fphar.2021.601569.
- Klingler S, Fay R, Holland JP. Light-Induced radiosynthesis of 89 Zr-DFO-Azepin-Onartuzumab for imaging the hepatocyte growth factor receptor. J Nucl Med. 2020;61(7):1072–78. doi:10.2967/jnumed.119.237180.
- Fay R, Gut M, Holland JP. Photoradiosynthesis of 68 Ga-Labeled HBED-CC-Azepin-MetMAb for Immuno-PET of c-MET receptors. Bioconjug Chem. 2019;30(6):1814–20. doi:10.1021/acs.bioconjchem.9b00342.
- Gill H, Seipert R, Carroll VM, Gouasmat A, Yin J, Ogasawara A, de Jong I, Phan MM, Wang X, Yang J. The production, quality control, and characterization of ZED8, a CD8-Specific 89Zr-Labeled Immuno-PET clinical imaging agent. AAPS J. 2020;22(2):22. doi:10.1208/s12248-019-0392-0.
- Ruggiero A, Villa CH, Bander E, Rey DA, Bergkvist M, Batt CA, Manova-Todorova K, Deen WM, Scheinberg DA, McDevitt MR, et al. Paradoxical glomerular filtration of carbon nanotubes. Proc Natl Acad Sci U S A. 2010;107(27):12369–74. doi:10.1073/pnas.0913667107.
- Leabman MK, Meng YG, Kelley RF, DeForge LE, Cowan KJ, Iyer S. Effects of altered FcgammaR binding on antibody pharmacokinetics in cynomolgus monkeys. mAbs. 2013;5(6):896–903. doi:10.4161/mabs.26436.
- Boswell CA, Tesar DB, Mukhyala K, Theil FP, Fielder PJ, Khawli LA. Effects of charge on antibody tissue distribution and pharmacokinetics. Bioconjug Chem. 2010;21(12):2153–63. doi:10.1021/bc100261d.
- Holton OD 3rd, Black CD, Parker RJ, Covell DG, Barbet J, Sieber SM, Talley MJ, Weinstein JN. Biodistribution of monoclonal IgG1, F(ab’)2, and Fab’ in mice after intravenous injection. comparison between anti-B cell (anti-Lyb8.2) and irrelevant (MOPC-21) antibodies. J Immunol. 1987;139(9):3041–49.
- Shah DK, Betts AM. Antibody biodistribution coefficients: inferring tissue concentrations of monoclonal antibodies based on the plasma concentrations in several preclinical species and human. mAbs. 2013;5(2):297–305. doi:10.4161/mabs.23684.
- Chang HP, Kim SJ, Shah DK. Whole-Body pharmacokinetics of antibody in mice determined using Enzyme-Linked immunosorbent assay and derivation of tissue interstitial concentrations. J Pharm Sci. 2021;110(1):446–57. doi:10.1016/j.xphs.2020.05.025.
- Rogers BE, Franano FN, Duncan JR, Edwards WB, Anderson CJ, Connett JM, and Welch MJ. Identification of metabolites of 111In-diethylene- triaminepentaacetic acid-monoclonal antibodies and antibody fragments in vivo. Cancer Res. 1995;55:5714s–20s.
- Tsai SW, Li L, Williams LE, Anderson AL, Raubitschek AA, Shively JE. Metabolism and renal clearance of 111 In-Labeled DOTA-Conjugated antibody fragments. Bioconjug Chem. 2001;12(2):264–70. doi:10.1021/bc0000987.
- Shih LB, Thorpe SR, Griffiths GL, Diril H, Ong GL, Hansen HJ, Goldenberg DM, Mattes MJ. The processing and fate of antibodies and their radiolabels bound to the surface of tumor cells in vitro: a comparison of nine radiolabels. J Nucl Med. 1994;35(5):899–908.
- Perera RM, Zoncu R, Johns TG, Pypaert M, Lee FT, Mellman I, Old LJ, Toomre DK, Scott AM. Internalization, intracellular trafficking, and biodistribution of monoclonal antibody 806: a novel anti-epidermal growth factor receptor antibody. Neoplasia (New York, NY). 2007;9(12):1099–110. doi:10.1593/neo.07721.
- Boswell CA, Mundo EE, Zhang C, Stainton SL, Yu SF, Lacap JA, Mao W, Kozak KR, Fourie A, Polakis P. Differential effects of predosing on tumor and tissue uptake of an 111 In-Labeled Anti-TENB2 Antibody–Drug conjugate. J Nucl Med. 2012;53(9):1454–61. doi:10.2967/jnumed.112.103168.
- Bumbaca D, Xiang H, Boswell CA, Port RE, Stainton SL, Mundo EE, Ulufatu S, Bagri A, Theil F-P, Fielder PJ, et al. Maximizing tumour exposure to anti-neuropilin-1 antibody requires saturation of non-tumour tissue antigenic sinks in mice. Br J Pharmacol. 2012;166(1):368–77. doi:10.1111/j.1476-5381.2011.01777.x.
- Pastuskovas CV, Mundo EE, Williams SP, Nayak TK, Ho J, Ulufatu S, Clark S, Ross S, Cheng E, Parsons-Reponte K, et al. Effects of anti-VEGF on pharmacokinetics, biodistribution, and tumor penetration of trastuzumab in a preclinical breast cancer model. Mol Cancer Ther. 2012;11(3):752–62. doi:10.1158/1535-7163.MCT-11-0742-T.
- Wilbur DS, Hadley SW, Hylarides MD, Abrams PG, Beaumier PA, Morgan AC, Reno, AC, Fritzberg, AR . Development of a stable radioiodinating reagent to label monoclonal antibodies for radiotherapy of cancer. J Nucl Med. 1989;30:216–26.
- Eaton DL, Wood WI, Eaton D, Hass PE, Hollingshead P, Wion K, Mather J, Lawn RM, Vehar GA, Gorman C, et al. Construction and characterization of an active factor VIII variant lacking the central one-third of the molecule. Biochemistry. 1986;25(26):8343–47. doi:10.1021/bi00374a001.
- Carter P, Kelley RF, Rodrigues ML, Snedecor B, Covarrubias M, Velligan MD, Wong WL, Rowland AM, Kotts CE, Carver ME, et al. High level Escherichia coli expression and production of a bivalent humanized antibody fragment. Bio/technol (Nature Publishing Company). 1992;10(2):163–67. doi:10.1038/nbt0292-163.
- Simmons LC, Reilly D, Klimowski L, Raju TS, Meng G, Sims P, Hong K, Shields RL, Damico LA, Rancatore P. Expression of full-length immunoglobulins in Escherichia coli: rapid and efficient production of aglycosylated antibodies. J Immunol Methods. 2002;263(1–2):133–47. doi:10.1016/S0022-1759(02)00036-4.
- Wong AW, Baginski TK, Reilly DE. Enhancement of DNA uptake in FUT8-deleted CHO cells for transient production of afucosylated antibodies. Biotechnol Bioeng. 2010;106(5):751–63. doi:10.1002/bit.22749.
- Zarzar J, Shatz W, Peer N, Taing R, McGarry B, Liu Y, Greene DG, Zarraga IE. Impact of polymer geometry on the interactions of protein-PEG conjugates. Biophys Chem. 2018;236:22–30. doi:10.1016/j.bpc.2017.10.003.
- Chizzonite R, Truitt T, Podlaski FJ, Wolitzky AG, Quinn PM, Nunes P, Stern AS, Gately MK. IL-12: monoclonal antibodies specific for the 40-kDa subunit block receptor binding and biologic activity on activated human lymphoblasts. J Immunol. 1991;147:1548–56.
- Mandikian D, Takahashi N, Lo AA, Li J, Eastham-Anderson J, Slaga D, Ho J, Hristopoulos M, Clark R, Totpal K, et al. Relative target affinities of T Cell-Dependent bispecific antibodies determine biodistribution in a solid tumor mouse model. Mol Cancer Ther. 2018;17(4):776–85. doi:10.1158/1535-7163.MCT-17-0657.
- Zeisberg M, Kalluri R. Physiology of the renal interstitium. Clin J Am Soc Nephrol. 2015;10(10):1831–40. doi:10.2215/CJN.00640114.
- Reuter S, Schnockel U, Schroter R, Schober O, Pavenstadt H, Schafers M, Gabriels G, Schlatter E. Non-invasive imaging of acute renal allograft rejection in rats using small animal F-FDG-PET. PloS one. 2009;4(4):e5296. doi:10.1371/journal.pone.0005296.
- Yao X, Hrabetová S, Nicholson C, Manley GT. Aquaporin-4-deficient mice have increased extracellular space without tortuosity change. J Neurosci: off J Society Neurosci. 2008;28(21):5460–64. doi:10.1523/JNEUROSCI.0257-08.2008.