
ABSTRACT
Deamidation of asparagine (Asn) and isomerization of aspartic acid (Asp) residues are among the most commonly observed spontaneous post-translational modifications (PTMs) in proteins. Understanding and predicting a protein sequence’s propensity for such PTMs can help expedite protein therapeutic discovery and development. In this study, we used proton-affinity calculations with semi-empirical quantum mechanics and microsecond long equilibrium molecular dynamics simulations to investigate mechanistic roles of structural conformation and chemical environment in dictating spontaneous degradation of Asn and Asp residues in 131 clinical-stage therapeutic antibodies. Backbone secondary structure, side-chain rotamer conformation and solvent accessibility were found to be key molecular indicators of Asp isomerization and Asn deamidation. Comparative analysis of backbone dihedral angles along with N-H proton affinity calculations provides a mechanistic explanation for the strong influence of the identity of the n + 1 residue on the rate of Asn/Asp degradation. With these findings, we propose a minimalistic physics-based classification model that can be leveraged to predict deamidation and isomerization propensity of proteins.
Introduction
Protein stability is at the center of biological mechanisms spanning molecular pathways and therapeutic interventions.Citation1–3 Proteins are subject to various post-translational modifications (PTM) that are essential for their function, e.g., glycosylation, acylation. Some of these PTMs are spontaneous chemical reactions that lead to degradation, such as deamidation of asparagine (Asn→Asp/iso-Asp), isomerization of aspartic acid (Asp→iso-Asp) and oxidation of Met/Trp residues.Citation4,Citation5 These spontaneous chemical modifications often serve as a key indicator of stress that elicits a physiological response.Citation6 Bio-manufactured therapeutic proteins, including peptides, vaccines, monoclonal antibodies (mAbs), and viral capsids, are subject to physical and chemical stressors during manufacturing that result in accumulation of various PTMs.Citation7–11 Spontaneous chemical modification can negatively impact the biomolecule’s therapeutic efficacy, quality and developability by altering the structure and/or molecular properties of the protein. For instance, isomerization of an Asp residue alters the backbone connectivity and deamidation of an Asn residue imparts a negative charge (), both of which can result in altered functional consequences.Citation12,Citation13 Often protein engineering strategies are used to mitigate the negative impacts of such chemical modifications, but this is carried out in an iterative manner, which leads to prolonged development cycle for therapeutic proteins.Citation14–16 Understanding and predicting the propensity of a therapeutic protein to undergo chemical degradation can expedite development timelines.Citation17–20
Figure 1. Deamidation (1a) and Isomerization (1b) reaction mechanisms showing deprotonation (1) of the n + 1 amide leading to the formation of succinimide intermediate (2) and hydrolysis of succinimide (3) into aspartic acid (3a) or iso-aspartic acid (3b).
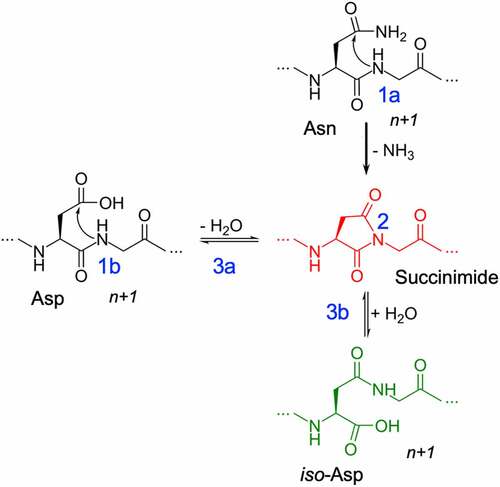
Deamidation of an Asn residue has been experimentally well characterized.Citation21–23 Among the multiple pathways that are feasible, pH-dependent base-catalyzed nucleophilic attack has been shown to be the predominant pathway.Citation23–26 The reaction is irreversible and proceeds via a 3-step process: 1) base-catalyzed deprotonation of the n + 1 amide, 2) nucleophilic attack of the anionic nitrogen on the side-chain carbonyl group and a subsequent ring closure that leads to the formation of a succinimide intermediate, and 3) hydrolysis of the succinimide into Asp or iso-Asp (). Similarly, the isomerization reaction can proceed from an Asn or Asp residue via the same succinimide intermediate pathway. There are mechanistic parallels and kinetic dissimilarities between the isomerization and deamidation reactions.Citation13,Citation27,Citation28 Experimentally, it has been shown that the degradation half-times of Asn (or Asp) residue in small peptides can vary by orders of magnitude depending on the residue at n + 1 position on the C-terminal end.Citation21,Citation29–32 Previous studies using pentapeptides by Robinson et al.Citation33 have shown a higher likelihood of chemical degradation if the n + 1 neighboring residue of the Asn residue is a Gly, Ala, Ser or Thr. Based on these peptide-level studies, the NX and DX (where X could be G/A/S/T) are often considered hotspots for degradation in proteins. However, such peptide-level sequence rules are not necessarily applicable to folded proteins. For example, a recent study by Lu et al.Citation34 reported an experimental survey of 131 clinical-stage therapeutic antibodies (henceforth referenced as the Adimab dataset), which revealed vast discrepancies in the range of deamidation and isomerization propensities among antibodies that did not follow the sequence-dependent hotspot rules. For instance, there were 27 deamidation sites with the hotspot NG sequence in the complementary-determining region (CDR), of which only 14 underwent deamidation. A similar trend was observed in the case of isomerization (16 of 44 DG sites isomerized). Furthermore, chemical degradation was observed at NY, NW, DR and DY motifs that are not considered hotspots based on the peptide-level studies. The results reported in Lu et al. indicate a gap in our knowledge of how the neighboring residues contribute to the chemical degradation propensity in proteins.
Multiple computational strategies, from physics-based approaches (e.g., quantum mechanics/molecular mechanics (QM/MM), molecular dynamics (MD) simulations)Citation29,Citation30,Citation35,Citation36 along with machine-learning models,Citation17,Citation20,Citation37 have been developed over the past two decades to predict deamidation and isomerization in peptides and proteins. Several detailed computational models explored site-specific effects using QM/MM calculations at the peptide level. For example, ab initio calculations on Gly-containing peptide mimetic model compound (N-formyl-glycinamide) revealed how the conformation of the molecule affects the proton-affinity of the backbone amide (). Citation38 However, it is unclear if this trend is generalizable to Asp and Asn residues where the n + 1 residue is not Gly. Multiple machine learning (ML) models have been proposed that were trained on a number of structure-based features such as secondary structure, local flexibility, size of the neighboring residue, and solvent exposure.Citation17,Citation20,Citation37,Citation38 While computationally facile and practical in nature, ML-based models often focus exclusively on prediction without necessarily offering mechanistic insight into causality. Sometimes important mechanistic and structural details such as conformational dynamics, key for the reaction’s feasibility, are neglected. Lastly, given that these models are trained on a limited set of data points using pre-assumed input features, their generalizability to new datasets remain unclear.
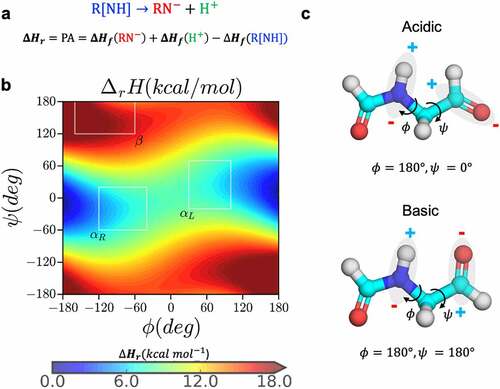
Figure 2. Dependence of proton affinity of small molecule N-formyl-glycinamide on backbone conformation. (a) the deprotonation reaction and calculation of proton affinity as the heat of formation of the forward reaction, (b) the proton affinity distribution of the small molecule N-formyl-glycinamide as a function of the backbone dihedral angles, and (c) the most acidic and basic conformations based on the proton affinity distribution.
Here, we used proton-affinity calculations with semi-empirical QM, microsecond long equilibrium MD simulations, and a conformational analysis of all of the antibody structures in the Protein Data Bank (PDB; www.rcsb.org) to provide insight into the effect of neighboring residues in dictating the chemical degradation at Asn/Asp site of proteins. Based on the analysis of a large set of the Adimab dataset, including 1000+ Asn/Asp sites in the CDR region, we propose a physics-based classifier model that can accurately predict the propensity of deamidation and isomerization of a protein sequence. The model relies on decomposing the major steps of the reaction (deprotonation, nucleophilic attack, and hydrolysis) as conformational degrees of freedom and inferring the reaction propensity based on the thermodynamic feasibility of exploring those conformations.
Results
Conformational determinants of deprotonation
Peptide backbone conformation and amide acidity. Deprotonation of the amide nitrogen in proteins has been experimentally characterized to proceed via a base-catalyzed reaction that is quite spontaneous even at acidic conditions.Citation31,Citation39–41 Several studies have investigated the dependence of backbone amide acidity on the conformation and chemical environment using QM/QMMM calculations.Citation29,Citation30,Citation35–37 In pioneering studies, Radkiewicz et al.Citation26,Citation27 used N-formyl-glycinamide as a model compound representing a peptide bond to calculate the relative proton affinity as a function of the ϕ and ψ dihedral angles (using HF/6-31 + G*//HF/3-21 G). The calculations showed that conformations along the ψ dihedral angle had a larger impact on the backbone acidity of peptide bond relative to the ϕ angle. Here, we carried out density functional theory (DFT) calculation to estimate proton affinity for the same model compound at the M062X/6-311++G (d, p) level of theory in both gas phase and aqueous phase continuum SMD (Solvation Model Based on Density) solvent environment. Our results agree with the earlier studies: proton affinity of backbone amide varies significantly with respect to changes in the backbone conformation ( and S1). Specifically, in α-helical conformation the proton bonded to the amide experiences a repulsive force from the adjacent carbonyl carbon as a result of a di-electric instability with the amide nitrogen () i.e., proton affinity of the model compound is lower in the α-helical conformation centered around −60° ≤ ψ ≤ 60°, . The gas phase semi-empirical QM calculations using MOPAC with PM6-D3H4,47 PM7 and RM1 Hamiltonians (see methods and Figure S1) are also consistent with DFT results.
To better understand the mechanism by which peptide backbone conformation affects amide acidity, we extended the proton affinity calculations as a function of backbone ϕ & ψ dihedral angles to different DX and NX dipeptides, and Figures S2-S16. As reported previously,Citation33 fold differences are observed in reaction half-lives of pentapeptides due to the variations in the n + 1 residue. For instance, an interesting comparison can be made between Gly and Ala as n + 1 residue. In solution, GGNGG and GGNAG peptides show high propensity to adopt an α-helical conformation,Citation41,Citation42 yet their deamidation half-lives are an order of magnitude different (1.03 and 21.1 d, respectively).Citation33 From the proton affinity calculations, we observed that the amides in both NG and NA are indeed acidic around −60° ≤ ψ ≤ 60° conformations (). However, the amide proton affinity in the NA peptide significantly changes as a function of the ϕ angle. Specifically, the backbone amide of the NA residue is more acidic in conformations where ϕ > 0 compared to ϕ < 0 within the same boundary of −60° ≤ ψ ≤ 60°. In other words, the proton affinity of NA peptide is also dependent on the type of the helical conformation (right-handed α-helix versus left-handed α-helix). A right-handed α-helix conformation places the methyl side-chain group in close proximity to the backbone amide that offers protection from exposure to the base and/or hydrolysis (, conformation 2).
Figure 3. Conformational determinants of proton affinity in NG and NA dipeptides. a) the gas-phase proton-affinity calculated with the semi-empirical PM6 Hamiltonian as a function of ϕ & ψ angles (upper panels) and the kernel density estimation plots of ϕ & ψ angles for the respective NG and NA motifs observed in the PDB database of crystallized antibodies (lower panels). b) Representative conformations and the possible ways in which the values of ϕ & ψ affects proton affinity: beta sheet (b1, basic), right-handed helix (b2, basic), and left-handed helix (b3, acidic).
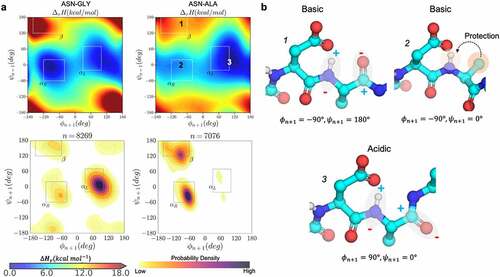
Similarly, it can be inferred from the proton affinity plots for different [N/D]X dipeptides (Figures S2-S16) that amide acidity in right-handed α-helix conformations is affected by the side chain of the n + 1 residue. The side chain-mediated protection increases with increasing the size of nonpolar, hydrophobic (i.e., Phe > Ile > Leu > Val > Ala). On the other hand, the presence of a polar hydroxyl or carbonyl groups in the n + 1 side chain (as in Asp, Ser, Thr, Asn, Tyr) facilitates the deprotonation of the amide by solvent-mediated electrostatic interactions. In any left-handed α-helix conformation, or in the case of Gly, the protection from the n + 1 residue is completely lost (, conformation 3), which is consistent with the previous results based on the model compound.Citation26,Citation27
Crystal structure analysis. It must be noted that a large fraction of combinations of ϕ & ψ dihedral angles explored in the dipeptide models are energetically inaccessible in folded proteins. To identify the relevant secondary structures for the NX and DX motifs in proteins, we collected ϕ & ψ angle distribution from all the antibody crystal structures available in the PDB. These distributions were analyzed using kernel density estimation (KDE) to arrive at the probability density function (PDF) of conformational preference for [N/D]X residues in ϕ & ψ space ( and Figures S2-S16). Comparing the proton affinity calculations with the conformational PDF reveals that [N/D]G sites mainly populate the acidic left-handed α-helical conformations, whereas [N/D]A sites largely favor the basic right-handed helix (ϕ < 0 region) or the beta sheet. The latter agrees with a previous work showing that a steric interaction between the methyl group and the terminal carbonyl oxygen destabilizes all structures with ϕ ~ 120°, relative to glycine dipeptides.Citation43 These results clearly explain why [N/D]A sites are often orders of magnitude less prone to degradation than [N/D]G sites.
A comprehensive analysis of the proton affinity calculations and conformational PDF (Probability Density Function) in ϕ & ψ space for all the [N/D]X sites (Figures S2-S16) revealed that the frequency of observing a residue in the acidic region from the PDB is strongly correlated with the likelihood of the residues to undergo degradation. In particular, we observed that the most frequently modified, or canonical, [N/D]X sequences based on various reports (i.e., DG,Citation44–46 DS,Citation14,Citation47,Citation48 DD,Citation48 DT,Citation20 DH,Citation49 NG, NS, NN, and NTCitation12,Citation20,Citation33,Citation44) mainly favor the left-handed helix in the Ramachandran plot, i.e., the backbone is acidic and any side-chain protection by the n + 1 residue is completely lost (, conformation 3). Interestingly, the strongest left-handed helix population is seen for DG and DS, followed by DH, DD, and DN. Similarly, for deamidation motifs, a decreasing population of left-handed helix is observed in the order of NG, NS, NN and NT.
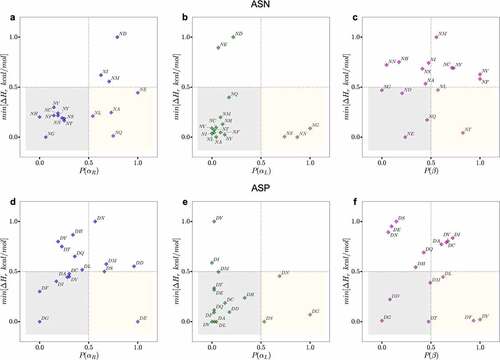
To better illustrate this point, we plotted the normalized probability of secondary structure conformations (area under the PDF surface bound by the region in ϕ & ψ space) for [N/D]X motifs in all of the antibodies in the PDB against the normalized minimum proton affinity calculated for the corresponding dipeptides in the same conformational region (, S17 and S18). The canonical NX motifs (NG, NS, NN, and NTCitation12,Citation20,Citation33,Citation44) clearly aggregate in the bottom right quadrant of the plot (yellow boxes in ), which corresponds to a high probability of adapting a low proton affinity conformation within each bounding box (αR,αL and β) defined in . In contrast, non-canonical motifs (e.g., NV, NL, NM, NC, NI, NF, NE, ND) either largely favor a basic beta-sheet conformation (, top-right quadrant), or a basic right-handed helix (e.g., NI, NM, and ND in , top-right quadrant). A similar trend is observed for DX motifs (, S19 and S20), canonical motifs such as DG, DS and DD fall either within or very close to the high-risk quadrants. A few exceptions to this trend are DY, DF and DL that are unexpectedly placed in the low proton affinity region of the beta sheet conformation, . However, a side-by-side comparison of the proton affinity calculation plots and conformational PDF plots for these three residues (Figures S11, S14 and S15) suggests that: 1) these motifs indeed highly favor a β-sheet conformation, and 2) on average, the proton affinity is still much higher in the β-sheet region compared to αR and αL. In fact, the minimum proton affinity value for these three motifs () is defined by an abrupt decrease in the rough proton affinity surface, and it is not representative of the overall trend.
Figure 4. Plots of the normalized probability of secondary structure conformations for NX (upper panels) or DX (lower panels) motifs for antibody structures in PDB (X-axis) and the normalized minimum PM6 proton affinity heat of formation observed in the same region in Y-axis. The yellow boxes show motifs that are likely to adapt the corresponding conformation (X-axis) resulting in a low relative proton affinity. The gray boxes highlight motifs that are less likely to adapt the corresponding conformation but will result in a low proton affinity. The regions outside gray and yellow represent high proton affinity motifs and conformations (less prone to degradation). The residues in the yellow boxes are most often the hot spot residues.
Overall, demonstrates the role of a combined effect of secondary structure and the identity of the n + 1 amino acid side chains in impacting chemical degradation. Therefore, we use the ϕ & ψ backbone dihedral angle of the peptide bond at an [N/D]’s n + 1 position as a metric to identify sites that have higher propensity to deprotonate: 1) β-sheet conformation is less deprotonation prone, 2) the left-handed α-helix regions (−60° ≤ ψ ≤ 60°, ϕ > 0°) is acidic for all amino acids that have a nonpolar (A, V, L, I) or bulkier side-chain groups (F, W), and 3) on the contrary, for small polar amino acids (G, S, T, D) both the left and right-handed α-helix (−60° ≤ ψ ≤ 60°) conformations are acidic.
Application to therapeutic antibodies. Next, we explored the relationship between backbone conformations of the [N/D]X sites in the CDR regions of 131 therapeutic mAbs and their reported degradation rates. This dataset corresponds to 1039 [N/D] X sites (498 Asp and 541 Asn) of which 30 DX and 39 NX sites were prone to degradation (reactive). To obtain the backbone conformation preference, we calculated the conformational free energy surface (FES) in the ϕ & ψ space for the n + 1 residue from microsecond long equilibrium MD simulations of the antigen-binding fragment (Fab) structures. We arbitrarily chose a value of 2kBT energy barrier or ~1 kcal/mol to define energetically favorable conformations, i.e., in the FES, a region whose energy values are <1 kcal/mol are likely to be sampled under equilibrium conditions. The n + 1 residues were considered to be in a left-handed or right-handed α-helix if the minimum energy values in the regions of FES where −60° ≤ψ ≤ 60° and ϕ > 0, or ϕ < 0, were <1 kcal/mol.
shows that the calculated conformational distribution (PDF) of reactive and non-reactive residues correspond very well with the expected conformational preference seen in proton affinity calculations. The experimentally reported non-reactive residues show a preference to the right-handed α-helix or the β-sheet conformation, while the reactive residues show large preference to the left-handed helical conformation. (D1) reveals a correlation between the rate of degradation and the probability of the backbone amide being found in the acidic regions. With the exception of two sites, the degradation rates fall below the desirable 5% cutoff for all the [N/D]X sites that are in a basic backbone conformation (i.e., Free Energy >1 kcal/mol, which corresponds to either a beta-sheet or a right-handed helix when the n + 1 residue is nonpolar). However, the results in (D1) suggest that an acidic backbone conformation (Free Energy < 1 kcal/mol) does not always result in high degradation rates (% Degraded > 5). A high propensity for a basic conformation can prevent the site from degradation, but lack thereof is not sufficient for degradation.
Figure 5. Kernel density estimation plots for the ϕ & ψ dihedral angles populated in MD simulations combined for all 1039 residues that neighbor Asp (top) or Asn (bottom) in the Adimab dataset. The ϕ & ψ angle distributions were collected from μs long equilibrium MD simulations and classified as reactive (left) and non-reactive (right) based on the measurements reported in the Adimab dataset. A clear pattern emerges around the left-handed α-helix conformation in reactive cases that is distinct from the non-reactive cases on the right.
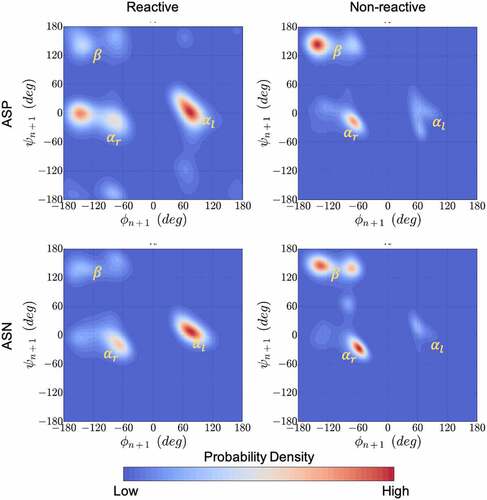
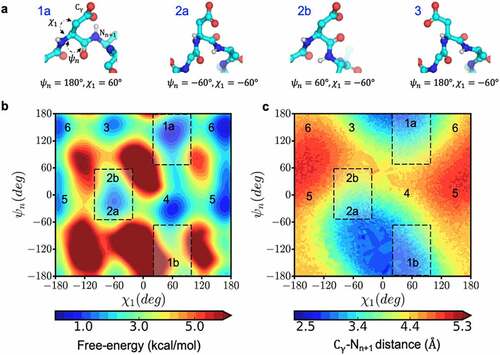
Figure 6. Conformational space that enables near-attack distances increasing the propensity for succinimide formation. a) The structural orientation of the reactive (1a and 2a) and non-reactive (2b and 3) side-chain conformations, characterized by ψ & χ, for an aspartic acid residue shown in ball and stick representation. b) Free-energy surface in the space of ψ & χ dihedral angles and c) the corresponding distance between Cγ and the n + 1 amide nitrogen calculated from metadynamics simulation of Ace-GGNAG-Nme pentapeptide.
The backbone conformational preference of NX and DX residues under equilibrium conditions as a single descriptor was found to classify the reactive vs non-reactive residues at 65% accuracy (). This shows that proton affinity inferred from the secondary structure of n + 1 residue is a decisive descriptor to predict degradation propensity of NX and DX sites.
Table 1. Performance analysis for the physics-based classifier model using different combinations of the descriptors: (D1) backbone dihedral conformation of the n + 1 residue, (D2) side-chain dihedral conformation of Asn/Asp residue, (D3) fraction of time the Asn/Asp residue remains solvent accessible. Combinations are represented by DXX where the X represents the descriptors.
Conformational determinants of cyclization
Once deprotonation is enabled by the acidity of the backbone, the next step in the reaction is ring closure leading to succinimide formation via nucleophilic attack between N- atom of the n + 1 residue and Cγ of the ASN/ASP residue (). In order for the nucleophilic attack to be feasible, the N- and Cγ should come closer than distances of 3.0 Å (near-attack conformation).Citation29,Citation30 In folded proteins, side-chain interactions, including hydrogen bond formation, can limit the conformational flexibility of Asn/Asp residues to visit near attack conformations. This in turn can disfavor succinimide formation. Multiple side-chain orientations can result in the near attack conformation (). Conformational degrees of freedom affecting the distance between Cγ and Nn+1 can be defined as a function of the two dihedral angles ψ & χ1.
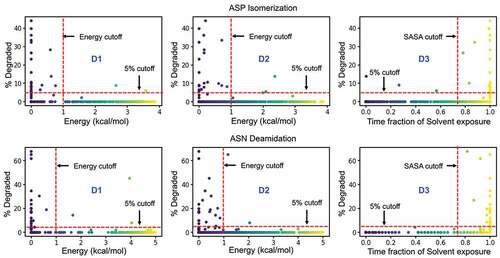
Figure 7. Performance of individual descriptors in discriminating degraded Asp (top) and Asn (bottom) residues from the Adimab dataset. The percentage degradation values reported in the Adimab study are represented on the X-axis. The Y-axis in the leftmost panel (D1) is the free-energy barrier at the deprotonation prone backbone helical conformation of the n + 1 residue. The Y-axis in the middle panel (D2) is the free-energy barrier at the near-attack conformation defined by the ψ & χ angles. The Y-axis in the rightmost panel (D3) is the time fraction when the Asp/Asn residue remains solvent accessible. The red cutoff markers indicate the values that determine if a residue is prone to degradation or not. The blue shaded regions indicate the false negative predictions (experimentally observed to degrade but classified as non-reactive) and the gray shaded region indicates the false positives (predicted reactive but not evidenced experimentally).
To identify the relevant conformations that enable a nucleophilic attack distance, we sampled the free energy space of ψ & χ1 angles in Ace-GGNAG-Nme pentapeptide using Metadynamics simulations. By applying an additive historical bias, Metadynamics pushes the system to explore conformations that are kinetically limited in an equilibrium simulationCitation50. There are six low energy states in the ψ & χ1 space (), of which two regions are coincident with the near attack conformation distance (). With this information, we looked at the correlation between the near attack side-chain conformation and the experimental rates reported in the Adimab dataset. As with the backbone conformation, we looked at the FES from the equilibrium MD simulation. The side chains were considered to be in a near-attack conformation if the minimum energy values in the regions of FES where −100 < χ1< −20 and −60 < ψ < 60 (, region 2), or 20 < χ1 < 100 and ψ < −60 or ψ > 60 (, region 1), were <1 kcal/mol.
, D2 shows that when the side chain is not in a near-attack conformation (i.e., Free Energy > 1 kcal/mol), the reaction rates largely remain below the 5% cutoff, with a few exceptions. Otherwise, the residue may or may not be reactive, as suggested by the large number of data points below and above 5% for Free Energy <1 kcal/mol. Therefore, the side-chain conformation indeed proved to be a useful descriptor in identifying reactive residues (, D2). The overall accuracy of the prediction was at 40%, but when used in combination with the backbone conformation rule, i.e., both the acidic conformation and the near attack conformations are energetically feasible, the accuracy of the classification model improves to 75% ().
Solvent accessibility
Water plays an important role in the deamidation and isomerization reaction as a proton donor/acceptor. Both the base catalyzed deprotonation and hydrolysis of succinimide intermediate to Asp/iso-Asp are only feasible in the presence of water molecules (). In previous studies, solvent accessibility weakly predicted the reaction propensity.Citation19,Citation20,Citation33 These previous calculations were done on static protein structures that lacked proper structural relaxations that may affect solvent accessibility calculations. Our solvent accessibility calculations use a dynamic approach in combination with intuitions about the reaction. Here, we calculated the solvent accessibility at a residue level. In order to capture the dynamic aspect of the solvent occupancy, we represented solvent accessibility as a fraction of time in which the Asn/Asp residue remained accessible (see methods). Using this value, we once again sought to classify the Asn/Asp residues in the Adimab set as reactive vs non-reactive. , D3 shows that solvent-inaccessible side chains (time fraction of solvent exposure < 75%) are indeed protected from the reaction. However, a large number of both reactive and non-reactive cases are seen in the solvent-accessible region (time fraction of solvent exposure > 75%). The overall accuracy in predicting the reactivity using the solvent-accessible surface area as a single descriptor is 39%, which is no better than the performance of the near attack conformation metric.
Combined model
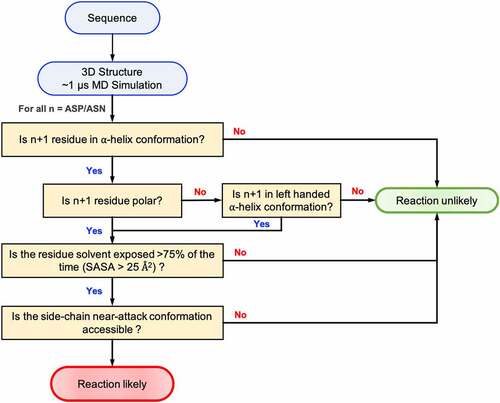
As discussed above, deamination and isomerization reactions can be described in the three consecutive steps: deprotonation, cyclization, and hydrolysis. Using a multiscale computational approach, we were able to test the propensity of degradation in the Adimab dataset using these physics-based metrics. Since all three steps are essential for the reaction, we sought to check if a combination of the three metrics would improve the classification accuracy: (D1) deprotonation – as represented by the free-energy profile of ϕ, ψ angles of the n + 1 residue recovered from the MD simulation, (D2) cyclization – as represented by the free-energy profile of χ1, ψ angles also recovered from the MD simulation, and (D3) hydrolysis – as represented by the solvent accessibility calculated as the fraction of solvent occupied state in MD trajectory. The decision tree that we used to classify if an Asn/Asp residue is likely to degrade is shown in . The Adimab dataset discussed herein is disproportionately distributed toward true negatives (non-reactive) vs true positives (reactive), so this presented a challenge to interpreting common statistical measures such as accuracy. We instead chose to use balanced accuracy, Matthew’s correlation coefficient (MCC) and Cohen’s Kappa score (CKS) as the statistic to compare the three individual descriptors, as well as combinations. We also created a naïve predictor that would predict all the residues as non-reactive; this naïve predictor will score 0 on both the MCC and CSK statistic. As can be seen from , the physics-based classifier model based on the three descriptors offers an overall balanced accuracy of 83% in predicting the isomerization and deamidation sites. All three descriptors have a better MCC and CKS score compared to the naïve predictor. Similarly, any combination of two descriptors performed moderately better than a single predictor. The combined model using all three descriptors is better at predicting non-reactive residues over reactive residues, which could be useful in a therapeutic manufacturing setting where the cost of predicting a reactive residue as non-reactive is higher. This combined mechanistic model acts as a good screening criterion in identifying antibodies that are prone to chemical degradation via deamidation or isomerization.
Figure 8. Flowchart showing the decision scheme used to determine if a given Asn/Asp residue is likely to degrade in folded proteins.
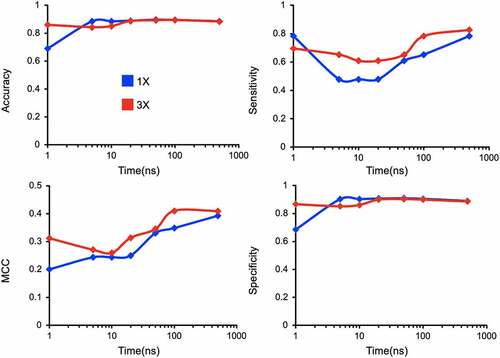
Finally, we investigated the impact of simulation sampling time and number of replicates on the reliability of the prediction results. Both the sampling time and conformation sourced from multiple replicates have a direct impact on the probability of observing kinetically limited events in equilibrium simulations. We calculated accuracy metrics: MCC, specificity, sensitivity, and accuracy, as a function of different simulation lengths and numbers of replicas (). We find that accuracy and specificity plateau in the 10-to-100 ns regime, whereas more robust performance indicators such as MCC and sensitivity show improvement with longer simulations, regardless of the number of replicates. Furthermore, predictions were more reliable when the conformations were collected from multiple short replicates over conformations from one long simulation. This is directly attributable to a decrease in the number of false positives with increased number of replicas that has been observed in similar studies performed by others.Citation51 Overall, our method is robust when conformations are sourced from at least three replicate simulations of the system each at least 100 ns long. This replication and duration give an optimal trade-off between accuracy and computational investment.
Figure 9. Assessing sensitivity of model accuracy to the variations in simulation length (1–500 ns) and replicas (1 and 3).
Discussion
Spontaneous chemical degradation at the Asn/Asp residues is an important problem that affects the developability of the protein therapeutics. Typically, the issues of chemical degradation are encountered at later stages in the development, at which point iterative protein-engineering efforts are used to mitigate these modifications. Such iterative efforts prolong development timelines and delay the delivery of lifesaving therapeutics to patients. Multiple computational strategies ranging from QM calculations to machine learning models have been proposed to predict degradation in Asn/Asp. Very few such tools (if any) generalize for high-throughput screening. We leveraged prior theoretical and experimental findings on the Asn/Asp degradation reactions to carry out multiscale analysis to comprehensively evaluate the chemical degradation in 1039 residues (498 Asp and 541 Asn) spanning 131 therapeutic mAbs. In doing so we made several notable observations. First, amide acidity in right-handed α-helix conformations is highly dependent on the n + 1 residue; a nonpolar n + 1 side chain decreases the amide acidity through protection from exposure to the base and/or hydrolysis. The protection from the n + 1 side chain is completely lost in left-handed α-helix conformations, as well as in the case of Gly. Second, specific regions of the Asn/Asp’s side-chain conformational space facilitate a near-attack conformation and are energetically more favorable in reactive sites. Third, solvent-inaccessible side chains are protected from the reaction. From an experimentally validated set, we were able to connect molecular intuition from the reaction mechanism to a real-life scenario. Using just three descriptors that are fundamental to the protein structure one can heuristically classify the likelihood of the protein to undergo chemical degradation at the ASN/ASP sites. Although we have exclusively examined mAbs in this study, we believe that the structural and chemical insights described herein are broadly applicable and generalizable to all proteins and protein-based therapeutics.
Materials and methods
Experimental dataset
The validation data contained 498 Asp and 541 Asn residues in the CDR loops of 131 therapeutic mAbs published by Lu et al.Citation34 The isomerization events were analyzed at low pH stress (pH 5.5) for 2 weeks at 40°C. A total of 31 isomerization sites were identified with total modification measurements ranging from 2.1% to 44.0%. The deamidation data were obtained at high pH stress (pH 8.5) for 1 week at 40°C. A total of 39 deamidation sites were reported with degradation levels ranging from 2.0% to 67.7%. We used a threshold cutoff of 5.0% for both isomerization and deamidation events to classify reactive versus non-reactive.
QM calculations
Semi-empirical QM (SQM) calculations to calculate proton affinity were performed using GAUSSIAN09Citation52 and MOPAC2016Citation53 software packages. To rule out any uncertainties in the proton affinity calculations, we carried out DFT calculation of proton affinity for N-formyl-glycinamide at M062X/6-311++G(d,p) level of theory in both gas phase and aqueous phase continuum SMD solvent environment.Citation54 The gas phase calculations where then repeated in MOPAC with PM6-D3H4,Citation55 PM7 and RM1 semi-empirical methods (SI).Citation54 The regions of proton affinity qualitatively matched across DFT and SQM levels of theory, albeit with variations in the energy values as expected due to variations in the theory and the Hamiltonian. DFT, although accurate, remained prohibitive for exploring conformations across all dipeptides. Semi-empirical QM methods PM6-D3H4, RM1 and PM7 each had discontinuities and convergence issues in sampling conformations of polar side chains. The choice of the SQM functional had a direct impact on how the proton-affinity of a specific conformation is interpreted. We chose to err on the side of caution and took a consensus of the proton-affinity plots from all three functionals to make interpretations. SQM functional are in constant improvement and being corrected for short range interactions, recalculating proton-affinity with those improved potentials can improve interpretations. Overall, we tried to make only qualitative inferences from the QM calculations and we refrained from interpreting the exact energy, as that is beyond the scope of this study.
Dipeptides of the Ace-NX-Nme and Ace-DX-Nme, as well as their corresponding deprotonated anions (where X can be single letter code of all 20 amino acids), were generated using OpenBabel.Citation56 The generated structures were subject to geometry optimization under PM6 level of theory to arrive at an initial structure. A 2D PES scan at PM6-D3H4, PM7 and RM1 levels of theory. The scan was performed at 10° intervals spanning the entire Ramachandran region. A total of 1369 data points were scanned for each dipeptide and its corresponding anion. At each step, geometry optimization was requested to adhere to TIGHT convergence criterion while the angles being scanned would be kept constant. The resulting PES were used to arrive at the proton affinity expressed in the heat of formation for the forward reaction as described in . The discrete energy points were interpolated and plotted using linear spline interpolation as implemented in the sklearn and matplotlibCitation57 python packages.
PDB library
We downloaded the PDB file of all the antibody (and antibody-like molecules such as Fab, scFv) that have crystal structure deposited in the PDB from SAbDab (The Structural Antibody Database http://opig.stats.ox.ac.uk/webapps/newsabdab/sabdab/).Citation58,Citation59 We arrived at 3493 structures, which were then cleaned, energy minimized and isolated from any other ligands. Using these structures, we calculated backbone dihedral angles of all Nx and Dx residues from the Fab domain. All the PDB handling was performed using MDanalysisCitation60 and PyTrajCitation61 python tools. The backbone dihedral angle distribution from this data was used for calculating 2D kernel density estimation using the SciKit-Learn python package.Citation62
KDE calculation
In order to compare the KDEs that were calculated from the PDB and the backbone dihedral angles observed in the MD simulations, we first classified each [N/D]X site as reactive or non-reactive based on the deprotonation metric. We collected the ϕ & ψ angle distribution for all these sites across all MD trajectories. This data was used to calculate the second kernel density estimation plot in , using the same scikit-learn package as before.
Molecular dynamics simulation
Molecular Operating Environment (MOE)Citation63 software from Chemical Computing Group was used to homology model each of the Fab domain of all the antibodies accessed in the Adimab dataset. The Fab homology modeling tool in MOE constructs the full Fab domain using only the Fv sequences from the Adimab set as input. The Fab structures were energy minimized to remove any steric clashes. The energy minimization was performed using SANDER program in Amber2015.Citation64 The protonation states at pH 5.5 and 8.5 were assigned using the PDB2PQR tool. The two pH values mimic the buffer conditions in which the reactivity was estimated in the Adimab experiment.
Energy-minimized Fab structures were then prepared for equilibrium MD simulations by solvating the structure in a cubic box of TIP3P explicit water (model).Citation65 It was ensured such that the Fab was positioned at a minimum 10 Å distance from the edge of the box. The system was then adjusted to have a net neutral charge by adding Na+ and Cl- counter ions. Hydrogen Mass Repartitioning was performed on the solute atoms to enable long simulation time steps of 4 fs.Citation66
The GPU implementation of Amber 2015 MD software packageCitation64 with the SPFP precision model was used for the MD simulation. The simulations proceeded by relaxing the system with 2000 steps of conjugate-gradient energy minimization. Harmonic restraining potentials with the force constant of 10 kcal/mol/Å2 were imposed to restrain the solute to its initial structure, post which the system was brought to an NPT ensemble with the pressure maintained at 1 atm and the thermostat set to 300 K over the course of 200 ps, while the protein was restrained using a harmonic positional restraint of 10 kcal/mol/Å2. The system was then equilibrated for 1 ns with a restraint force constant of 1 kcal/mol/ÅCitation2 on the protein structure maintaining the pressure and temperature at the same levels. The system was then subject to equilibrium MD simulation at NPT ensemble without any restraints at a time step of 4 fs. Long-range interactions were cut off at 9 Å and restricted range limited interactions. Coulombic interaction was calculated using the Particle Mesh Ewald algorithm for long-range electrostatics. The thermostat was maintained at 300 K with Langevin dynamics and collision frequency set to 1 ps−1. The simulation was carried out for 500 ns during which the SHAKE algorithm was applied to constrain all bonds involving hydrogen atoms. Two other replicates of the 500 ns simulation were performed instantiated with a different random number to bring the combined sampling time to 1.5 μs. Trajectory snapshots were saved at 10 ps intervals and used for downstream analysis. The combined trajectories from three simulations were used for the analysis.
CPPTRAJ software in AmberToolsCitation64 was used to analyze the trajectories. The FES in the space of ψ and ϕ dihedral angles were calculated from bin populations using Gi = -kB T ln(Ni/Nmax), where kB is Boltzmann’s constant, T is the temperature, Ni is the population of bin i and Nmax is the population of the most populated bin.
Bins with no population were given an artificial barrier equivalent to a population of 0.5. Solvent-accessible surface area was calculated using the MSMS packageCitation67 using a probe radius of 1.4 and triangle density of 3.
Advanced sampling using metadynamics
Metadynamics simulations were carried out using the GROMACS2018Citation68 MD engine patched to interface with PLUMED.Citation69 Metadynamics was performed in the well-temperedCitation50 scheme along the conformational space of ψ & χ angles, as collective variables, of the pentapeptide Ace-GGNAG-Nme. The choice of collective variables was based on the atoms connecting the dihedral angles that will affect the distance between n + 1 amide and the side-chain gamma carbon. The simulations used the same forcefield and MD parameters with 2 fs time steps. Bias was added at every 500 steps with a sigma of 0.1 and bias of 1.0 kcal/mol. The simulation was carried out for 1 μs and the trajectory was analyzed after unbiasing the simulation using the standard reweightingCitation70 procedure implemented in PLUMED. The free energy surface and corresponding distance distribution was plotted using matplotlib.
Abbreviations
QM – Quantum Mechanics
PTM – Post-translational modification
CST – Clinical stage therapeutics
CDR – Complementarity-determining regions
QMMM – Quantum mechanics molecular mechanics
KDE – Kernel density estimation
PDF – Probability density function
FES – Free energy surface
MD – Molecular Dynamics
MCC – Matthew’s correlation coefficient
CKS – Cohen’s Kappa score
Fab – Fragment-antigen binding domain
DFT – Density functional theory.
SQM – Semi-empirical quantum mechanics.
SASA – Solvent accessible surface area
Supporting information
The supporting information provides the proton affinity calculations and the corresponding KDE plots for DX and NX dipeptides using different QM models.
Contact
All correspondence and data requests should be directed to the corresponding author.
Supplemental Material
Download PDF (3.9 MB)Acknowledgments
The authors would like to thank Robert Kelly, Vikas Sharma and Sreedhara Alavattam for their engaging discussions. We would like to thank Benjamin Sellers for his valuable comments and suggestions on the manuscript.
Disclosure statement
FJI and SI are co-inventors on the provisional patent application describing the computational method discussed in the manuscript
Supplementary material
Supplemental data for this article can be accessed online at https://doi.org/10.1080/19420862.2022.2143006.
Additional information
Funding
References
- Jain T, Sun T, Durand S, Hall A, Houston NR, Nett JH, Sharkey B, Bobrowicz B, Caffry I, Yu Y, et al. Biophysical properties of the clinical-stage antibody landscape. Proc Natl Acad Sci U S A. 2017;114(5):944–14. doi:10.1073/pnas.1616408114.
- Raybould MIJ, Marks C, Krawczyk K, Taddese B, Nowak J, Lewis AP, Bujotzek A, Shi J, Deane CM. Five computational developability guidelines for therapeutic antibody profiling. Proc Natl Acad Sci U S A. 2019;116:4025–30. doi:10.1073/pnas.1810576116.
- Xu Y, Wang D, Mason B, Rossomando T, Li N, Liu D, Cheung JK, Xu W, Raghava S, Katiyar A, et al. Structure, heterogeneity and developability assessment of therapeutic antibodies. MAbs. 2019;11(2):239–64. doi:10.1080/19420862.2018.1553476.
- Robinson NE, Robinson AB. Deamidation of human proteins. Proc Natl Acad Sci U S A. 2001;98:12409–13. doi:10.1073/pnas.221463198.
- Walsh G, Jefferis R. Post-translational modifications in the context of therapeutic proteins. Nat Biotechnol. 2006;24:1241–52. doi:10.1038/nbt1252.
- Klimova N, Long A, Kristian T. Significance of Mitochondrial Protein Post-translational Modifications in Pathophysiology of Brain Injury. Transl Stroke Res. 2018;9:223–37. doi:10.1007/s12975-017-0569-8.
- Giles AR, Sims JJ, Turner KB, Govindasamy L, Alvira MR, Lock M, Wilson JM. Deamidation of Amino Acids on the Surface of Adeno-Associated Virus Capsids Leads to Charge Heterogeneity and Altered Vector Function. Mol Ther. 2018;26:2848–62. doi:10.1016/j.ymthe.2018.09.013.
- Jiskoot W, Randolph TW, Volkin DB, Middaugh CR, Schoneich C, Winter G, Friess W, Crommelin DJ, Carpenter JF. Protein instability and immunogenicity: roadblocks to clinical application of injectable protein delivery systems for sustained release. J Pharm Sci. 2012;101:946–54. doi:10.1002/jps.23018.
- Krause ME, Sahin E. Chemical and physical instabilities in manufacturing and storage of therapeutic proteins. Curr Opin Biotechnol. 2019;60:159–67. doi:10.1016/j.copbio.2019.01.014.
- Strader MB, Jana S, Meng F, Heaven MR, Shet AS, Thein SL, Alayash AI. Post-translational modification as a response to cellular stress induced by hemoglobin oxidation in sickle cell disease. Sci Rep. 2020;10:14218. doi:10.1038/s41598-020-71096-6.
- Zhu MM, Mollet M, Hubert RS, Kyung YS, Zhang GG. Industrial Production of Therapeutic Proteins: cell Lines, Cell Culture, and Purification. In: Kent JA, Bommaraju TV, Barnicki SD, editors. Handbook of Industrial Chemistry and Biotechnology. Cham: Springer International Publishing; 2017. p. 1639–69.
- Harris RJ, Kabakoff B, Macchi FD, Shen FJ, Kwong M, Andya JD, Shire SJ, Bjork N, Totpal K, Chen AB, et al. Identification of multiple sources of charge heterogeneity in a recombinant antibody. J Chromatogr B Biomed Sci Appl. 2001;752(2):233–45. doi:10.1016/S0378-4347(00)00548-X.
- Reer KJ, Aswad DW. Deamidation and isoaspartate formation in proteins: unwanted alterations or surreptitious signals? Cell Mol Life Sci. 2003;60:1281–95. doi:10.1007/s00018-003-2287-5.
- Patel CN, Bauer SP, Davies J, Durbin JD, Shiyanova TL, Zhang K, Tang JX. N+1 Engineering of an Aspartate Isomerization Hotspot in the Complementarity-Determining Region of a Monoclonal Antibody. J Pharm Sci. 2016;105:512–18. doi:10.1016/S0022-3549(15)00185-9.
- Salazar-Fontana LI, Desai DD, Khan TA, Pillutla RC, Prior S, Ramakrishnan R, Schneider J, Joseph A. Approaches to Mitigate the Unwanted Immunogenicity of Therapeutic Proteins during Drug Development. AAPS J. 2017;19:377–85. doi:10.1208/s12248-016-0030-z.
- Verma A, Burns DL. Improving the stability of recombinant anthrax protective antigen vaccine. Vaccine. 2018;36:6379–82. doi:10.1016/j.vaccine.2018.09.012.
- Jia L, Sun Y. Protein asparagine deamidation prediction based on structures with machine learning methods. PLoS One. 2017;12:e0181347. doi:10.1371/journal.pone.0181347.
- Lorenzo JR, Alonso LG, Sanchez IE. Prediction of Spontaneous Protein Deamidation from Sequence-Derived Secondary Structure and Intrinsic Disorder. PLoS One. 2015;10:e0145186. doi:10.1371/journal.pone.0145186.
- Robinson NE, Robinson AB. Prediction of protein deamidation rates from primary and three-dimensional structure. Proc Natl Acad Sci U S A. 2001;98:4367–72. doi:10.1073/pnas.071066498.
- Sydow JF, Lipsmeier F, Larraillet V, Hilger M, Mautz B, Molhoj M, Kuentzer J, Klostermann S, Schoch J, Voelger HR, et al. Structure-based prediction of asparagine and aspartate degradation sites in antibody variable regions. PLoS One. 2014;9(6):e100736. doi:10.1371/journal.pone.0100736.
- Robinson AB, Rudd CJ. Deamidation of Glutaminyl and Asparaginyl Residues in Peptides and Proteins. In: Horecker BL, Stadtman ER editors. Current Topics in Cellular Regulation. Academic Press; 1974. p. 247–95.
- Capasso S, Mazzarella L, Sica F, Zagari A. Deamidation via cyclic imide in asparaginyl peptides. Pept Res. 1989;2:195–200.
- Patel K, Borchardt RT. Chemical pathways of peptide degradation. II. Kinetics of deamidation of an asparaginyl residue in a model hexapeptide. Pharm Res. 1990;7:703–11. doi:10.1023/A:1015807303766.
- Tyler-Cross R, Schirch V. Effects of amino acid sequence, buffers, and ionic strength on the rate and mechanism of deamidation of asparagine residues in small peptides. J Biol Chem. 1991;266:22549–56. doi:10.1016/S0021-9258(18)54607-X.
- Capasso S, Mazzarella L, Sica F, Zagari A, Salvadori S. Kinetics and mechanism of succinimide ring formation in the deamidation process of asparagine residues. J Chem Soc Perkin Transactions. 2. 1993. 679–82. doi:10.1039/p29930000679
- Radkiewicz JL, Zipse H, Clarke S, Houk KN. Accelerated Racemization of Aspartic Acid and Asparagine Residues via Succinimide Intermediates: an ab Initio Theoretical Exploration of Mechanism. J Am Chem Soc. 1996;118:9148–55. doi:10.1021/ja953505b.
- Radkiewicz JL, Zipse H, Clarke S, Houk KN. Neighboring side chain effects on asparaginyl and aspartyl degradation: an ab initio study of the relationship between peptide conformation and backbone NH acidity. J Am Chem Soc. 2001;123:3499–506. doi:10.1021/ja0026814.
- Ritz-Timme S, Laumeier I, Collins MJ. Aspartic acid racemization: evidence for marked longevity of elastin in human skin. Br J Dermatol. 2003;149:951–59. doi:10.1111/j.1365-2133.2003.05618.x.
- Catak S, Monard G, Aviyente V, Ruiz-Lopez MF. Reaction mechanism of deamidation of asparaginyl residues in peptides: effect of solvent molecules. J Phys Chem A. 2006;110:8354–65. doi:10.1021/jp056991q.
- Catak S, Monard G, Aviyente V, Ruiz-Lopez MF. Deamidation of asparagine residues: direct hydrolysis versus succinimide-mediated deamidation mechanisms. J Phys Chem A. 2009;113:1111–20. doi:10.1021/jp808597v.
- Fogolari F, Esposito G, Viglino P, Briggs JM, McCammon JA. pKaShift Effects on Backbone Amide Base-Catalyzed Hydrogen Exchange Rates in Peptides. J Am Chem Soc. 1998;120:3735–38. doi:10.1021/ja963133m.
- Gamage CLD, Hageman TS, Weis DD. Rapid Prediction of Deamidation Rates of Proteins to Assess Their Long-Term Stability Using Hydrogen Exchange-Mass Spectrometry. J Pharm Sci. 2019;108:1964–72. doi:10.1016/j.xphs.2019.01.019.
- Robinson NE, Robinson ZW, Robinson BR, Robinson AL, Robinson JA, Robinson ML, Robinson AB. Structure-dependent nonenzymatic deamidation of glutaminyl and asparaginyl pentapeptides. J Pept Res. 2004;63:426–36. doi:10.1111/j.1399-3011.2004.00151.x.
- Lu X, Nobrega RP, Lynaugh H, Jain T, Barlow K, Boland T, Sivasubramanian A, Vasquez M, Xu Y. Deamidation and isomerization liability analysis of 131 clinical-stage antibodies. MAbs. 2019;11:45–57. doi:10.1080/19420862.2018.1548233.
- Oliva A, Henry B, Ruiz-López MF. Insights on peptide backbone N–H acidity: structure of anions, hydration effects. Chem Phys Lett. 2013;561-562:153–58. doi:10.1016/j.cplett.2013.01.040.
- Plotnikov NV, Singh SK, Rouse JC, Kumar S. Quantifying the Risks of Asparagine Deamidation and Aspartate Isomerization in Biopharmaceuticals by Computing Reaction Free-Energy Surfaces. J Phys Chem B. 2017;121:719–30. doi:10.1021/acs.jpcb.6b11614.
- Ugur I, Marion A, Aviyente V, Monard G. Why does Asn71 deamidate faster than Asn15 in the enzyme triosephosphate isomerase? Answers from microsecond molecular dynamics simulation and QM/MM free energy calculations. Biochemistry. 2015;54:1429–39. doi:10.1021/bi5008047.
- Delmar JA, Wang J, Choi SW, Martins JA, Mikhail JP. Machine Learning Enables Accurate Prediction of Asparagine Deamidation Probability and Rate. Mol Ther Methods Clin Dev. 2019;15:264–74. doi:10.1016/j.omtm.2019.09.008.
- Hamuro Y, SY E. Determination of Backbone Amide Hydrogen Exchange Rates of Cytochrome c Using Partially Scrambled Electron Transfer Dissociation Data. J Am Soc Mass Spectrom. 2018;29:989–1001. doi:10.1007/s13361-018-1892-3.
- Huang L, So PK, Yao ZP. Protein dynamics revealed by hydrogen/deuterium exchange mass spectrometry: correlation between experiments and simulation. Rapid Commun Mass Spectrom. 2019;33 Suppl 3:83–89. doi:10.1002/rcm.8307.
- Kosky AA, Razzaq UO, Treuheit MJ, Brems DN. The effects of alpha-helix on the stability of Asn residues: deamidation rates in peptides of varying helicity. Protein Sci. 1999;8:2519–23. doi:10.1110/ps.8.11.2519.
- Forood B, Feliciano EJ, Nambiar KP. Stabilization of alpha-helical structures in short peptides via end capping. Proc Natl Acad Sci U S A. 1993;90:838–42. doi:10.1073/pnas.90.3.838.
- Head-Gordon T, Head-Gordon M, Frisch MJ, Brooks C, Pople J. A theoretical study of alanine dipeptide and analogs. Int J Quantum Chem. 2009;36:311–22. doi:10.1002/qua.560360725.
- Diepold K, Bomans K, Wiedmann M, Zimmermann B, Petzold A, Schlothauer T, Mueller R, Moritz B, Stracke JO, Mølhøj M, et al. Simultaneous assessment of Asp isomerization and Asn deamidation in recombinant antibodies by LC-MS following incubation at elevated temperatures. PLoS One. 2012;7(1):e30295. doi:10.1371/journal.pone.0030295.
- Wakankar AA, Borchardt RT, Eigenbrot C, Shia S, Wang YJ, Shire SJ, Liu JL. Aspartate isomerization in the complementarity-determining regions of two closely related monoclonal antibodies. Biochemistry. 2007;46:1534–44. doi:10.1021/bi061500t.
- Yan B, Steen S, Hambly D, Valliere-Douglass J, Vanden Bos T, Smallwood S, Yates Z, Arroll T, Han Y, Gadgil H, et al. Succinimide formation at Asn 55 in the complementarity determining region of a recombinant monoclonal antibody IgG1 heavy chain. J Pharm Sci. 2009;98(10):3509–21. doi:10.1002/jps.21655.
- Pace AL, Wong RL, Zhang YT, Kao YH, Wang YJ. Asparagine deamidation dependence on buffer type, pH, and temperature. J Pharm Sci. 2013;102:1712–23. doi:10.1002/jps.23529.
- Sreedhara A, Cordoba A, Zhu Q, Kwong J, Liu J. Characterization of the isomerization products of aspartate residues at two different sites in a monoclonal antibody. Pharm Res. 2012;29:187–97. doi:10.1007/s11095-011-0534-2.
- Rehder DS, Chelius D, McAuley A, Dillon TM, Xiao G, Crouse-Zeineddini J, Vardanyan L, Perico N, Mukku V, Brems DN, et al. Isomerization of a single aspartyl residue of anti-epidermal growth factor receptor immunoglobulin gamma2 antibody highlights the role avidity plays in antibody activity. Biochemistry. 2008;47(8):2518–30. doi:10.1021/bi7018223.
- Barducci A, Bussi G, Parrinello M. Well-tempered metadynamics: a smoothly converging and tunable free-energy method. Phys Rev Lett. 2008;100:020603. doi:10.1103/PhysRevLett.100.020603.
- Knapp B, Ospina L, Deane CM. Avoiding False Positive Conclusions in Molecular Simulation: the Importance of Replicas. J Chem Theory Comput. 2018;14:6127–38. doi:10.1021/acs.jctc.8b00391.
- Frisch M, Trucks G, Schlegel H, Scuseria G, Robb M, Cheeseman J, Scalmani G, Barone V, Mennucci B, Petersson G. GAUSSIAN09. Wallingford (CT, USA): Gaussian Inc; 2009
- Stewart J. MOPAC2016; Stewart Computational Chemistry. Colorado Springs (CO): Google Scholar There is no corresponding record for this reference; 2016.
- Hostaš J, Řezáč J, Hobza P. On the performance of the semiempirical quantum mechanical PM6 and PM7 methods for noncovalent interactions. Chem Phys Lett. 2013;568:161–66. doi:10.1016/j.cplett.2013.02.069.
- Kromann JC, Christensen AS, Steinmann C, Korth M, Jensen JH. A third-generation dispersion and third-generation hydrogen bonding corrected PM6 method: PM6-D3H+. PeerJ. 2014;2:e449. doi:10.7717/peerj.449.
- O’Boyle NM, Banck M, James CA, Morley C, Vandermeersch T, Hutchison GR. Open Babel: an open chemical toolbox. J Cheminform. 2011;3:33. doi:10.1186/1758-2946-3-33.
- Ari N, Ustazhanov M. Matplotlib in python. 11th International Conference on Electronics, Computer and Computation (ICECCO): IEEE, 2014:1–6.
- Dunbar J, Krawczyk K, Leem J, Baker T, Fuchs A, Georges G, Shi J, Deane CM. SAbDab: the structural antibody database. Nucleic Acids Res. 2014;42:D1140–6. doi:10.1093/nar/gkt1043.
- Raybould MIJ, Marks C, Lewis AP, Shi J, Bujotzek A, Taddese B, Deane CM. Thera-SAbDab: the Therapeutic Structural Antibody Database. Nucleic Acids Res. 2020;48:D383–D8. doi:10.1093/nar/gkz827.
- Gowers RJ, Linke M, Barnoud J, Reddy TJE, Melo MN, Seyler SL, Domanski J, Dotson DL, Buchoux S, Kenney IM. MDAnalysis: a Python package for the rapid analysis of molecular dynamics simulations. Los Alamos National Lab.(LANL), Los Alamos, NM (United States); 2019.
- Nguyen H, Roe DR, Swails J, Case DA. PYTRAJ: interactive data analysis for molecular dynamics simulations. New Brunswick (NJ): Rutgers University; 2016.
- Pedregosa F, Varoquaux G, Gramfort A, Michel V, Thirion B, Grisel O, Blondel M, Prettenhofer P, Weiss R, Dubourg V. Scikit-learn: machine learning in Python. J Machine Learning Res. 2011;12:2825–30.
- Vilar S, Cozza G, Moro S. Medicinal chemistry and the molecular operating environment (MOE): application of QSAR and molecular docking to drug discovery. Curr Top Med Chem. 2008;8:1555–72. doi:10.2174/156802608786786624.
- Case DA, Berryman JT, Betz RM, Cerutti DS, Cheatham TE, Darden I, Duke TA, Giese RE, Gohlke TJ, Goetz H, et al. AMBER 2015. UCSF. 2015.
- Price DJ, Brooks CL. A modified TIP3P water potential for simulation with Ewald summation. J Chem Phys. 2004;121:10096–103. doi:10.1063/1.1808117.
- Hopkins CW, Le Grand S, Walker RC, Roitberg AE. Long-Time-Step Molecular Dynamics through Hydrogen Mass Repartitioning. J Chem Theory Comput. 2015;11:1864–74. doi:10.1021/ct5010406.
- Sanner MF, Olson AJ, Spehner JC. Reduced surface: an efficient way to compute molecular surfaces. Biopolymers. 1996;38:305–20. doi:10.1002/(SICI)1097-0282(199603)38:3<305::AID-BIP4>3.0.CO;2-Y.
- Abraham MJ, Murtola T, Schulz R, Páll S, Smith JC, Hess B, Lindahl E. GROMACS: high performance molecular simulations through multi-level parallelism from laptops to supercomputers. SoftwareX. 2015;1:19–25. doi:10.1016/j.softx.2015.06.001.
- Tribello GA, Bonomi M, Branduardi D, Camilloni C, Bussi G. PLUMED 2: new feathers for an old bird. Comput Phys Commun. 2014;185:604–13. doi:10.1016/j.cpc.2013.09.018.
- Bonomi M, Barducci A, Parrinello M. Reconstructing the equilibrium Boltzmann distribution from well-tempered metadynamics. J Comput Chem. 2009;30:1615–21. doi:10.1002/jcc.21305.