
Abstract
Advanced stop boxes (ASBs) (i.e., marked areas for cyclists in front of the stop line) are mentioned as a potential means to reducing the risk of crashes between cyclists and right-turning vehicles. This study estimates the safety effect of ASBs at signalised intersections using the log-odds method. Seven signalised intersections were filmed for 3,627 hours before and after constructing ASBs. Traffic conflicts were used as a surrogate for crashes. In total, the study found 644 traffic conflicts. The overall safety effect was not statistically significant: the conflict rate for right-hook conflicts decreased by 6% (p = 0.72), and for left-hook conflicts it increased by 21% (p = 0.26). The results differed at the seven sites, and there were only a few statistically significant results. At one site, the conflict rate of cyclists vs. right-turning vehicles decreased significantly, while it significantly increased at another site. One of the seven sites showed a significant increase in the conflict rate of cyclists vs. left-turning vehicles. A likely explanation is that few conflicts occur during the early green phase. In addition, the use rate of the ASB was low (0–2.7%).
1. Introduction
Cycling is a common mode of transport in Denmark, with 14% of all trips being carried out by bicycle (Danish National Travel Survey, Citation2018). There is a large variation in the bicycle share across the country, and particularly the large cities have high bicycle shares. For instance, approximately 29% of trips in Copenhagen are completed by bicycle (City of Copenhagen, Citation2017). Cyclists, however, are quite frequently involved in crashes. Statistics from Denmark show that cyclists’ risk of fatalities or severe injuries is approximately 17 times higher per kilometre compared to car drivers (Christiansen & Warneke, Citation2018).
For many years, road authorities have constructed bicycle paths to improve cyclist safety in urban areas. Although bicycle paths generally improve the overall safety of cyclists (Schepers, Twisk, Fishman, Fyhri, & Jensen, Citation2017), some studies showed an increased risk of cyclists at intersections with bicycle paths (Agerholm, Caspersen, & Lahrmann, Citation2008; Cicchino et al., Citation2020; Gårder, Leden, & Thedéen, Citation1994). The safety effect at intersections depends on their specific layout (Thomas & DeRobertis, Citation2013), and several previous studies have thus assessed various designs of geometric layouts and markings in terms of cyclist safety (e.g., Buch & Jensen, Citation2017; Herrstedt, Citation1979; Herrstedt et al., Citation1994; Jensen, Citation2008; Linderholm, Citation1992; Madsen & Lahrmann, Citation2017). However, the studies give no clear directions of how to design safe cyclist facilities at intersections, and there are still safety issues for cyclists at intersections (Danish Road Directorate, Citation2020). In Denmark (right-hand driving), the two most frequent registered types of cycling crashes are those at intersections involving either right-turning vehicles from the same direction as the cyclist (i.e., right-hook crashes) or left-turning vehicles from the opposite direction of the cyclist (i.e., left-hook crashes). These two crash types accounted for 15.8% and 11.1%, respectively, of all police-registered cycling crashes between 2014 and 2018 (Danish Road Directorate, Citation2020).
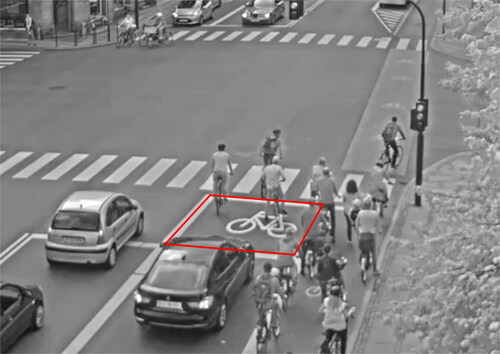
One of the safety measures implemented to improve cyclist safety at signalised intersections is advanced stop lines (i.e., moving the stop line for motorised vehicles back from the stop lines of cyclists). The empty space in front of the new stop line may be marked, e.g., by cyclist symbols or painted markings to highlight an advanced stop box (ASB) (). The main intention with the ASB is to allow cyclists to position in front of vehicles during the red-signal phase and thus cross the intersection in advance of the right-turning vehicles. ASBs can be used partly as a means of increasing cyclist flow and partly to improve cycling safety. The latter is done by physically separating cyclists from right-turning vehicles and by increasing cyclists’ conspicuity to left-turning vehicles from the opposite direction.
Figure 1. Advanced stop box (red marking). Cyclists use the ASB to position in front of vehicles during the red-signal phase.
ASBs have been used widely for decades, e.g., in the Netherlands (Schepers et al., Citation2017), the UK (Allen, Bygrave, & Harper, Citation2005; Ryley, Citation1996) and Sweden (SKL, Citation2009). The effect of ASBs on cyclist safety was assessed in several previous studies (Allen et al., Citation2005; Dill, Monsere, & McNeil, Citation2012; Hunter, Citation2000; Loskorn, Mills, Brady, Duthie, & Machemehl, Citation2013; Ohlms & Kweon, Citation2018; Wall, Davies, & Crabtree, Citation2003). In general, previous studies have been small, and most studies have thus not been able to find statistically significant effects due to a low number of crashes and traffic conflicts (Allen et al., Citation2005; Hunter, Citation2000; Loskorn et al., Citation2013). Some studies did not register any conflicts at all (Loskorn et al., Citation2013; Wall et al., Citation2003).
One study found a positive safety effect of ASBs: Dill et al. (Citation2012) studied the effect of ASBs in a before–after study and found a statistically insignificant decrease of 31% (29 conflicts before, 20 conflicts after) in the number of conflicts even though the number of cyclists and vehicles increased. After controlling for changes in exposure, they predicted that ASBs would lead to fewer conflicts. Conversely, Ohlms and Kweon (Citation2018) found a negative safety effect of ASBs: the conflict rates increased by 63% (p < 0.05) after constructing ASBs. However, further analysis showed significant differences in the number of registered conflicts across different observers, which may have influenced the results. As such, previous studies are ambiguous with regard to the effect of ASBs.
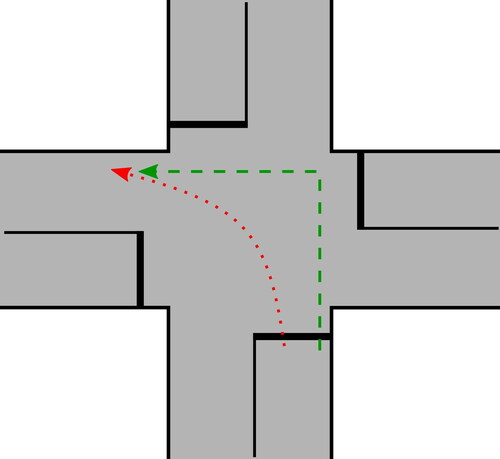
In Denmark, ASBs have generally not been used at signalised intersections. The traffic rules in Denmark state that cyclists are not permitted to use the ASB as a shortcut to perform a left turn in one movement like vehicles (), and ASBs may thus be of less interest for cyclists. However, due to ongoing issues with crashes between right-turning vehicles and cyclists continuing straight through the intersection, a large-scale implementation of ASBs was carried out in Denmark in 2016 (Danish National Police & Danish Transport Authority & Danish Road Directorate, Citation2014). This article evaluates the Danish large-scale implementation of ASBs by assessing the effect of ASBs on cyclists’ risk of being involved in traffic conflicts with turning vehicles.
Figure 2. Left turn. Cyclists in Denmark must do a two-stage left turn (green, dashed line) instead of turning like vehicles (red, dotted line).
2 Method
2.1. Study design
The effect of ASBs on cyclist safety was assessed in a before–after study. The study focussed on situations between cyclists passing through the intersection and motorised vehicles turning left and right. Situations with left-turning vehicles from the opposite direction were included to assess if the presence of an ASB influences situations with oncoming traffic (e.g., if drivers are more aware of crossing cyclists after creating the ASBs with additional cyclist markings). The study included situations regardless of whether the cyclist stopped inside the ASB before the incident, because the new markings from the ASBs can potentially make drivers more aware of the presence of cyclists, even those not using the ASB.
Since crashes are rare at any particular location (Danish Road Directorate, Citation2020), the assessment used the traffic conflict technique (Kraay, Citation1982) to identify traffic conflicts and compare conflict rates (conflicts per hour) before and after establishing an ASB. Studies have shown that traffic conflicts occur much more frequently than crashes, which thus allows for a faster evaluation of the effect than traditional crash analyses. Several studies from Scandinavia have shown that traffic conflicts occur a few times per day at a single site (Fyhri, Sundfør, Bjørnskau, & Laureshyn, Citation2017; Linderholm, Citation1992; Madsen & Lahrmann, Citation2017; Sakshaug, Laureshyn, Svensson, & Hydén, Citation2010), whereas crashes typically occur less than once per year at a single site (Danish Road Directorate, Citation2020).
2.2. Study sites
Seven signalised intersections were selected from a pool of 57 sites that were about to get ASBs established (Danish Road Directorate, Citation2018). The 57 sites all had in common that they were signalised intersections in urban areas, had existing bicycle paths or lanes, had a separate lane for right-turning traffic and did not have a protected right-turn phase (green arrow) ahead of circular green. Due to the practical implications of conducting traffic conflict studies, only a selection of all sites could be included in this study. Based on expected number of conflicts per day and considering the data collection, we decided to include six sites but added an extra site later on due to issues during data collection. The seven selected sites () were geographically distributed all over Denmark, located in cities of different sizes (medium, large, capital area) and with presumed varying traffic volumes. Other selection criteria were that the study sites had sufficient volumes of cyclists and turning vehicles, were suitable for setting up video cameras and were relatively ordinary with regard to geometry and traffic signals. For instance, signalised intersections usually have permissive left-turns (sites 1–7), sometimes followed by a protected left-turn phase (site 2). Four of the study sites had a bicycle path (i.e., with a curb to separate motor vehicles and cyclists) before the intersection, and three sites had a bicycle lane (i.e., a painted line to separate motor vehicles and cyclists) before the intersection. Cyclists used the ASBs only rarely at sites 1–4, but more at sites in the capital area (sites 5–7). The usage rates, measured as the share of cyclists that stopped inside the ASB during red lights at a random weekday, were highest at site 5 (2.7%) and lowest at site 4 (0.0%). illustrates the study sites before and after the establishment of the ASB.
Figure 3. Study sites. Intersections before and after ASBs were established.
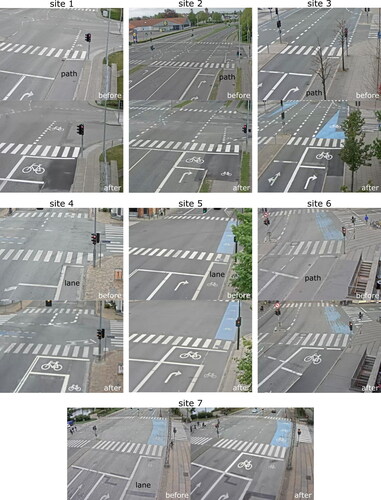
Table 1. Characteristics of the seven study sites. AADTs and ASB usage rates were estimated based on manual counts of a sample of the collected data.
2.3. Data collection
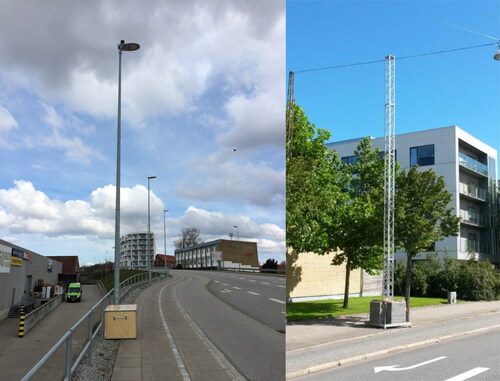
Video recordings were collected from each site using an RGB camera (640 × 480 pixels, 30 fps) that was mounted on a lighting pole (a portable pole for sites 3, 4, 6 and 7) near the intersection. The camera was placed as high as possible, typically 10 metres above the ground. A box on the ground containing four large car batteries provided power to the camera. The equipment used for collecting the video data is illustrated on .
Figure 4. Camera setup for collection of video footage. Existing lighting poles were used where possible (left). Alternatively, a mobile pole (right, sites 3, 4, 6 and 7) was used to ensure a good camera position.
The study was carried out May–November 2016 and collected video on weekdays (Monday–Friday) during the hours of 5:00–21:00 for four weeks before (before-period) and four weeks after (after-period) the ASB had been established. The after-period was filmed after an adjustment phase of at least two weeks to allow road users to get used to the new design. Unfortunately, the establishment of the ASB at site 6 was initiated during the filming of the before situation, which reduced the duration of the before-period. It was therefore decided to include an extra site (site 7), which was filmed in September and November 2016.
2.4. Data analysis
Traffic conflicts were identified from the recorded video by conducting video analysis in multiple steps ().
Figure 5. Procedure for data analysis. For an explanation of each step, see text.
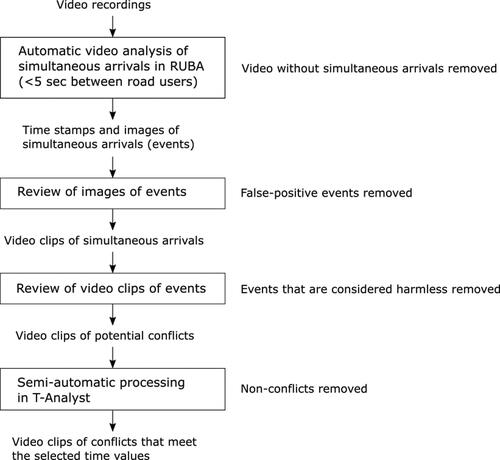
Initially, the video recordings were analysed using the video analysis tool RUBA (Road User Behaviour Analysis) (Bahnsen, Madsen, Jensen, Lahrmann, & Moeslund, Citation2018) to extract parts of the video with a cyclist and a turning vehicle being present at the same place at approximately the same time (). RUBA extracted events with up to five seconds between the cyclist and the turning vehicle arriving at the potential conflict point.
Figure 6. Detection of potential conflicts in RUBA. If both fields are triggered at approximately the same time, RUBA registers the situation as a potential conflict, subject to further analysis.
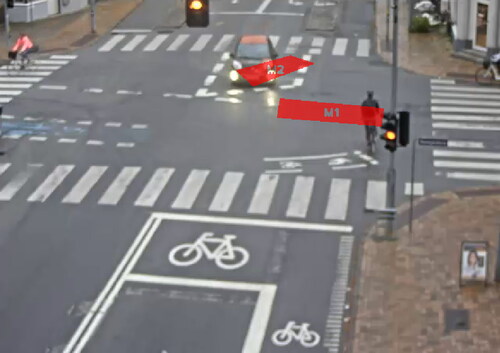
RUBA is sensitive to changes in the video image (e.g., changing light conditions, shadows, shaking leaves, etc.), and the extracted events were therefore assessed manually to remove any false-positive events. Events that did not show both a cyclist and a turning vehicle were removed from further analysis.
Only a small proportion of the same time arrivals implies an increased risk of a collision between the two road users. Therefore, video clips of the remaining events were examined manually to assess whether they were potential conflicts and thus were to be further analysed. Events were selected if at least one of the following criteria were met: (1) there was a short time gap between the cyclist and the vehicle, (2) there was a lack of obvious interaction between the cyclist and the vehicle and at least one of them performed an evasive manoeuvre (braked, swerved or accelerated) to avoid a collision and/or (3) the event looked dangerous and could potentially result in a collision in case of unexpected behaviour from involved road users.
The potential conflicts were processed in T-Analyst (Laureshyn, Citation2015), in which the trajectories of the road users were created manually by placing boxes around them on every fourth frame of the video (). Based on this, the software calculated the speed of the road users as well as a range of time-based indicators of the proximity of the road users.
Figure 7. Trajectories of road users involved in potential conflicts were created manually via T-Analyst.
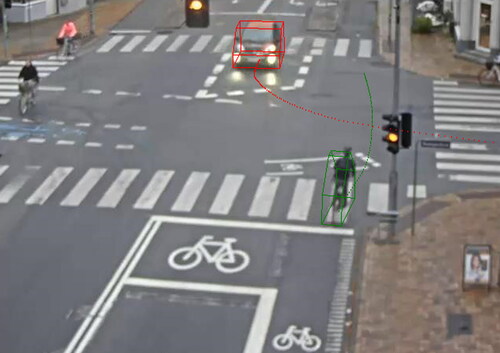
Like the approach by Madsen and Lahrmann (Citation2017), this study defined conflicts as situations with TTCmin ≤ 2.0 sec or T2,min ≤ 0.5 sec. The minimum time to collision (TTCmin) denotes the minimum time gap between two road users that approach each other. Values close to 0 suggest that the road users have been close to a collision. TTCmin can only be calculated if road users are on a collision course (i.e., they will collide if they continue at the same speed and direction). The minimum T2 value (T2,min) is used to include situations in which the two road users are not on a collision course. The T2 value describes the remaining time before the second road user arrives at the expected collision point and hence how much time the second road user has left to react to avoid a collision with the first road user (Laureshyn, Citation2010). The TTCmin and the T2,min were both extracted from T-Analyst.
2.5. Statistical analysis
This study estimated the conflict rate (CR) (i.e., the number of conflicts involving cyclists and turning vehicles per hour). The CR in the after-period was adjusted for changes in the bicycle volumes to account for variation during the year, based on data from permanent bicycle detectors (Danish Road Directorate, Citation2019). Vehicle flows were stable during the study period. The conflict rate was estimated before and after the establishment of the ASB, and the ratio between the two estimates, the conflict rate ratio (CRR), denotes the effect of the ASB. A CRR < 1 indicates that the ASB reduced the conflict rate, whereas a CRR > 1 indicates that the ASB resulted in more conflicts between cyclists and turning vehicles.
The overall effect of ASBs was estimated based on the CRR from each of the seven sites using the log-odds method (equivalent to Poisson regression) because data were not over-dispersed (Elvik, Høye, Vaa, & Sørensen, Citation2009). This method considers the varying number of conflicts per site and period (before and after) and the variation of the effect at each site. Depending on the effects at each site, the overall effect can be estimated using either the fixed-effect or the random-effects log-odds method. If the effects at individual sites are similar, documented by a chi-square test of homogeneity, the fixed-effect log-odds method can be used. Otherwise, the random-effects log-odds method must be used to account for the individual differences across various sites (Borenstein, Hedges, Higgins, & Rothstein, Citation2010).
3. Results
3.1. Conflicts between cyclists and turning vehicles
In total, the before-period covered 1,719 hours of video and the after-period 1,908 hours of video. During this time, 314 conflicts were registered before and 330 conflicts after establishing ASBs (). Among those 644 conflicts, four resulted in crashes (two before, two after). More conflicts were registered for right-turning vehicles than left-turning vehicles, but the number of conflicts per site varied between the two phases (before and after) and for the two conflict types.
Table 2. Number of conflicts, length of recordings per site and change in bicycle flows from before to after.
3.2. The effect of advanced stop boxes
The total effect of ASBs at the seven sites was initially estimated using a fixed-effect log-odds model. A chi-square test of homogeneity showed that the effects for conflicts between right-turning vehicles differed significantly across sites (p < 0.01), but no significant difference was found for conflicts involving left-turning vehicles (p = 0.16). Thus, we used the random-effects log-odds for conflicts involving right-turning vehicles and the fixed-effect log-odds for conflicts involving left-turning vehicles. The conflict rate decreased insignificantly by 6% (p = 0.72) for conflicts involving right-turning vehicles and increased insignificantly the occurrence of conflicts involving left-turning vehicles by 21% (p = 0.26) ().
Table 3. Conflict rates (CR) and conflict rate ratios (CRR), adjusted for changes in bicycle flows in the after-period, for conflicts between turning vehicles and cyclists. * denotes that the CRR differs significantly from 1 at the 5% level.
The effects for individual sites were ambiguous: at one site (6), the conflict rate between cyclists and right-turning vehicles decreased significantly after the establishment of the ASB. At one site (2), the conflict rate increased significantly. At the remaining five sites, the conflict rates either decreased (3, 4, 7) or increased (1, 5) insignificantly. One site (4) had a significant increase in the conflict rate between cyclists and left-turning vehicles.
4. Discussion
4.1. The effect of advanced stop boxes at signalised intersections
The overall results of the study showed no significant change in conflict rates for conflicts between cyclists and turning vehicles, while the results on individual sites were ambiguous. There can be several potential reasons for this, e.g.,: (1) the ASB has limited or no influence on the safety level, (2) the methodology used in the study is insufficient, (3) the safety effect differs from site to site due to site-specific factors, or (4) the advanced stop box is not used by cyclists.
The insignificant results could indicate no safety effect of an ASB on collisions between cyclists and turning vehicles. An explanation may be that conflicts rarely occur during the early green-signal phase when both road users have been to a standstill. Usually, they occur when the cyclist comes from behind and is overlooked by the right-turning motor vehicle, as documented by Buch and Jensen (Citation2017). In the present study, both road users had stopped on red-signal in only 1% of the conflicts. In 17% of the conflicts, the vehicle yielded for cyclists present when the traffic signal changed to green, but overlooked cyclists approaching from behind. The remaining conflicts either occurred when both road users arrived during the green-signal phase (75%) or when the cyclist crossed the intersection at yellow or red light (7%). Any observed effects may instead be due to changes in road markings, not the ASB itself. The lack of a safety effect is in line with conclusions from other studies (Allen et al., Citation2005; Hunter, Citation2000). Only Dill et al. (Citation2012) reported a safety effect of the ASB, while Ohlms and Kweon (Citation2018) found a negative safety effect. Despite statistically insignificant findings, the present study may still serve as input for a meta-analysis on the effect on ASBs as negative findings are necessary to avoid publication bias.
In total, we captured video for 3,627 hours (1,719 hours before and 1,908 hours after) and registered 644 traffic conflicts. Compared to other studies, this study was considerably larger in terms of the extent of the video footage and the number of registered conflicts. For instance, Allen et al. (Citation2005) collected video for 264 hours and registered 72 conflicts, and Dill et al. (Citation2012) registered 49 conflicts from 89 hours of video. Other studies have registered fewer conflicts and based their assessments on fewer hours of video footage (Hunter, Citation2000; Loskorn et al., Citation2013; Wall et al., Citation2003). Despite a much larger data sample, the present study still did not find significant results on the overall safety effect. While this strongly indicates that there is no clear safety effect of ASBs, it can also indicate that one month of data is not sufficient to document any safety effect. For instance, this could be the case if the random variation in the number of conflicts from week to week is so high that one month of data cannot sufficiently compensate for the variation. Another potential explanation could be inconsistencies when detecting conflicts, like in the study by Ohlms and Kweon (Citation2018).
The validity of a before-after study depends of on how well it controls for confounding factors (Elvik, Citation2002). In this study we sought accounting for this through the study design: using a short period of time between the before- and after-periods (i.e., few months), long observation periods per site and adjusting for seasonal variation to bicycle volumes. However, we did not include a comparison group without ASBs to control for other confounding factors and might not have sufficiently accounted for all confounders with the chosen study design. Additional adjustments for potential changes in traffic flows or simultaneous arrivals could be considered too. We opted for only adjusting for seasonal variation to bicycle flows because flow estimates from the video analysis tool were assessed to be too inaccurate, particularly due to issues with counting groups of cyclists. Similarly, the use of manual counts would introduce additional uncertainty when up-scaled based on a small sample.
The results vary greatly across the seven sites for both conflict types (). Some results suggest a risk reduction, while others suggest the opposite. This indicates that the effect differs remarkably depending on the characteristics of the site (geometry, surroundings, traffic composition, road markings). The same tendency was seen in studies of the effect of advanced stop lines: Linderholm (Citation1992) and Herrstedt et al. (Citation1994) both concluded that this measure could improve the safety of cyclists at signalised intersections. Conversely, Buch and Jensen (Citation2017) found that moving the stop line had mixed results depending on the size of the intersection. This variation across sites could also explain the differences between different studies of the safety effect of ASBs, including the observed safety effect in the study by Dill et al. (Citation2012). Ideally, the study would include considerably more than seven sites to address the great between-sites variation found in this study. Due to the nature of traffic conflict studies, which is still very time-consuming in terms of data collection and processing (Zheng, Sayed, & Mannering, Citation2021), the decision of including seven sites was a compromise between the number of sites, the observation time per site and limitations to how much data we could collect and process. Inclusion of more sites to reduce between-site variation also leads to shorter observation time per site (i.e., increase uncertainty due to random variation in daily conflict occurrence) and considerably more time and resources spent on data collection and processing.
4.2. Usage of advanced stop boxes
The intention of ASBs is to improve cyclists’ safety by placing them in front of the motor vehicles and letting them start crossing the intersection prior to the motor vehicles. This way, more cyclists cross the intersection in advance of right-turning vehicles and become more visible for left-turning vehicles. The prerequisite for any ASB to work is that it is used as intended. In this study, cyclists used the ASBs only rarely: an assessment of one day of video footage per site shows that use rates varied from 0–2.7% per site, with the highest use rates at sites with high bicycle flows (sites 5–7). Previous studies found a large variation in the usage of ASBs, and while some were used by more than a third of cyclists (Allen et al., Citation2005; Ryley, Citation1996), others were used by only 4–9% of cyclists (Dill et al., Citation2012; Loskorn et al., Citation2013; Ryley, Citation1996). The higher use rate of 9% in the study by Dill et al. (Citation2012) compared to the 0–2.7% in our study is a potential explanation for why they found a safety effect and we did not.
A possible explanation for the low use in this study compared to some previous studies is the use of the ASB and legislation: in Denmark, it is prohibited for cyclists to use the ASB as a shortcut to turn left in one movement like vehicles. This makes it less relevant for cyclists to use the ASB when turning left. In contrast, cyclists in the UK are allowed to turn right together with vehicles (Department for Transport, Citation2019). This may have contributed to the higher use rates in the studies by Allen et al. (Citation2005) and Ryley (Citation1996).
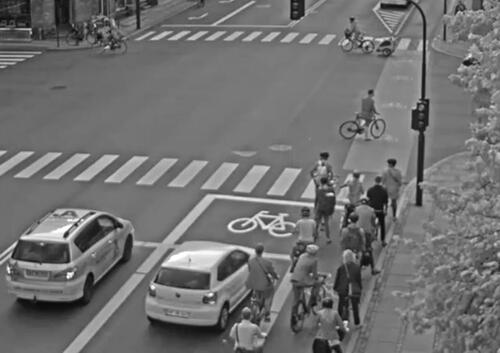
Another possible explanation for the low use of the ASB is that it may be difficult for cyclists to enter it if the route is blocked by first-arriving cyclists or vehicles (). Previous studies have shown that encroachment is a problem at many sites with ASBs: 15–52% of the first-arriving vehicles in the red-signal phase stop inside the ASB (Allen et al., Citation2005; Dill et al., Citation2012; Hunter, Citation2000; Koorey & Mangundu, Citation2010; Wall et al., Citation2003).
Figure 8. ASB not in use. Cyclists in the front block the entry to the ASB for the other cyclists.
4.3. The definition of conflict
In this study, conflicts were defined as situations with TTCmin ≤ 2.0 sec or T2,min ≤ 0.5 sec. It can be questioned whether this definition is suitable for selecting situations that are close enough to result in collisions. One of the main challenges of setting a threshold for traffic conflicts is that a too strict definition will potentially leave out real conflicts from the analysis. A less-strict conflict definition will likely include situations that are rather a sign of an effective traffic flow in which the road users pass each other with a small gap in a controlled manner (Madsen & Lahrmann, Citation2017).
Another challenge is the choice of indicators for identifying traffic conflicts. Currently, no existing time-based indicator, nor combinations of multiple time-based indicators, have been found suitable for capturing all relevant aspects of a traffic conflict (Johnsson, Laureshyn, & De Ceunynck, Citation2018). This is particularly the case for conflicts involving pedestrians or cyclists. Recent studies have therefore turned to probabilistic surrogate measures of safety to better predict motion changes and hence better safety estimates (Nabavi-Niaki, Saunier, & Miranda-Moreno, Citation2019). To include the severity of potential injuries in case of a crash, Laureshyn, De Ceunynck, Karlsson, Svensson, and Daniels (Citation2017) suggested using the Extended Delta-V as indicator for traffic conflicts. This indicator considers the speed and mass of the road users involved.
The main issue with the current approaches is that they usually focus on vehicle kinematics, but do not properly include behavioural factors (Zheng et al., Citation2021). An identification of traffic conflicts based on expert evaluations of potential conflicts could be used to include aspects that are not captured when using time-based indicators or probabilistic surrogate measures of safety, such as the age of the road users, the use of gestures, or turning the head to look for other road users. Unfortunately, the Delphi Method (Hsu & Sandford, Citation2007; von der Gracht, Citation2012) is very time-consuming and therefore not feasible for a study like this with more than a thousand situations of potential conflicts to assess. Alternatively, inclusion of behavioural factors can be achieved by assessing the infrastructure using a systems-based approach, such as applying the Cognitive Work Analysis framework to get a broader understanding of road users’ interaction with each other, the road infrastructure and the environment (Cornelissen, Salmon, Stanton, & McClure, Citation2015).
5. Conclusion
Cycling crashes result in a high number of injuries and fatalities each year in Denmark, and the risk is particularly high at intersections. To improve the safety of cyclists at signalised intersections, ASBs were established throughout Denmark. The present study describes a before-after evaluation of the ASBs. Seven intersections were filmed for two to four weeks to assess the safety effect (number of conflicts per hour) for cyclists. The study included 3,627 hours of video, resulting in the registration of 644 traffic conflicts between cyclists and turning vehicles. The overall effect of ASBs as estimated using a log-odds method turned out to be statistically insignificant. Concretely, the conflict rate decreased by 6% for conflicts between cyclists and right-turning vehicles (p = 0.72) and increased by 21% for conflicts between cyclists and left-turning vehicles (p = 0.26). However, the effect at the various sites differed remarkably and some sites did show a significant increase while others showed a significant decrease. The overall insignificant effect may thus be a sign that ASBs do not have a systematic safety effect. However, it should be noted that cyclists in general did not use the ASBs and that most conflicts do not occur during the early green-signal phase after both road users have stopped for red and ASBs can be used by cyclists.
Acknowledgements
The study was commissioned by the Danish Road Directorate and was carried out in close collaboration with six municipalities: Copenhagen, Frederiksberg, Hjørring, Kolding, Odense and Aalborg, that had ASBs installed in their intersections as part of the large-scale implementation. We would like to thank the reviewers of the International Cycling Safety Conference (ICSC) for valuable feedback during the preparation of the article.
Disclosure statement
No potential conflict of interest was reported by the authors.
References
- Agerholm, N., Caspersen, S., & Lahrmann, H. (2008). Traffic safety on bicycle paths: Results from a new large scale Danish study. Paper presented at International Cooperation on Theories and Concepts in Traffic Safety (ICTCT), Melbourne, Australia.
- Allen, D., Bygrave, S., & Harper, H. (2005). Behaviour at cycle advanced stop lines. Report No. PPR240. Wokingham: TRLS.
- Bahnsen, C. H., Madsen, T. K. O., Jensen, M. B., Lahrmann, H., & Moeslund, T. B. (2018). RUBA — Road user behaviour analysis. Aalborg University. Video analysis software, user manual and documentation. Retrieved from https://bitbucket.org/aauvap/ruba.
- Borenstein, M., Hedges, L. V., Higgins, J. P. T., & Rothstein, H. R. (2010). A basic introduction to fixed-effect and random-effects models for meta-analysis. Research Synthesis Methods, 1(2), 97–111. doi:10.1002/jrsm.12
- Buch, T. S., & Jensen, S. U. (2017). Incidents between straight-ahead cyclists and right-turning motor-vehicles at signalised junctions. Accident, Analysis and Prevention, 105, 44–51. doi:10.1016/j.aap.2016.07.035
- Christiansen, H., & Warneke, M. (2018). Risiko i trafikken 2007–2016 [Risk in traffic 2007–2016]. Transport DTU. Retrieved from https://backend.orbit.dtu.dk/ws/portalfiles/portal/146185353/Risiko_i_trafikken_2007_16.pdf.
- Cicchino, J. B., McCarthy, M. L., Newgard, C. D., Wall, S. P., DiMaggio, C. J., Kulie, P. E., Arnold, B. N., & Zuby, D. S. (2020). Not all protected bike lanes are the same: Infrastructure and risk of cyclist collisions and falls leading to emergency department visits in three U.S. cities. Accident Analysis & Prevention, 141, 105490. doi:10.1016/j.aap.2020.105490
- City of Copenhagen. (2017). Copenhagen city of cyclists — The bicycle account 2016. City of Copenhagen. Retrieved from https://bicycleinfrastructuremanuals.com/manuals4/CPH%20bicycle-account-2016.pdf.
- Cornelissen, M., Salmon, P. M., Stanton, N. A., & McClure, R. (2015). Assessing the 'system' in safe systems-based road designs: Using cognitive work analysis to evaluate intersection designs. Accident; Analysis and Prevention, 74, 324–338. doi:10.1016/j.aap.2013.10.002.
- Danish National Police, Danish Transport Authority & Danish Road Directorate. (2014). Strategy to prevent accidents between straight going cyclists and right turning lorries — Excerpts from the Danish strategy. Retrieved from https://www.trm.dk/media/3803/engelsk-hojresvingsstrategi-endelig-version.pdf.
- Danish National Travel Survey. (2018). The Danish national travel survey — Main results. Retrieved from https://www.cta.man.dtu.dk/english/tvu/hovedresultater.
- Danish Road Directorate. (2018). Cykelbokse [bike boxes]. Retrieved from http://www.vejdirektoratet.dk/DA/viden_og_data/temaer/trafiksikkerhed/Sider/Cykelbokse.aspx.
- Danish Road Directorate. (2019). Mastra database — Traffic counts. Retrieved from https://mastra.vd.dk/mastra/nytui/main/mastra.html.
- Danish Road Directorate. (2020). Accident data from the Danish national accident database VIS/vejman.dk. Retrieved from www.vejman.dk.
- Department for Transport. (2019). The highway code — Rules for cyclists (59 to 82). London: Department for Transport.
- Dill, J., Monsere, C. M., & McNeil, N. (2012). Evaluation of bike boxes at signalized intersections. Accident; Analysis and Prevention, 44(1), 126–134. doi:10.1016/j.aap.2010.10.030
- Elvik, R. (2002). The importance of confounding in observational before-and-after studies of road safety measures. Accident; Analysis and Prevention, 34(5), 631–635. doi:10.1016/S0001-4575(01)00062-8
- Elvik, R., Høye, A., Vaa, T., & Sørensen, M. (2009). The handbook of road safety measures (2nd ed.). London: Emerald Group Publishing Limited.
- Fyhri, A., Sundfør, H. B., Bjørnskau, T., & Laureshyn, A. (2017). Safety in numbers for cyclists-conclusions from a multidisciplinary study of seasonal change in interplay and conflicts. Accident; Analysis and Prevention, 105, 124–133. doi:10.1016/j.aap.2016.04.039
- Gårder, P., Leden, L., & Thedéen, T. (1994). Safety implications of bicycle paths at signalized intersections. Accident; Analysis and Prevention, 26(4), 429–439. doi:10.1016/0001-4575(94)90034-5
- Herrstedt, L. (1979). Sikkerhed for cyklister og knallertkørere på hovedfaerdselsårer i Københavnsområdet [The safety of cyclists and moped riders on main roads in the Greater Copenhagen area]. Notat 5/1979. Copenhagen: Rådet for trafiksikkerhedsforskning.
- Herrstedt, L., Nielsen, M. A., Agústsson, L., Lei, K. M., Jørgensen, E., & Jørgensen, N. O. (1994). Cyklisters sikkerhed i byer [Cyclist safety in urban areas]. Report 10. Copenhagen: Vejdirektoratet.
- Hsu, C., & Sandford, B. A. (2007). The Delphi technique: Making sense of consensus. Practical Assessment, Research & Evaluation, 12, 10.
- Hunter, W. W. (2000). Evaluation of an innovative application of the bike box. No. FHWA-RD-00-141.
- Jensen, S. U. (2008). Safety effects of blue cycle crossings: A before-after study. Accident; Analysis and Prevention, 40(2), 742–750. doi:10.1016/j.aap.2007.09.016
- Johnsson, C., Laureshyn, A., & De Ceunynck, T. (2018). In search of surrogate safety indicators for vulnerable road users: A review of surrogate safety indicators. Transport Reviews, 38(6), 765–785. doi:10.1080/01441647.2018.1442888
- Koorey, G., & Mangundu, E. (2010). Effects on motor vehicle behavior of color and width of bicycle facilities at signalized intersections. Transportation Research Record. Retrieved from https://ir.canterbury.ac.nz/handle/10092/3891.
- Kraay, J. H. (1982). Proceedings of the third international workshop on traffic conflicts technique. SWOV R-82-27. Leidschendam, The Netherlands: SWOV.
- Laureshyn, A. (2010). Application of automated video analysis to road user behaviour [Doctoral Thesis]. Lund: Lund University.
- Laureshyn, A. (2015). T-analyst. Lund: Lund University.
- Laureshyn, A., De Ceunynck, T., Karlsson, C., Svensson, Å., & Daniels, S. (2017). In search of the severity dimension of traffic events: Extended delta-V as a traffic conflict indicator. Accident; Analysis and Prevention, 98, 46–56. doi:10.1016/j.aap.2016.09.026
- Linderholm, L. (1992). Traffic safety evaluation of engineering measures — Development of a method and its application to how physical lay-outs influence bicyclists at signalized intersections. Lund: Lunds Institute of Technology. Department of Traffic Planning and Engineering.
- Loskorn, J., Mills, A. F., Brady, J. F., Duthie, J. C., & Machemehl, R. B. (2013). Effects of bicycle boxes on bicyclist and motorist behavior at intersections in Austin, Texas. Journal of Transportation Engineering, 139(10), 1039–1046. doi:10.1061/(ASCE)TE.1943-5436.0000584
- Madsen, T. K. O., & Lahrmann, H. S. (2017). Comparison of five bicycle facility designs in signalized intersections using traffic conflict studies. Transportation Research Part F: Traffic Psychology and Behaviour, 46(Part B), 438–450. doi:10.1016/j.trf.2016.05.008
- Nabavi-Niaki, M. S., Saunier, N., & Miranda-Moreno, L. F. (2019). Is that move safe? Case study of cyclist movements at intersections with cycling discontinuities. Accident Analysis & Prevention, 131, 239–247. doi:10.1016/j.aap.2019.07.006
- Ohlms, P. B., & Kweon, Y. (2018). Facilitating bicycle travel using innovative intersection pavement markings. Journal of Safety Research, 67, 173–182. doi:10.1016/j.jsr.2018.10.007
- Ryley, T. J. (1996). Advanced stop lines for cyclists: The role of central cycle lane approaches and signal timings. TRL report 181. Workingham, UK: Transport Research Laboratory.
- Sakshaug, L., Laureshyn, A., Svensson, Å., & Hydén, C. (2010). Cyclists in roundabouts — Different design solutions. Accident; Analysis and Prevention, 42(4), 1338–1351. doi:10.1016/j.aap.2010.02.015.
- Schepers, P., Twisk, D., Fishman, E., Fyhri, A., & Jensen, A. (2017). The Dutch road to a high level of cycling safety. Safety Science, 92, 264–273. doi:10.1016/j.ssci.2015.06.005
- SKL. (2009). Åtgärdskatalog för säker trafik i tätort [Solution catalogue for traffic safety in urban areas]. Sveriges Kommuner & Landsting. (in Swedish).
- Statistics Denmark. (2018). Population 1. January by urban, rural areas, age and sex. Retrieved from http://statbank.dk/by1
- Thomas, B., & DeRobertis, M. (2013). The safety of urban cycle tracks: A review of the literature. Accident; Analysis and Prevention, 52, 219–227. doi:10.1016/j.aap.2012.12.017
- von der Gracht, H. A. (2012). Consensus measurement in Delphi studies — Review and implications for future quality assurance. Technological Forecasting and Social Change, 79(8), 1525–1536. doi:10.1016/j.techfore.2012.04.013
- Wall, G. T., Davies, D. G., & Crabtree, M. (2003). Capacity implications of advanced stop lines for cyclists. TRL 585. Workingham, UK: Transport Research Laboratory.
- Zheng, L., Sayed, T., & Mannering, F. (2021). Modeling traffic conflicts for use in road safety analysis: A review of analytic methods and furture directions. Analytic Methods in Accident Research , 29, 100142. doi:10.1016/j.amar.2020.100142