
ABSTRACT
The aim of this study was to assess levels of dioxins (polychlorinated dibenzo-p-dioxins and dibenzofurans, PCDD/Fs) and dioxin-like polychlorinated biphenyls (PCBs) (DL-PCBs) in food of animal origin produced in the Netherlands, including potential trends in time. Test results from about 2500 samples of animal derived food products (beef, veal, lamb, chicken, pork, deer, milk and eggs), sampled for the National Residue Monitoring Plan from 2001–2011, were evaluated. Most samples were screened with a bioassay and, if suspected, analysed by GC-HRMS. The fraction of samples which were non-compliant with European maximum levels was rather low, being below 1% for most food products, except for lamb. Exceedance of action levels was particularly observed for lamb and beef. To obtain an insight into background levels, a randomly taken part of the samples was directly analysed by GC-HRMS. In general, only minor decreases in mean PCDD/F and DL-PCB concentrations could be observed for the period 2001–2011. This may be due to a plateauing of current background levels but also to factors like the sensitivity of the analytical method.
Introduction
Dioxins (polychlorinated dibenzo-p-dioxins and dibenzofurans, PCDD/Fs) and dioxin-like polychlorinated biphenyl (DL-PCBs) remain a threat to the food chain, as can be concluded from the various incidents with feed and food during the past decades (Malisch & Kotz Citation2014; Hoogenboom, Traag, et al. Citation2015). In the Netherlands, this episode started at the end of the 1980s, when PCDD/Fs were found to contaminate the local environment, e.g. through emissions from certain industries and municipal waste incinerators to water and air (Liem et al. Citation1991). A second phase started more or less with the discovery of elevated levels of PCDD/Fs in milk due to contaminated citrus pulp pellets, imported from Brazil in 1997/1998 (Malisch Citation2000), and the Belgian incident in 1999 with various types of contaminated animal derived products due to chicken and pig feed containing PCB oil (Bernard et al. Citation1999; Van Larebeke et al. Citation2001). The subsequent increase in reported incidents is likely to be related to the EU policy to reduce the exposure of consumers by setting food and feed limits, and the related increase in monitoring and control, one of the consequences of the Belgian incident.
PCDD/Fs and DL-PCBs are a group of persistent chemicals, which can accumulate in human and animal tissues due to their lipophilic nature and resistance to metabolic degradation. This group concerns 17 out of 210 PCDD/Fs and 12 out of 209 PCBs. Exposure to these contaminants can result in a wide range of adverse effects, including disturbance of the reproductive and immune system, and cancer (WHO Citation2000, SCF Citation2001). To prevent levels in the human body exceeding a critical concentration, the Scientific Committee on Food (SCF Citation2001) determined a tolerable weekly intake (TWI) of 14 pg toxic equivalents (TEQ) kg–1 body weight per week, based on effects of the most toxic dioxin, 2,3,7,8-tetrachlorodibenzo-p-dioxin (TCDD) in rats, taking into account differences in kinetics between rats and humans. More recently, the US Environmental Protection Agency (EPA Citation2012) derived an oral reference dose (RfD) of 0.7 pg kg–1 body weight per day based on the outcome of two epidemiological cohort studies from victims of the Seveso incident. One study showed decreased sperm concentrations and sperm motility in exposed boys (Mocarelli et al. Citation2008), the other one increased blood levels of thyroid-stimulating hormone in children exposed in utero (Baccarelli et al. Citation2008).
Based on numerous studies (see e.g. Liem et al. Citation2000; EFSA Citation2012), the main foods contributing to the current exposure of the European population are fatty fish, meat and meat products, as well as milk and dairy products. Depending on the population group, the percentage of individuals exceeding the TWI was estimated to be between 1.0% and 26.2%. These findings confirm studies from individual European countries (FSA Citation2003; Kiviranta et al. Citation2004; Fattore et al. Citation2006; Weijs et al. Citation2006; Tard et al. Citation2007; Bergkvist et al. Citation2008; De Mul et al. Citation2008; Windal et al. Citation2010; Marin et al. Citation2011; Törnkvist et al. Citation2011; Perelló et al. Citation2012; Sirot et al. Citation2012), showing that the margin between the actual exposure and the health based guidance value is still very small and non-existing for part of the population.
This supports the EU policy to protect public health in Europe by setting maximum levels (MLs). To avoid a major part of the food being non-compliant and consequently needing to be destroyed MLs are established using an ALARA-like principle, ‘strict but feasible’, by setting limits on the basis of levels of contaminants in food and feed produced using good agricultural practices (GAP), in practice around the 90th to 95th percentile of the distributions from data obtained from member states. This implies that the MLs are not safety based, which is evident when calculating, for example, the exposure resulting from regular consumption of fish contaminated at the ML. The EU strategy should result in withdrawal of the most contaminated products from the market and tracing and removal of remaining sources. The resulting decrease in levels of PCDD/Fs and PCBs should then allow a further reduction of the MLs within a number of years (EC Citation2006d). To speed up this process, in the case of food the European Commission recommended also the use of action levels (ALs), roughly around 2/3 of the ML (EC Citation2001, EC Citation2011a). If these ALs are exceeded, the food product can still be traded, but action should be taken to disclose and remove the source. Based on the available information, MLs were first established for PCDD/Fs only (July 2002), and later extended to the sum of PCDD/Fs and DL-PCBs (November 2006, EC Citation2006d), while maintaining the MLs for PCDD/Fs. ALs were established for both PCDD/Fs and DL-PCBs, but not for the sum (see Table S1, supplementary files).
Just after the above-mentioned Belgian incident in 1999, the Netherlands established a monitoring programme for PCDD/Fs in animal derived food, aiming at analysing about 200–300 samples per year. Both a screening method (DR CALUX assay) and GC-HRMS were applied, and both were able to detect DL-PCBs from the start. The aim of the present study is to review the results from this programme by (1) gaining insight in the fraction of samples exceeding MLs and ALs; (2) reviewing the background levels of PCDD/Fs and DL-PCBs in Dutch food products of animal origin; and (3) evaluate potential time trends. To this end, data from the monitoring programme were used, covering the period 2001–2011, i.e. before the change of the MLs and switch to the toxic equivalency factors determined by the World Health organisation in 2005 (WHO-TEF500) (for TEFs see Expression of results in the next section).
Materials and methods
Data collection
Samples were obtained from the National Residue Monitoring Plan (Council Directive 96/23/EC, EC Citation1996), which, in addition to hormones and organochlorine pesticides, does include indicator PCBs but not PCDD/Fs and DL-PCBs. Although sampling should be risk-based for the target contaminants, this does not apply for PCDD/Fs and PCBs. All monitoring samples were taken at farms or slaughterhouses. During 10 years (2001–2011, except 2003 when no samples were analysed for PCDD/Fs and DL-PCBs), a total of 2475 animal derived food samples (meat, liver, eggs and milk) were tested. Most samples were first screened with the DR CALUX® bioassay and, if found suspected to be non-compliant, also analysed with GC-HRMS (n = 188). Samples exceeding the ML were reported to the authorities. In accordance with Commission Directive 2002/69/EC (EC Citation2002) and later Commission Regulation (EC) number 1883/2006 (EC Citation2006c), 2–10% of the samples that tested negative in the bioassay were also analysed with GC-HRMS to check for false-compliant results. At a later stage the EU-monitoring samples (see below) were used for this purpose.
In order to obtain more insight in the background levels, pooled quarterly (PQ) samples were prepared by mixing (pooling) all samples per food item for every quarter of the year. This was done in the period from 2001 to 2009. These pooled samples were analysed by GC-HRMS (in total 326 pooled samples, corresponding to 1794 individual samples). In addition, since 2004, randomly picked individual samples (n = 524) were analysed directly by GC-HRMS in line with Commission Recommendations 2004/705/EC and 2006/794/EC (EC Citation2004, Citation2006a), hereafter called EU monitoring samples. In this way, since 2004, on average 45 samples and, since 2007, 72 samples were analysed annually in a non-targeted way. Many of these samples are included in the 2475 samples tested with the bioassay, since they were also used to examine the performance of the screening assay. Analytical results from both the PQ samples and the EU monitoring samples were used in the statistical analysis and were compared to each other to obtain a clear view on the Dutch background levels and potential time trends therein.
Screening method
The DR CALUX bioassay was carried out according to an accredited method as described previously (Bovee et al. Citation1998; Hoogenboom et al. Citation2004, Citation2007). The test applied at RIKILT is using the original 1.1 pGudLuc transfected rat hepatoma cells, which show an increased production of luciferase in response to dioxin-like compounds, triggered by activation of the arylhydrocarbon receptor pathway. In short, fat is extracted from the samples and subsequently 0.5 g is cleaned up over an acid silica column to remove the fat. From 2002, for pig fat samples an amount of 2 g was pretreated overnight with H2SO4 before clean-up on acid silica columns, since a larger sample intake was required to meet the lower MLs (Hoogenboom et al. Citation2004). The hexane/diethyl ether (97/3 v/v) eluate was evaporated in the presence of a small amount of DMSO (keeper) and mixed with the culture medium used to expose the rat hepatoma H4IIE-cells (obtained from Wageningen University, but similar to the cells marketed by BDS, Amsterdam).
In each test series of up to 20 samples, a set of reference samples was included and used to determine whether the test sample was compliant or suspected to be non-compliant. The response of the test sample was compared with that of the appropriate reference sample (so-called screening approach in Commission Directive 2002/69/EC (EC Citation2002)). The reference samples were butter fat samples spiked with a mixture of PCDD/Fs and DL-PCBs at levels around the ML, as confirmed by GC-HRMS (Hoogenboom et al. Citation2004). A conservative decision limit was used to avoid false-compliant test results. Since the PCDD/Fs and DL-PCBs were not separated in the clean-up, for most products the AL for PCDD/Fs was used initially, but since the end of 2006 for most matrices the AL for DL-PCBs was used, being lower than that for PCDD/Fs (see Table S1, supplementary files for the regulatory limits and the reference samples used for each matrix). So even though the DL-PCBs were only included in the legislation since November 2006, before that date low decision limits were also used since the test response could be entirely due to PCDD/Fs in the sample extracts. In practice, the concentration of the reference sample used for comparison and as decision limit was 0.9 pg TEQWHO1998 g−1 for ruminant and poultry meat, 0.5 pg TEQWHO1998 g−1 for pork meat and 1.9 pg TEQWHO1998 g−1 for milk and eggs (upperbound levels determined by GC-HRMS). Samples showing a higher response than the reference sample were classified as suspected and subsequently analysed by GC-HRMS. The rather low decision limits also allowed detection of most samples exceeding the ALs. As for GC-HRMS, RIKILT participates twice per year in the proficiency test (PT) tests organised by the EURL in Germany with good performance, including the correct classification of the samples.
Confirmatory method
GC-HRMS analysis was carried out as described previously (Tuinstra et al. Citation1994), but since the end of 2005 the clean-up by GPC, alumina and active carbon was replaced by an automated system (Power-Prep™, Fluid Management Systems Inc., Waltham, MA, USA) as described by Hoogenboom et al. (Citation2007). Analysis by GC-HRMS was performed on an Agilent HP6890+GC mounted on a HRMS system from Autospec, Ultima system (Micromass, Manchester, UK). For GC-HRMS, non-compliance is reported when the analytical result exceeds the ML taking into account an expanded measurement uncertainty of 10%. In practice, for a sample to be declared non-compliant, the measured level minus the uncertainty must be above the ML. The same accounts for the AL. RIKILT participates in the PT tests organised by the EURL in Germany and those by Folkehelse (Norway) and FAPAS (UK). In addition a butter fat sample originating from the contamination near a waste incinerator in the early 1990s is routinely analysed in each test series to control the long-term performance.
Expression of results
Samples were grouped into the following food categories and food products: meat and meat products (beef, chicken, pork, lamb and veal), milk and eggs, as based on the regulatory limits (Regulation (EC) number 1881/2006, EC Citation2006b and Regulation (EU) number 1259/2011, EC Citation2011b).
The upper bound limit was used for all samples tested with GC-HRMS and is based on the assumption that the level of non-detected congeners is equal to the limit of quantification (LOQ). Both the WHO-TEF1998 (Van den Berg et al. Citation1998) and WHO-TEF2005 (Van den Berg et al. Citation2006) values were applied, the latter for comparison with European Food Safety Authority (EFSA) data (EFSA Citation2010, Citation2012). The TEFs are the factors that are applied to correct the absolute level of each relevant PCDD/F and DL-PCB for its relative toxic potency as compared to the most toxic congener, TCDD. The GC-HRMS determined concentration (or LOQ) for each congener was multiplied with the specific TEF for that congener and summed to a total toxic equivalent (TEQ) concentration per sample. Following EC legislation, the WHO-TEFs1998 were applied until the end of 2011 to check compliance of the samples with the MLs. Since 2012, regulatory limits are based on the new WHO-TEF2005 according to Commission Regulation (EU) No 1259/2011 (EC Citation2011b).
To account for the effect of the number of samples within each pooled sample, the average value of the PQ samples per food product was calculated as follows:
In which: avg = average concentration of PCDD/Fs, DL-PCBs or sum of PCDD/Fs and DL-PCBs per food product (i); coni = concentration measured in a pooled sample; ni = number of samples used within the pooled quarterly sample.
Statistical analysis
Descriptive analysis was used to calculate averages (avg), medians (P50) and 95th (P95) percentiles of PCDD/F and DL-PCB concentrations per food group. This was performed for both upper and lower bound values.
Variability graphs per year were used to display the margin between average upper and lower bound levels for each food product, as well as the highest/lowest values per year. These graphs illustrate the change over time. As PCDD/Fs and DL-PCBs are usually present in low concentrations and an asymmetric distribution was expected, in addition to the Pearson correlation coefficient (MS Excel®), also the non-parametric statistical Mann–Kendall test was used to evaluate the significance of potential trends. The template MAKESENS (Salmi et al. Citation2002) was used to calculate a significance value for the annual median and average PCDD/F and DL-PCB concentration per food product. Average and P95 PCDD/F and DL-PCB concentrations were compared to the European data presented by EFSA (Citation2010), as these were used to establish the new regulatory limits which came into force in 2012 (Commission Regulation (EU) No 1259/2011 (EC Citation2011b)).
Results and discussion
The present paper evaluates the monitoring data on PCDD/Fs and DL-PCBs in products of animal origin, covering the period between 2001 and 2011. This period started just after the Belgian dioxin incident and ended with the adaptation of the limits in 2012, which were intended to be lower than the old limits following the reduction of levels as a result of the legislative measures (EC Citation2001). During this period, the DR CALUX assay was applied without major changes in the approach, which was also changed in 2012. The use of a screening method, compliance and background levels (as compared to those reported by EFSA for the EU), as well as potential trends in the levels will be presented and discussed below, the latter including the effect of the LOQ of the confirmatory method on both lower and upper bound levels.
Application of the bioassay for screening
In the period 2001–2011, RIKILT applied the DR CALUX® assay using the so-called screening approach, meaning that the response of samples was compared with that of a reference sample around the required decision limit, rather than estimating the level based on a TCDD calibration curve (EC Citation2002). The use of a screening method in combination with a confirmatory (GC-HRMS) method allows larger numbers of samples to be tested at lower costs, thus increasing the chance to detect non-compliant samples and new sources of contamination. During the period 2001–2011, there were a number of changes in the regulatory limits, starting with the introduction of MLs and ALs for PCDD/Fs in July 2002 and subsequently an additional ML for the sum of PCDD/Fs and dl-PCBs, and an AL for dl-PCBs in November 2006 (see supplementary files, Table S1). During the first 18 months, a limit of 5 pg TEQ g−1 fat was applied for all products. In the bioassay, to decide over compliance, the response obtained with the test sample was compared with that of a reference sample with a level around the decision limit, after July 2002 being the AL for PCDD/Fs. Some adjustments were made in November 2006, as also shown in Table S1. Thus, the application of higher decision limits during the first 18 months could have resulted in compliant samples that after the introduction of the EU limits in 2002 and later 2006, would have been non-compliant. However, the inclusion of additional reference samples with lower levels in the first years allowed a rough evaluation and, as shown in Table S1 (footnotes), this potential problem applied only to a limited number of samples. Therefore, it was decided to include this period of 18 months in the evaluation.
In the DR CALUX bioassay, the fraction of suspected samples in this period varied per food category and was 8.5% for beef, 4.5% for veal, 41.6% for sheep, 1.3% for pork, 1.1% for chicken, 13.5% for eggs and 1.2% for milk. In addition 38 samples of fat from deer were tested using the same decision limit as for ruminants and 95% of these tested suspected.
Suspected samples and part of the negative samples were investigated with GC-HRMS. This allowed an evaluation of the overall performance of the bioassay and the use of the rather conservative decision limits. The relatively high levels in sheep allow the best evaluation of the test performance, using the limits introduced in 2006 (including DL-PCBs). Out of 173 samples screened with the bioassay, 72 showed a suspected result. Of the 90 negative samples 35 were also analysed by GC-HRMS with none of the samples exceeding the MLs but three the AL for DL-PCBs (in years before 2006 when these compounds were included). A total of 40 of the 72 suspected samples (56%) exceeded the ALs and three (4%) the MLs, meaning that 32 samples tested false-positive. However, 31 of these samples exceeded the decision limit of 0.9 pg TEQ g−1 fat applied during this period for sheep meat in the bioassay.
In fact all 11 non-compliant samples were first detected with the bioassay, and none in the samples measured directly with GC-HRMS (EU-monitoring programme).
In general only a small fraction of the samples tested as suspected, despite the rather conservative decision limits applied for the screening. However, most of the suspected samples were false-positives. The high number of false-positive samples of sheep fat is related to the relatively high levels in these products, many being close to the action level. The doubling of the action level for DL-PCBs in ruminants in 2012 allowed a higher decision limit and resulted in much lower numbers of suspected samples. For other matrices, like milk and pork fat, the number of suspected samples was rather low. For such matrices, the screening eliminates all samples with levels far below the LOQ of the confirmatory method (see below). Another major advantage of applying a bioassay is that it would also detect high levels of other dioxin-like compounds, like brominated or mixed bromo-chlorodioxins. However, no indications were obtained for such cases in the animal derived food samples described in this paper, contrary to the feed ingredient choline chloride (Traag et al. Citation2009).
Fraction of samples exceeding the MLs
During the period 2001–2011, a total of 2354 samples of meat (fat), milk and eggs were screened by DR CALUX® and, if suspected to be non-compliant, also by GC-HRMS. In addition, 524 ‘EU monitoring’ samples were directly analysed with GC-HRMS, most but not all of these in parallel with the bioassay (quality control of the bioassay). This amounted to a total of 2437 samples, and in addition 38 samples of deer fat. The result obtained by GC-HRMS was decisive on whether samples exceeded the MLs () or ALs (), i.e. those that were applied since November 2006 until 2012 (Regulation (EC) No 1881/2006) and which were based on the use of WHO-TEFs from 1998. In agreement with EU-Regulations, the measurement uncertainty of GC-HRMS (10% at RIKILT) was taken into account before concluding that the sample exceeded the MLs or ALs. So, although DL-PCBs were only included at the end of 2006, also test results from 2001–2006 were compared to the ALs and MLs for both PCDD/Fs and/or DL-PCBs.
Table 1. Number of meat, milk and eggs samples tested (ntotal) and numbers (n) exceeding one or both maximum levels (MLs) for PCDD/Fs or the sum of PCDD/Fs and DL-PCBs, according to 1881/2006/EC (expressed as pg TEQWHO1998 g−1 fat).
Table 2. Number of meat, milk and eggs samples tested (ntotal) and numbers exceeding one or both action levels (AL) for PCDD/Fs or DL-PCBs according to 2006/794/EC (expressed as pg TEQWHO1998 g−1 fat).
As shown in , four out of the 1610 meat (fat) samples exceeded the ML for PCDD/Fs and five the ML for the sum of PCDD/Fs and DL-PCBs. Most but not all of these samples exceeded both MLs. Combined, six meat samples exceeded either one or both MLs (0.4% of the samples), of which two were sheep liver samples and four were samples of sheep fat, the latter representing 2.3% of the tested sheep meat samples. None of the 335 milk samples, collected at individual farms, exceeded either one of the MLs. However, five out of the 492 (1.0%) egg samples exceeded one or both MLs. These samples were all derived from organic farms, showing levels up to twice the MLs. The first case in 2001 actually resulted in various follow-up studies to reveal the source and potential measures to reduce the levels (Traag et al. Citation2002; Kijlstra et al. Citation2007), most cases being related to ingestion of soil. In one case the increased level was caused by contaminated feed due to the use of corn with increased PCDD/F levels (RASFF Citation2010; Traag et al. Citation2010a). The increased self-regulation by egg producers resulted in the discovery and elimination of some additional sources and in general these eggs nowadays contain levels well below the limits.
It can be concluded that the fraction of non-compliant samples was rather low, being 0% for beef, chicken, pork, veal and milk and 5.0, 2.3 and 1.0% for respectively liver, sheep fat and eggs (). This was somewhat unexpected since regulatory limits for PCDD/Fs and DL-PCBs are based on the principle ‘strict but feasible’, being achieved by setting limits on the basis of measured levels such that around 5–10% of a certain food product should exceed the limit. In this study for all food products the percentage of non-compliance with MLs was only 0.5%, indicating that at least in the Netherlands the MLs used until 2012 were not a real incentive for further reduction of the levels. A possible explanation is the increased focus on these contaminants in the Netherlands following their discovery in milk in the late 1980s. Also incidents like the one with citrus pulp (1998), the one in Belgium (1999) and the discovery that certain clay materials applied in feed production could contain high PCDD/F levels as discussed above (Hoogenboom, Traag, et al. Citation2015) resulted in removal of some sources and increased awareness some years before the start of the routine monitoring of food and feed in the Netherlands in 2001. The MLs set by the EU in 2002 and 2006 were derived from datasets obtained from various EU member states, based on samples collected many years before and analysed by different laboratories before harmonisation of performance criteria for analytical methods. So it might be possible that the levels in food and feed in the Netherlands were already low in comparison with those reported by other member states of the EU.
Another possible explanation for the low fraction of non-compliant samples is the application of measurement uncertainty in judging the compliance of samples. In practice this means that measured levels are first decreased by this expanded measurement uncertainty, being e.g. 10% at RIKILT, before being compared with the maximum (or action) levels. In practice this means a potential decrease of the fraction of non-compliant results. This was investigated in combination with the effect of the new 2012 maximum levels and use of WHO-TEFs2005 on the dataset (Table S2). When applying the new MLs of 2012, the fraction of non-compliant samples did not increase, still being 0.5%. This confirms that these new MLs were effectively not really lower but only compensated for applying the new TEFs, known to result in a decrease in the TEQ levels. Not applying measurement uncertainty resulted in only a slight increase of the fraction of non-compliant samples, from 0.5 to 0.6%. So the application of measurement uncertainty had no major impact.
Fraction of samples exceeding the ALs
In addition to MLs, the EU also established ALs. Samples exceeding these ALs may be followed up by additional research to discover the source of the contamination. As shown in , in the case of meat products, 81 samples (4.9%) exceeded one or both ALs, in most cases the AL for DL-PCBs (PCDD/Fs: n = 30, DL-PCBs: n = 75, both ALs: n = 24 (not shown)). Most of the samples exceeding the ALs were sheep fat samples, which in 25.4% (n = 45) of the cases exceeded the AL(s). Also samples from fat of cows regularly exceeded the AL(s) (n = 27, 9.3%). None of the milk samples exceeded the AL(s). In the case of eggs, seven samples (1.4%) exceeded the AL(s), two more than in the case of the ML(s).
In the described period, there was no follow-up of test results that exceeded the AL but not the ML. In fact, due to the high number of samples exceeding the AL for DL-PCBs in meat/fat for ruminants, this AL was increased in the EU in 2012 from 1 to 1.75 pg TEQ g−1 fat (similar applied for the AL for PCDD/Fs but to a lesser extent). An important consideration is that in most cases it may be difficult to reduce the DL-PCB levels in ruminants since both beef cows and sheep spend a large part of their life outside and ingestion of soil appears the most likely source for the contamination. However, this issue might deserve further studies, also because PCB-levels in soil in general appear to be lower than those of PCDD/Fs (Kijlstra et al. Citation2007; Traag et al. Citation2010b). When applying these new ALs and the WHO-TEFs from 2005 on our dataset, the number of meat samples exceeding the new AL would decrease from 81 (3.6%) to 23 (1.2%), in particular for sheep fat samples being from 45 to 17, and cow fat samples from 27 to 4 (Table S2). As for the MLs, the overall number of samples exceeding the ALs is rather low, suggesting low impact on existing levels.
Background levels in products of animal origin
To obtain insight in these background levels, it was initially decided to use pooled quarterly samples. In principle, this should give a more representative overview, since it includes higher sample numbers for each type of product. A disadvantage of the approach is that it is more difficult to make a distribution of the observed levels, which is important for evaluating the existing MLs and to evaluate the consequences of potential changes.
For each product, the GC-HRMS results for both the random individual (EU monitoring) and the pooled quarterly (PQ) samples were evaluated. By using the PQ samples, the average PCDD/F and DL-PCB levels for around 1800 samples was determined. The EU monitoring samples represent only 524 individual samples. In this case, WHO-TEFs from 2005 were applied, allowing comparison with the new EU limits that were introduced in 2012. In the Dutch National Plan primarily samples of fat tissue were tested, since these are easier to analyse for lipophilic contaminants. It is assumed that these compounds distribute evenly over the fat in the body, meaning that on a lipid base levels are similar in adipose tissue and meat. This was shown in some studies, e.g. for sheep and various species on Curaçao (Hoogenboom, Stark, et al. Citation2015), but Thorpe et al. (Citation2001) showed higher levels in meat than in adipose fat of cows, especially just after the start of the exposure. Also the data reported by EFSA (Citation2010, Citation2012) suggest some differences. For meat and fat from pigs, PCDD/F and DL-PCB levels in fat were higher than those in meat, for ruminants and poultry lower levels were reported for fat compared to meat. This may suggest differences in kinetics but it may also be caused by a different origin of the data, i.e. countries focusing on fat and others focusing on meat. Nevertheless, it was decided to compare the Dutch data to the levels in fat reported by EFSA.
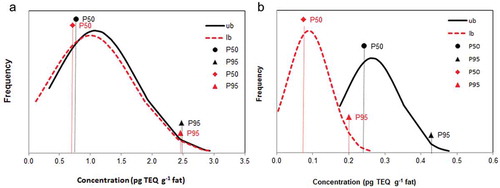
Based on the individually analysed EU monitoring samples, for each type of food, distribution curves were made based on all samples analysed in the entire period. shows examples of distribution curves for beef and chicken, including both the lower and upper bound levels for the sum of PCDD/Fs and DL-PCBs, including the median (P50) and P95 values. As demonstrated in (a) for beef, a small margin between upper and lower bound values was observed, meaning that most concentrations were above the LOQs. Similar were the cases for sheep fat, milk and eggs. For other matrices, like chicken fat ((b)), the difference between upper and lower bound levels was quite substantial. This was also observed for pigs and to a smaller extent for veal. This difference between lower and upper bound levels is also demonstrated by the results presented in , showing the mean TEQ levels for the pooled quarterly samples for the various matrices. It is evident that these differences, where applicable, only apply to PCDD/Fs and not the DL-PCBs, due to higher absolute levels of the latter compounds. In these PQ samples, highest total TEQ levels occurred in sheep and beef with equal or higher contribution of DL-PCBs. Chicken and pork fat showed very low levels. Levels in fat from calves were lower than those in cows.
Table 3. Distribution of mean lower and upper bound levels of PCDD/Fs and DL-PCBs (in pg TEQWHO2005 g−1 fat) based on pooled quarterly (PQ) samples from 2001–2009.
Figure 1. Frequency distribution of the levels of PCDD/Fs and DL-PCBs in (A) beef (n = 50) and (B) chicken (n = 65) using EU monitoring samples. Both lower and upper bound levels are shown, as well as the P50 (median) and P95 levels of both distributions (expressed in pg TEQWHO2005 g-1 fat).
For the EU monitoring samples, the mean, median and P95 upper bound values for PCDD/Fs, DL-PCBs and total TEQ are shown in , and compared to levels reported by EFSA (Citation2010) (Table S3 includes EFSA Citation2012 total TEQ levels). In general the mean levels for the EU monitoring samples are somewhat lower than those for the PQ samples (compared in Table S4). Since these samples cover a later period of time (2004–2011 versus 2001–2009) this suggests a decreasing time trend in the levels, as will be discussed below. Upperbound levels in beef and lamb were 0.77 and 0.85 pg TEQWHO2005 g−1 fat, respectively. These are comparable to the median level of 0.66 pg TEQWHO2005 g−1 fat reported for the total group of ruminants by EFSA in both 2010 and 2012 (, no discrimination between different species by EFSA). Mean and P95 values were similar as well, although the concentrations seen for sheep were slightly higher for the Dutch data. Fat from calves showed lower median, mean and P95 concentrations within the group of ruminants and revealed a threefold lower P95 than fat from cows.
Table 4. Distribution of upper bound PCDD/F, DL-PCB and total TEQ levels of Dutch EU monitoring data (2004–2011) and EFSA data (Citation2010). Levels in pg TEQ g−1 fat, based on WHO-TEFs2005 and compared with ALs/MLs applied since 2012.
As for the PQ samples, in chicken and pork fat, most concentrations were below the LOQ. Median lower and upper bound values for total TEQ were 0.08 and 0.24 for chicken, and 0.03 and 0.20 pg TEQWHO2005 g−1 fat for pigs. The median upper bound levels for pig fat are much lower than those reported by EFSA in 2010, but comparable to those reported in 2012 (EFSA Citation2012), being 0.54 and 0.16 pg TEQWHO2005 g−1 fat, respectively. Median levels for poultry fat are comparable. However, for Dutch poultry, the P95 levels in fat were three to four times lower than that reported by EFSA. For pig fat much higher P95 levels were reported by EFSA in 2010 (9.70) but similar ones in 2012 (0.42 versus 0.35).
For milk, a quite small margin between median lower and upper bound levels was observed, meaning that most concentrations were above the LOQ. Median lower and upper bound values for milk were 0.61 and 0.71 pg TEQWHO2005 g−1 fat, respectively, the latter being comparable to the median upper bound levels of 0.90 and 0.77 pg TEQWHO2005 g−1 fat reported by EFSA in 2010 () and 2012. For the mean and P95 the situation was quite different, showing respectively two to three times and four to five times higher levels in the EFSA dataset. The mean concentration of the PQ samples () was 0.78 pg TEQWHO2005 g−1 fat, which is comparable with the EU monitoring samples.
In the case of eggs, a somewhat larger margin between average and median lower and upper bound levels was observed. A considerable number of samples was at or below the LOQ. Median lower and upper bound values for eggs were 0.28 and 0.37 pg TEQWHO2005 g−1 fat, the latter being around 2/3 of the median upper bound levels of 0.69 and 0.61 pg TEQWHO2005 g−1 fat reported by EFSA in 2010 () and 2012, respectively. Also mean and P95 values are respectively three and five times lower than those in the EFSA dataset. The average concentration of the PQ samples () was 0.60 pg TEQWHO2005 g−1 fat, which is comparable with EFSA, but higher than the EU monitoring samples.
The PCDD/F and DL-PCB concentrations in deer fat were relatively high compared to the other food groups. There are no EU limits for this food product but MLs and ALs for ruminants would be exceeded by respectively 23 and 38 samples (61% and 100%). Concentrations ranged from 0.4 to 5.9 pg TEQ g−1 for PCDD/Fs (mean = 2.2, P50 = 1.8), 1.2 to 50.3 for DL-PCBs (mean = 7.0, P50 = 5.4) and 2.0 to 56.2 for the sum (mean = 9.2, P50 = 7.4). So the high levels are in all cases linked to high DL-PCB concentrations.
In the study by EFSA, PCDD/F and DL-PCB concentrations of beef, veal and lamb were not estimated individually but as a whole group of ruminants. By using this approach, these concentrations could very much be influenced by the ratio in which beef, veal and lamb samples are included in the dataset. The concentration of PCDD/Fs and DL-PCBs could e.g. depend on the age of the animal, assuming that the younger the animal, the less time for PCDD/Fs and DL-PCBs to accumulate in the body. This was confirmed in the present study, showing that average PCDD/F and DL-PCB concentrations in veal were generally half of the levels found in beef. However, a difference in housing might also play an important role, as ingestion of soil may be an important PCDD/F and DL-PCB source for beef cattle but not for veal calves which are normally kept inside in the Netherlands. Slightly higher concentrations were seen in lamb compared to beef. Possible reasons are that sheep graze closer to the ground and are more outside, including the winter period when levels of PCDD/Fs and DL-PCBs in grass are known to be much higher than in summer time. The latter may also apply to farmed deer which showed the highest levels in fat. The DL-PCBs contributed most to the TEQ, on average 73%, again raising the question about the source. There are currently no maximum or action levels for this type of products. However, the consumption of deer meat is assumed to be infrequent, resulting in a relatively low contribution to the overall human intake of PCDD/Fs and DL-PCBs. Nevertheless, a minority of the population may have a much higher intake and an investigation on the source of the high levels may be of interest.
It can be concluded that rather similar results were observed for the average levels of PQ and EU samples in the Netherlands, and these were in general lower than those reported by EFSA in 2010 (). This certainly applied for the P95 levels, which is in agreement with the low number of non-compliant samples. The difference may be due to differences in the levels in the various member states that reported their data to EFSA. However, it might also be possible that a proportion of the samples in the EFSA database reflects target monitoring, most likely as a follow-up of incidents. This could provide a bias on the evaluation of background levels in Europe. Since the MLs are primarily based on these samples at the higher end of the distribution, the inclusion of such samples has important consequences for the EU policy to reduce the levels by setting limits according to the principle ‘strict but feasible’.
Time trends in levels
Time trends are an important instrument for evaluating policies to reduce levels. The GC-HRMS data of the EU monitoring and PQ samples were therefore evaluated for such time trends. Data are presented in Table S4 and Figure S1. Results for beef (EU and PQ samples), and chicken and milk (EU samples) are shown in . As almost no difference was found between median and average (= mean) values per year, it was decided to present only average values. Both lower and upper bound values are presented. As a first step, simple regression analysis with the Pearson correlation coefficient (MS Excel®) was used to determine the significance of an increase or decrease. In this regard an r2 value of 0.3 or higher is considered significant.
Figure 2. Variability of the mean levels of PCDD/Fs and DL-PCBs in (A) beef EU monitoring samples, (B) beef PQ samples, (C) EU monitoring samples chicken, and D) EU monitoring samples milk. Both lower [lb] and upper [ub] bound mean levels are presented, as well as the highest/lowest values per year (expressed in pg TEQWHO2005 g-1fat).
![Figure 2. Variability of the mean levels of PCDD/Fs and DL-PCBs in (A) beef EU monitoring samples, (B) beef PQ samples, (C) EU monitoring samples chicken, and D) EU monitoring samples milk. Both lower [lb] and upper [ub] bound mean levels are presented, as well as the highest/lowest values per year (expressed in pg TEQWHO2005 g-1fat).](/cms/asset/48092bee-88d0-4a9d-881b-d6e2c111b9c8/tfac_a_1252065_f0002_b.gif)
As mentioned above, for beef the lower and upper bound values were quite similar ((a) and 2(b)). The average values seem to decrease significantly in the EU monitoring (r2 = 0.63 and r2 = 0.66, lb and ub respectively), but also the PQ samples (r2 = 0.52 and r2 = 0.57, respectively). This was also observed when using the median values for the EU monitoring samples (r2 = 0.74 and r2 = 0.76, lb and ub respectively, data not shown). It is clear, especially from the PQ samples, which represent a much larger number of samples, that the overall decrease is low. For the EU samples, the numbers of samples are much lower and as such more prone to variation. In particular in these samples, there appears to be a decrease in the average concentration after 2007, but this is possibly connected to a change in LOQ values (discussed below).
For fat from sheep and veal, mean values were available in only three or four years, respectively, which is a rather short time frame for trend analysis. A slight decrease was observed for average values for sheep fat (Table S5, Figure S1, EU samples: r2 = 0.46, r2 = 0.50 for lb and ub respectively), whereas for the PQ samples there was no significant increase or decrease (r2 = 0.15 and r2 = 0.17, respectively). Again, the decrease is rather small (ranges from −0.01 to −0.15 pg TEQTEF-WHO2005 g−1 per year). Average concentrations for fat from calves remained at a constant level, with a correlation of r2 = 0.21 and r2 = 0.00 (lb and ub respectively) for EU samples, but decreased significantly for the PQ samples (r2 = 0.53 and r2 = 0.79 for lb and ub respectively).
For milk ((d), EU samples) the decrease of the average values is significant for upper but not for lower bound (EU: r2 = 0.81, r2 = 0.28; PQ: r2 = 0.58, r2 = 0.06, respectively). Due to the high number of chicken ((c)), pork and egg samples which were at or below the LOQ, these samples were not suitable for trend analysis. As shown in Table S4, there was an apparent decrease in upper bound levels in 2008, related to the change in LOQ levels (see below).
When using the Mann–Kendall trend test, in none of the food groups a significant trend was found in lower and upper bound median concentrations of the sum of PCDD/Fs and DL-PCBs, except for upper bound milk values (data not shown). Although the significance for the decrease in upper bound milk values was p = 0.05, a Sen’s slope estimate of −0.02 indicates that the change in concentrations over the years still seems to be rather minor.
Overall it can be concluded that there seems to be no clear decreasing trend for the products described in this paper over the period 2001–2011. Some products seem to show a slight decrease, but this could not be statistically verified and if so the changes appeared rather small. Application of more sensitive methods, potentially in combination with pooled annual samples, is needed to improve the situation. On the other hand, the question is whether a further decrease in the levels could be expected during this period. The effects of interventions leading to reduction in aerial emissions of PCDD/Fs from regulated processes, like waste incineration and agricultural combustion, were already occurring in the 1990s. This clearly affected the levels in grass and as a result milk from grazing animals during that period. As shown in Table S5, levels in Dutch cows’ milk collected in the winter of 1990–1991 were reported to be around 3.2 (range 1.6–4.3) in rural areas, 5.3 (range 3.3–8.1) in areas near rivers, and 10.5 (range 5.0–16.7) pg TEQ g−1 fat near municipal waste incinerators (based on PCDD/Fs and PCBs 77, 126 and 169, recalculated with WHO-TEFs2005) (Van Rhijn et al. Citation1993). The levels reported here for the first years of the monitoring project are very similar to those reported by Baumann et al. (Citation2002, Citation2003) for that period (See Table S5). Higher levels were observed for the end of 1997 and beginning of 1998, probably due to the incident with contaminated citrus pulp (Malisch Citation2000). Contrary to grass, soil levels in contaminated areas seem not to decrease rapidly (Traag et al. Citation2010b) and, although grass was the more important source originally, soil intake may be responsible for the current background levels of PCDD/Fs in milk and fat from grazing animals. As already mentioned, this may not apply for DL-PCBs since their levels in soil are much lower. The increased monitoring resulted in the discovery of a number of incidents in feed and food, some with rather high levels (Hoogenboom, Traag, et al. Citation2015). However, the low fraction of samples exceeding the MLs did not really form an incentive for further studies on sources responsible for the current background levels. The follow-up of samples exceeding the ALs was initially rather poor, especially for samples where the environment seemed a plausible cause of the contamination (ruminants). Nevertheless, in the area of eggs from free-range chickens, self-regulation programmes resulted in the discovery of various, often unexpected sources, like PCBs in coatings of roof plates and reused building debris (Hoogenboom et al. Citation2014). As a result, farms had to take measures to reduce the levels. It should be questioned if it is realistic to obtain a further decrease in the already low concentrations in e.g. chicken and pork meat, and/or if the time frame chosen and the number of samples available were sufficient to reveal changes over time. An interesting issue is whether observed changes in exposure were due to a real decrease in the levels or merely a change in dietary habits or improved performance of the analytical methods, the latter implying that exposure in the past was overestimated due to the use of upper or middle bound levels.
Effect of LOQs on lower and upper bound levels
Application of upper, but also middle bound, levels for exposure assessment and trend analysis also means that a change of LOQs may have a large impact, especially when many data are left censored. The two examples shown in illustrate that also when applying the GC-HRMS method the precise value for many samples is unknown but lies within the lower to upper bound interval. By using upper bound levels, PCDD/F and DL-PCB concentrations are overestimated in most of the chicken and pork samples, which were in most cases below the LOQ (100% and 97%, respectively). However, also for more than half (56%) of the egg samples, concentrations were below the LOQ. In the case of beef and sheep fat, as well as milk, almost no samples were below the LOQ and the range between lower and upper bound values was small (). It is evident that the LOQ plays an important role in the levels.
In the period 2001–2011, RIKILT applied conservative reporting limits in order to avoid large fluctuations in the reported upper bound levels. These reporting limits were applied to determine upper bound levels. In 2007, it was evaluated whether lower reporting limits could be applied based on the existing LOQs. It was decided to lower them for PCDD/Fs, for the penta- and hexachlorinated congeners from 0.10 to 0.05 pg g−1 fat, for the heptachlorinated congeners from 0.25 to 0.05 and for OCDD/F from 0.5 to 0.1 pg g−1 fat. This had two important consequences. For some samples the lower bound levels might increase because more congeners were detectable at levels between the old and new applied LOQs. However, more important is that for certain samples the upperbound levels were likely to decrease. To evaluate these effects, levels in EU monitoring samples from 2007, 2008 and 2009 were calculated by applying both the old and new LOQs. shows the comparison of the new and old LOQs for lower (A) and upper bound (B) PCDD/F levels in milk. It is clear that for the lower bound levels (A), at very low levels there is no effect, for intermediate levels there is an increase and for higher levels no difference. For the upper bound levels (B) the old LOQs result in clearly higher levels when few congeners are detected but at higher levels there is no difference.
Figure 3. Effect of the new lower reporting limits on the lower (A) and upper bound (B) PCDD/F levels in individual milk samples from 2007, 2008 and 2009 (using WHO-TEFs 2005).
shows the effect on the median upperbound PCDD/F levels in various food groups with decreases for 40% for pork, 38% for chicken, 25% for eggs, 18% for calf, 13% for milk, 11% for beef and 3% for sheep. There was a clear relation with the levels in the various products, i.e. for pork and chicken with very low levels, the decrease in upper bound levels was largest. Decreases for the mean levels were very similar (data not shown). The LOQs for DL-PCBs were unchanged, meaning that the relative effect on the sum TEQ was smaller but for some matrices still substantial, being 36% for pork, 33% for chicken, 19% for eggs, 9% for calf, 5% for beef, 6% for milk and 1% for sheep (see ).
Table 5. Effect of the reduction of LOQs on the median lower and upper bound levels for PCDD/Fs and the total TEQ in EU monitoring samples from 2007, 2008 and 2009 (expressed in pg TEQWHO2005 g−1 fat).
Conclusions
The current paper shows that it is very useful to combine data of various monitoring programmes on food and feed contaminants and evaluate these datasets. For PCDD/Fs and DL-PCBs, the number of Dutch samples non-compliant with the MLs and even the ALs was smaller than could be expected. This might be due to measures already taken in previous decades, resulting in a considerable decrease in food levels and human exposure (Liem et al. Citation2000). As such, the current limits for PCDD/Fs and DL-PCBs do not provide an incentive for further reducing the levels in the Netherlands. However, these levels may have reached a general background level that is rather difficult to be further decreased, also due to background levels in the environment. The latter implies that food commodities coming from foraging animals, for which main exposure is derived from ingested soil, will demonstrate relatively high dioxin levels that might occasionally even exceed the EU standards. Current exposure assessments do not indicate that consumption of products from foraging animals results in exceeding the existing TWI. Nevertheless, strict ALs and appropriate follow-up may help to identify contaminated farms and allow an evaluation of whether further reduction of the contamination can be achieved.
In addition, incidents may still occur and application of screening methods, allowing the testing of larger sample volumes, strongly increases the chance of detecting such cases. For following potential time trends in levels, methods should have the sensitivity required to measure existing levels with sufficient precision. Data used for time trends, both in the levels and the exposure, should be carefully evaluated in order to exclude technical issues like changes in LOQs.
FigSupG2
Download TIFF Image (619.4 KB)FigSupG1
Download TIFF Image (620.5 KB)FigSupF2
Download TIFF Image (622.1 KB)FigSupF1
Download TIFF Image (621 KB)FigSupE2
Download TIFF Image (622.1 KB)FigSupE1
Download TIFF Image (619.4 KB)FigSupD2
Download TIFF Image (622.1 KB)FigSupD1
Download TIFF Image (621 KB)FigSupC2
Download TIFF Image (622.1 KB)FigSupC1
Download TIFF Image (621 KB)FigSupB2
Download TIFF Image (622.1 KB)FigSupB1
Download TIFF Image (621 KB)FigSupA2
Download TIFF Image (621 KB)FigSupA1
Download TIFF Image (621 KB)Table S5
Download MS Word (63.1 KB)Table S4
Download MS Word (24.3 KB)Table_S3.docx
Download MS Word (43.9 KB)Table S2b
Download MS Word (29.5 KB)Table S2a
Download MS Word (29.7 KB)Table S1
Download MS Word (37 KB)Acknowledgements
The work was financed by the Dutch Ministry of Economic Affairs (EZ). The authors would also like to thank the many colleagues that have been involved in the monitoring of dioxins and PCBs for many years and especially in the period described, in particular Wim Traag, Jaap Immerzeel, Liza Portier, Cornelis van der Kraats, Joan Vlaanderen and Gerlof Oegema. Ine van der Fels–Klerx is acknowledged for her critical review of the paper.
Disclosure statement
No potential conflict of interest was reported by the authors.
Supplemental material
Supplemental data for this article can be accessed here
Additional information
Funding
Related Research Data
References
- Baccarelli A, Giacomini S, Corbetta C, Landi M, Bonzini M, Consonni D, Grillo P, Patterson D, Pesatori A, Bertazzi P. 2008. Neonatal thyroid function in Seveso 25 years after maternal exposure to dioxin. PLoS Med. 5:1133–1142.
- Baumann RA, den Boer AC, Groenemeijer GS, den Hartog RS, Hijman WC, Liem AKD, Marsman JA, Hoogerbrugge R 2002. Dioxinen en dioxineachtige PCBs in Nederlandse consumptiemelk: trendonderzoek 1997-2001. RIVM rapport 639102024/2002. www.rivm.nl
- Baumann RA, den Boer AC, Groenemeijer GS, den Hartog RS, Hijman WC, Stoffelsen BHG, Hoogerbrugge R. 2003. Dioxins and non-ortho PCBs in Dutch consumer milk in the period 1997-2002. Organohalogen Compounds. 63:433–436.
- Bergkvist C, Oberg M, Appelgren M, Becker W, Aune M, Ankarberg E, Berglund M, Håkansson H. 2008. Exposure to dioxin-like pollutants via different food commodities in Swedish children and young adults. Food Chem Toxicol. 46:3360–3367.
- Bernard A, Hermans C, Broeckaert F, Poorter GD, Cock AD, Hoins G. 1999. Food contamination by PCBs and dioxins; an isolated episode in Belgium is unlikely to have affected public health. Nature. 401:231–232.
- Bovee TFH, Hoogenboom LAP, Hamers ARM, Aarts JMMJG, Brouwer A, Kuiper HA. 1998. Validation and use of the CALUX-bioassay for the detection of dioxins and coplanar 380 PCBs in bovine milk. Food Addit Contam. 15:863–875.
- De Mul A, Bakker M, Zeilmaker M, Traag W, Leeuwen SV, Hoogenboom R, Boon P, Klaveren J. 2008. Dietary exposure to dioxins and dioxin-like PCBs in The Netherlands anno 2004. Regul Toxicol Pharmacol. 51:278–287.
- EC. 1996. Council directive 96/23/EC of 29 April 1996 on measures to monitor certain substances and residues thereof in live animals and animal products and repealing directives 85/358/EEC and 86/469/EEC and Decisions 89/187/EEC and 91/664/EEC. Off J Eur Union. May 23; L 125:10–32.
- EC. 2001. Communication from the commission to the council, the European parliament and the economic and social committee; community strategy for dioxins, furans and polychlorinated biphenyls, COM/2001/0593. Off J. Nov 17; 322:0002–0018.
- EC. 2002. Commission Directive 2002/69/EC of 26 July 2002 laying down the sampling methods and the methods of analysis for the official control of dioxins and the determination of dioxin-like PCBs in foodstuffs. Off J Eur Comm. L209:5–14.
- EC. 2004. Commission Recommendation 2004/705/EC of 11 October 2004 on the monitoring of background levels of dioxins and dioxin-like PCBs in foodstuffs. Off J Eur Union L. Oct 22; 321:45–52.
- EC. 2006a. Commission Recommendation 2006/794/EC of 16 November 2006 on the monitoring of background levels of dioxins, dioxin-like PCBs and non-dioxin-like PCBs in foodstuffs. Off J Eur Union. Nov 22; L 322:24–31.
- EC. 2006b. Commission regulation (EC) no. 1881/2006, of 19 December 2006 setting maximum levels for certain contaminants in foodstuffs. Off J Eur Union. Dec 20; L 364:5–24.
- EC. 2006c. Commission regulation (EC) no. 1883/2006 of 19 December 2006 laying down methods of sampling and analysis for the official control of levels of dioxins and dioxin-like PCBs in certain foodstuffs. Off J Eur Union. Dec 21; L 364:32–43.
- EC 2006d. Commission regulation (EC) no 199/2006 of 3 February 2006 amending Regulation (EC) no 466/2001 setting maximum levels for certain contaminants in foodstuffs as regards dioxins and dioxin-like PCBs. Off J Eur Union. L32:34–38.
- EC. 2011a. Commission recommendation 2011/516/EU of 23 August 2011 on the reduction of the presence of dioxins, furans and PCBs in feed and food. Off J Eur Union. Aug 24; L 218:23–25.
- EC. 2011b. Commission regulation (EU) no. 1259/2011 of 2 December 2011 amending regulation (EC) No 1881/2006 as regards maximum levels for dioxins, dioxin-like PCBs and non dioxin-like PCBs in foodstuffs. Off J Eur Union. Dec 3; L 320:18–23.
- EFSA. 2010. Results of the monitoring of dioxin levels in food and feed. EFSA J. 8:1–35.
- EFSA. 2012. Update of the monitoring of levels of dioxins and PCBs in food and feed. EFSA J. 10:1–82.
- EPA. 2012. Reanalysis of key issues related to dioxin toxicity and response to NAS Comments, volume 1 (CAS no. 1746-01-6). EPA/600/R-10/038F. Available from: www.epa.gov/iris
- Fattore E, Fanelli R, Turrini A, Di Domenico A. 2006. Current dietary exposure to polychlorodibenzop-dioxins, polychlorodibenzofurans, and dioxin-like polychlorobiphenyls in Italy. Mol Nutr Food Res. 50:915–921.
- FSA. 2003. Dioxins and dioxin-like PCBs in the UK diet: 2001 total diet study samples. Food Survey Information Sheet No. 38/03. London: Food Standards Agency.
- Hoogenboom LAP, Bovee TFH, Portier L, Bor G, Weg GVD, Onstenk C, Traag WA. 2004. The German bakery waste incident; use of a combined approach of screening and confirmation for dioxins in feed and food. Talanta. 63:1249–1253.
- Hoogenboom LAP, Eijkeren JCHV, Zeilmaker MJ, Mengelers MJB, Herbes R, Immerzeel J, Traag WA. 2007. A novel source for dioxins present in recycled fat from gelatin production. Chemosphere. 68:814–823.
- Hoogenboom LAP, Traag WA, Fernandes A, Rose M. 2015. European developments following incidents with dioxins and PCBs in the food and feed chain. Food Control. 50:670–683.
- Hoogenboom R, Ten Dam G, Immerzeel J, Traag W. 2014. Building related sources of PCBs in eggs from free-range hens. Organohalogen Compounds. 76:1700–1703.
- Hoogenboom RLAP, Stark M-L, Spolders M, Zeilmaker MJ, Traag WA, Ten Dam G, Schafft HA. 2015. Accumulation of polychlorinated dibenzo-p-dioxins, dibenzofurans, and biphenyls in livers of young sheep. Chemosphere. 122:137–144.
- Kijlstra A, Traag WA, Hoogenboom LAP. 2007. Effect of flock size on dioxin levels in eggs from chickens kept outside. Poult Sci. 86:2042–2048.
- Kiviranta H, Ovaskainen M, Vartiainen T. 2004. Market basket study on dietary intake of PCDD/Fs, PCBs, and PBDEs in Finland. Environ Int. 30:923–932.
- Liem AKD, Fürst P, Rappe C. 2000. Exposure of populations to dioxins and related compounds. Food Addit Contam. 17:241–259.
- Liem AKD, Hoogerbrugge R, Kootstra PR, van der Velde EG, De Jong APJM. 1991. Occurrence of dioxins in cow’s milk in the vicinity of municipal waste incinerators and a metal reclamation plant in the Netherlands. Chemosphere. 23:1975–1984.
- Malisch R. 2000. Increase of the PCDD/F-contamination of milk, butter and meat samples by use of contaminated citrus pulp. Chemosphere. 40:1041–1053.
- Malisch R, Kotz A. 2014. Dioxins and PCBs in feed and food-Review from European perspective. Sci Total Environ. 491:2–10.
- Marin S, Villalba P, Diaz-Ferrero J, Font G, Yusà V. 2011. Congener profile, occurrence and estimated dietary intake of dioxins and dioxin-like PCBs in foods marketed in the Region of Valencia (Spain). Chemosphere. 82:1253–1261.
- Mocarelli P, Gerthoux PM, Patterson DG Jr, Milani S, Limonta G, Bertona M, Signorini S, Tramacere P, Colombo L, Crespi C, et al. 2008. Dioxin exposure, from infancy through puberty, produces endocrine disruption and affects human semen quality. Environ Health Perspect. 116:70–77.
- Perelló G, Gómez-Catalán J, Castell V, Llobet J, Domongo J. 2012. Assessment of the temporal trend of the dietary exposure to PCDD/Fs and PCBs in Catalonia, over Spain: health risks. Food Chem Toxicol. 50:399–408.
- RASFF. 2010. Annual Report 2010. Available from https://ec.europa.eu/food/sites/food/files/safety/docs/rasff_annual_report_2010_en.pdf
- Salmi T, Määttä A, Anttilla P, Ruoho-Airola T, Amnell T. 2002. Detecting trends of annual values of atmospheric pollutants by the Mann-Kendall test and Sen’s slope estimates - the Excel template application MAKESENS. In: Publications on air quality. Vol. 31. Helsinki: Finnish Meteorological Institute.
- SCF. 2001. Opinion of the SCF on the risk assessment of dioxins and dioxin-like PCBs in food, update based on new scientific information available since the adoption of the SCF opinion on 22 November 2000, adopted on 30 May 2001. Brussels: European Commission. Available from: http://www.sciencedirect.com/science/article/pii/S0048969714003520#bb0140
- Sirot V, Tard A, Venisseau A, Brosseaud A, Marchand P, Le Bizec B, Leblanc J. 2012. Dietary exposure to polychlorinated dibenzo-p-dioxins, polychlorinated dibenzofurans and polychlorinated biphenyls of the French population: results of the second French total diet study. Chemosphere. 88:492–500.
- Tard A, Gallotti S, Leblanc J, Volatier J. 2007. Dioxins, furans and dioxin-like PCBs: occurrence in food and dietary intake in France. Food Addit Contam. 24:1007–1017.
- Thorpe S, Kelly M, Startin J, Harrison N, Rose M. 2001. Concentration changes for 5 PCDD/F congeners after administration in beef cattle. Chemosphere. 43:869–879.
- Törnkvist A, Glynn A, Aune M, Darnerud P, Ankarberge E. 2011. PCDD/F, PCB, PBDE, HBCD and chlorinated pesticides in a Swedish market basket from 2005–levels and dietary intake estimations. Chemosphere. 83:193–199.
- Traag W, Zeilmaker M, Van Eijkeren J, Hoogenboom L. 2010b. Onderzoek naar de effectiviteit van bodembewerking op het gehalte van dioxines en dioxine-achtige PCB’s in het Rijnmondgebied. In: Rapport 2010.012. Rikilt - Institute of Food Safety, Wageningen University & Research Centre. Available from: http://edepot.wur.nl/160451
- Traag WA, Kotz A, van der Weg G, Malisch R, Hoogenboom R. 2009. Bioassay directed detection of brominated dioxins in the feed additive choline chloride. Organohal Comp. 71:2210–2213.
- Traag WA, Portier L, Bovee TFH, Weg GVD, Onstenk C, Elghouch N, Coors R, Kraats CVD, Hoogenboom LAP. 2002. Residues of dioxins and coplanar PCBs in eggs of free range chickens. Organohalogen Compounds. 57:245–248.
- Traag WA, Zeilmaker MJ, Herbes R, Hoogenboom LAP. 2010a. Dioxins in organic eggs due to contaminated corn. Organohalogen Compounds. 72:1900–1903.
- Tuinstra LGMT, Traag WA, Van Rhijn JA, Van De Spreng PF. 1994. The Dutch PCB/dioxin study: development of a method for the determination of dioxins, planar and other PCBs in human milk. Chemosphere. 29:1859–1875.
- Van den Berg M, Birnbaum L, Denison M, DeVito M, Farland W, Feeley M, Fiedler H, Hakanson H, Hanberg A, Haws L, et al. 2006. The 2005 world health organisation reevaluation of human and mammalian toxic equivalency factors for dioxins and dioxin-like compounds. Toxicological Sci. 93:223–241.
- Van den Berg M, Birnbaum LS, Bosveld ATC, Brunström B, Cook PH, Feeley M, Giesy JP, Hanberg A, Hasegawa R, Kennedy SW, et al. 1998. Toxic equivalency factors (TEFs) for PCBs, PCDDs, PCDFs for humans and wildlife. Environ Health Perspect. 106:775–792.
- Van Larebeke N, Hens L, Schepens P, Covaci A, Bayens J, Everaert K, Bernheim JL, Vlietinck R, Poorter GD. 2001. The Belgian PCB and dioxin incident of January-June 1999: exposure data and potential impact on health. Environ Health Perspect. 109:265–273.
- Van Rhijn JA, Traag WA, Van De Spreng PF, Tuinstra L. 1993. Simultaneous determination of planar chlorobiphenyls and polychlorinated dibenzo-p-dioxins and -furans in Dutch milk using isotope dilution and gas chromatography—high-resolution mass spectrometry. J Chromatogr. 630:297–306.
- Weijs P, Bakker M, Korver K, Van Goor-Ghanaviztchi K, Van Wijnen J. 2006. Dioxin and dioxin-like PCB exposure of non-breastfed Dutch infants. Chemosphere. 64:1521–1525.
- WHO. 2000. Consultation on assessment of the health risk of dioxins; re-evaluation of the tolerable daily intake (TDI): executive summary. Food Addit Contam. 17:223–240.
- Windal I, Vandevijvere S, Maleki M, Goscinny S, Vinkx C, Focant J, Eppe G, Hanot V, Van Loco J. 2010. Dietary intake of PCDD/Fs and dioxin-like PCBs of the Belgian population. Chemosphere. 79:334–340.